HAL Id: hal-00317978
https://hal.archives-ouvertes.fr/hal-00317978
Submitted on 22 Nov 2005
HAL is a multi-disciplinary open access
archive for the deposit and dissemination of
sci-entific research documents, whether they are
pub-lished or not. The documents may come from
teaching and research institutions in France or
abroad, or from public or private research centers.
L’archive ouverte pluridisciplinaire HAL, est
destinée au dépôt et à la diffusion de documents
scientifiques de niveau recherche, publiés ou non,
émanant des établissements d’enseignement et de
recherche français ou étrangers, des laboratoires
publics ou privés.
Predicting the occurrence of super-storms
N. Srivastava
To cite this version:
N. Srivastava. Predicting the occurrence of super-storms. Annales Geophysicae, European Geosciences
Union, 2005, 23 (9), pp.2989-2995. �hal-00317978�
SRef-ID: 1432-0576/ag/2005-23-2989 © European Geosciences Union 2005
Annales
Geophysicae
Predicting the occurrence of super-storms
N. Srivastava
Udaipur Solar Observatory, Physical Research Laboratory, P.O. Box 198, Udaipur, India
Received: 28 February 2005 – Revised: 15 July 2005 – Accepted: 20 July 2005 – Published: 22 November 2005 Part of Special Issue “1st European Space Weather Week (ESWW)”
Abstract. A comparative study of five super-storms (Dst<−300 nT) of the current solar cycle after the launch
of SoHO, to identify solar and interplanetary variables that influence the magnitude of resulting geomagnetic storms, is described. Amongst solar variables, the initial speed of a CME is considered the most reliable predictor of the strength of the associated geomagnetic storm because fast mass ejec-tions are responsible for building up the ram pressure at the Earth’s magnetosphere. However, although most of the super-storms studied were associated with high speed CMEs, the Dst index of the resulting geomagnetic storms varied
between −300 to −472 nT. The most intense storm of 20 November 2003, (Dst∼−472 nT) had its source in a
com-paratively smaller active region and was associated with a relatively weaker, M-class flare while all other super-storms had their origins in large active regions and were associated with strong X-class flares. However, this superstorm did not show any associated extraordinary solar and interplanetary characteristics. The study also reveals the challenge in the reliable prediction of the magnitude of a geomagnetic storm from solar and interplanetary variables.
Keywords. Solar physics, astrophysics, and astronomy
(Flares and mass ejections) – Magnetospheric physics (Solar wind-magnetosphere interactions; Storms and substorms)
1 Introduction
Previous space weather studies have promoted our under-standing of the major factors that produce strong geomag-netic storms at the Earth. We now know that CMEs are the major causes of geomagnetic activity at the Earth (Feyn-man and Gabriel, 2000; Plunkett et al., 2001; Wang et al., 2002; Zhang et al., 2003; Vilmer et al., 2003; Srivastava and Venkatakrishnan, 2004). Intense geomagnetic activity can also occur due to fast streams originating from coronal holes (Klein and Burlaga, 1982; Sheeley et al., 1976). These
stud-Correspondence to: N. Srivastava
ies have also helped in the identification of various solar and interplanetary characteristics of major geomagnetic storms. Several studies of interplanetary sources of the geomagnetic activity show that the solar wind speed and southward com-ponent of the interplanetary magnetic field (IMF) are impor-tant variables in predicting the geo-effectiveness of a CME (Cane et al., 2000; Richardson et al., 2000). Predicting the space weather involves the prediction of a) the time of ar-rival of the CME at the Earth and b) the magnitude of the resulting geomagnetic storm. The present prediction scheme of the magnitude of the resulting geomagnetic storms is gen-erally reliable and depends on measured interplanetary char-acteristics namely the solar wind velocity and the southward component of the IMF (Bz). The prediction of the Dst index,
which is a measure of the geomagnetic activity, is done in real time by various groups (O’Brien and McPherron, 2000; Feldstein, 1992; Fenrich, 1998), on the basis of inputs from the original formula of Burton et al. (1975). However, the solar properties that influence the interplanetary properties have not been widely investigated in detail. Srivastava and Venkatakrishnan (2004) recently attempted to identify solar variables that control interplanetary variables responsible for producing major geomagnetic storms. Their results show that fast full-halo CMEs associated with strong flares and originating close to the central meridian and low and mid-dle latitudes are potentially favourable candidates for produc-ing strong ram pressure at the Earth’s magnetosphere. They found out that the initial speeds tend to influence the solar wind speed measured close to the Earth and, hence, the ram pressure. The initial speeds also tend to influence the arrival time of the CMEs at the Earth. The results of the attempts to estimate the arrival time of CMEs at the Earth vary. For example, Cane et al. (2000) and Gopalswamy et al. (2000, 2001a, 2001b) proposed an empirical model to predict the arrival time of CMEs at the earth, but obtained different re-sults. Some authors estimate the arrival time based on iden-tifiable ejecta while others estimate the same based on storm characteristics, for example, the start of the Kpor the Dst
in-dices. Other relations for estimating the arrival time based on the CME initial speeds have also been derived by statistical
2990 N. Srivastava: Predicting the occurrence of super-storms
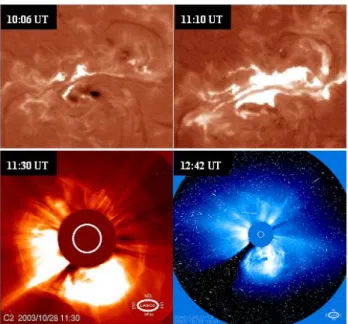
Fig. 1. The X17 class flare associated with a CME which led to a super-storm on 29 October 2003. The upper panels show a chro-mospheric image of the NOAA AR 10486 in Hα, observed from
Udaipur Solar Observatory on 28 October 2003. The lower two panels show the associated CME observed by LASCO-C2 and C3 coronagraphs aboard SoHO, in white light.
analyses of geo-effective events (Wang et al., 2002; Zhang et al., 2003; Srivastava and Venkatakrishnan, 2004). Recently, Schwenn et al. (2005) obtained a relation of the travel time of the CMEs and the expansion speeds of the CMEs. The expansion speed is the speed measured across the full CME in the direction perpendicular to the direction of the radial speed. The radial speed is deduced from the measured ex-pansion speeds of the CMEs.
The following section describes the super-storms (Dst<−300 nT) of the current solar cycle and their source
CMEs. In fact, the present study was motivated by the severe geomagnetic storms of October−November 2003, all leading to a Dst index (<−300 nT). For sake of completion,
events of similar magnitude recorded after the launch of SoHO, were also included and a comparative study was made. These events are not only severe but also rare and extremely important from the space weather prediction perspective. Some unresolved problems in the prediction of super-storms are also highlighted.
2 Observations
In the current solar cycle, five super-storms (Dst<−300 nT)
were recorded. Each had its source in a coronal mass ejec-tion, as recorded by LASCO coronagraphs (Brueckner et al., 1995), originating from large active regions on the solar sur-face. The details of the solar observations and the associated interplanetary and geomagnetic activity of these events are described below:
1. 15 July 2000 (Dst∼−300 nT): The geomagnetic storm
of 15 July was associated with a full halo CME recorded on 14 July 2000. The CME, which is also known as the “Bastille day” event, was first recorded in LASCO-C2 images at 10:54 UT as a bright front extending all around the occulting disk. The approximate plane-of-sky speed of the CME was 1775 km s−1at position an-gle 262◦. The source of this CME was identified in the images recorded in 195 ˚A by the EIT telescope (De-laboudiniere et al., 1995) as a flare in the NOAA AR 9077. The flare was associated with an EIT wave orig-inating at 10:12 UT near the disk center at location N17E01. An EIT wave is known as a coronal distur-bance, typically appearing as a bright rim, and is ob-served to propagate across the Sun. Biesecker et al. (2002) showed that EIT waves are strongly correlated with coronal mass ejections. All EIT waves have asso-ciated CMEs. But the converse is not true. In fact, Sri-vastava and Venkatakrishnan (2004) showed that 74% of strong flare-associated geo-effective CMEs are asso-ciated with EIT waves, thus making it an important ob-servable signature of a geo-effective CME. Concurrent with this flare, an X5.7 class flare was reported by the GOES X-ray satellite, starting at 10:03 UT. In optical wavelengths, a 3B flare was reported. For further de-tails of this CME, the reader is referred to Solar Physics, 204, 1 and 2, 2001.
2. 31 March 2001 (Dst∼−387 nT): The CME of 29 March
2001 was observed as a full halo by LASCO coro-nagraphs. It had an initial plane-of-sky speed of
∼900 km s−1. The transit time of this CME from the
Sun to the Earth was approximately ∼37 h. The source of the CME has been identified as an X1.7 flare recorded by GOES. This flare was observed between 09:57 and 10:32 UT, with a peak emission at 10:15 UT in EIT im-ages. The intensity of the flare in Hα was 1N and
there-fore did not appear exceptional. However, the source active region NOAA AR9393 of this flare/CME was one of the largest groups of sunspots observed in the present cycle. It became a sizable group of more than 50 sunspots at the time of its maximum development, occupying a total area of 2440 millionths of the solar disk, and a latitudinal extent of 19 heliographic degrees. The region was very complex, with a beta-gamma- delta (BGD) configuration. Further details of this event can be found in Srivastava and Venkatakrishnan (2002). 3. 29 October 2003 (Dst∼−363 nT): On 28 October 2003,
a full halo CME originated in NOAA AR 10486 which was associated with an X17.2 flare, as recorded by the GOES X-ray satellite. Concurrent with the X17.2 flare, a 4B flare was recorded in Hα around 10:58 UT, using
a 15-cm aperture solar spar telescope at Udaipur So-lar Observatory (Fig. 1). The fSo-lare peaked at 11:10 UT. Prior to the major flare, other smaller flares were ob-served as thin ribbons of emission. First, an M1.3 event in the central part of region at 09:56 UT, then an M2.3
flare at 10:09 UT in the eastern part of the same active region were recorded. The CME was first observed in the LASCO-C2 images at 10:54 UT as a bright loop front over the west limb; by 11:30 UT, the front had de-veloped into a full halo CME, very bright all around the occulting disk. In LASCO-C3, a full halo CME was recorded at 11:42 UT. The height-time profile of the CME indicates that it had a mean plane-of-sky speed of 2125 km s−1. The geomagnetic storm associated with this CME occurred at the Earth on 29 October in a record time of 19 h, making it the second fastest CME amongst the CMEs, which gave rise to a strong geo-magnetic storm (the fastest was the famous 1 September 1859 CME, which arrived in approximately 17 h (Tsu-rutani et al., 2003)). The source region of this CME was the active region NOAA AR10486 which appeared at the eastern limb on 23 October. This group quickly grew to become the largest AR of the current solar cy-cle (measuring more than 0.25% of the solar disk) and produced several large flares during its disk passage. 4. 30 October 2003 (Dst∼−400 nT): LASCO and EIT
ob-served a full halo CME on 29 October 2003. The event was first observed in C2 at 20:54 UT as a bright loop front over the south pole. At 21:08 UT the leading front developed into a full halo CME, very bright all around the occulting disk. In LASCO-C3 images, the front first appeared as a full halo CME at 21:19 UT. The mean plane-of-sky speed for this event was 1948 km s−1 at position angle 90◦, with evidence of strong decelera-tion. A severe geomagnetic storm associated with this CME was observed on 30 October 2003 which reached its maximum intensity at around 23:00 h. The CME was associated with an X11 flare recorded in EIT im-ages between 20:33 and 21:36 UT, in the NOAA AR 10501 centered at S18W06, with peak emission in the GOES X-ray flux at 20:48 UT. A very large EIT wave and dimming were also observed to be associated with this event.
5. 20 November 2003 (Dst∼−472 nT): The unusual
super-storm: A faint full halo CME was observed on 18 November 2003 after an M3.2 long duration flare in the region NOAA AR 10501 at 07:52 UT. A faster and brighter halo CME was observed in LASCO im-ages following an M3.9 long duration flare in the same region at 08:31 UT. Concurrent with the first flare, a wide faint loop front was recorded in LASCO-C2 im-ages at 08:06 UT. At 08:50 UT a second and much brighter front appeared spanning 160◦ from the SE to NW, having fainter extensions to the north pole. The bright front first appeared in C3 images in the south at 08:42 UT and developed to a full halo CME by 09:18 UT. The mean plane-of-sky speed of this CME was measured approximately to be 1175 km s−1 at PA 177◦, with possible evidence of slight acceleration. The CME was probably associated with complex activity in and around AR 10 501 between 07:36–09:00 UT. EIT
Fig. 2. Flare in Hα observed at Udaipur Solar Observatory on 18
November 2003 in NOAA AR 10501. The flare associated CME re-sulted in the strongest geomagnetic storm of the current solar cycle with Dstindex reaching −472 nT.
observed two flares between 07:36–08:00 UT and be-tween 08:12–09:00 UT. The first flare, was centered at N03E18 (Fig. 2) and the second towards the south and west. Additionally, a filament channel to the south and west of the active region was activated following the first flare which subsequently erupted. Both EIT wave and dimming were observed in association with this event. On 20 November, when the CME arrived at the Earth, the most intense geomagnetic storm of the current solar cycle (Dst∼−472 nT) occurred.
All of the CMEs described above were initiated with very high initial speeds, as measured in the LASCO coronagraph field of view. They produced strong interplanetary shocks and finally resulted in huge geomagnetic storms. The arrival times at the Earth varied for each event. For example, while the 29 March 2001 CME arrived at the Earth in 37 h, the 28 October 2003 event arrived in approximately 19 h. The latter started with a high initial plane-of-sky speed of 2125 km s−1 and underwent little deceleration. The other started off with 1600 km s−1but underwent considerable deceleration. This shows that the prediction of the arrival time at the Earth is fraught with uncertainty and errors because of the lack of complete information on the mode of CMEs propagation in the interplanetary medium. The uncertainty is further com-pounded by incomplete information on the deceleration of CMEs. Although each CME studied in this paper had sim-ilarly a large ram pressure and a large southward compo-nent of the interplanetary magnetic field, the strengths of the resulting storm were different. In particular, the CME of 28–29 October 2003 arrived at the Earth with a speed of 1950 km s−1but could not trigger a storm of the magnitude comparable to the one produced by the 29 March 2001 CME that arrived with a much lower speed of 580 km s−1. The moot questions are: a) what determines the magnitude of a geomagnetic storm given the right ingredients, b) what are these right ingredients? In an attempt to answer these ques-tions, we compare the solar and interplanetary properties of
2992 N. Srivastava: Predicting the occurrence of super-storms
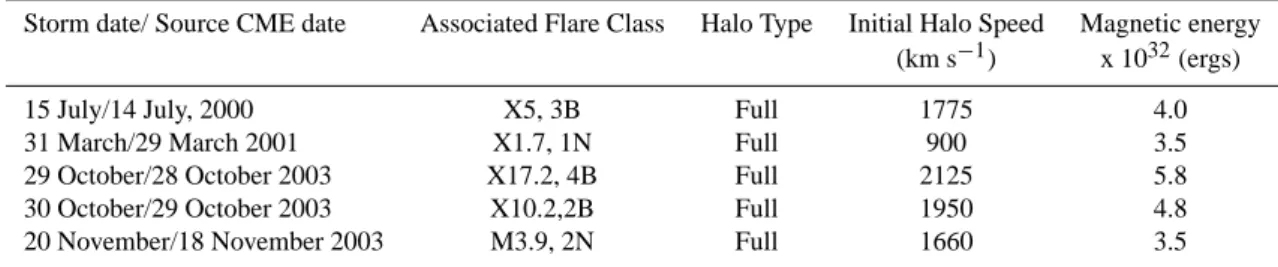
Table 1. The source CMEs of super-storms and associated flare characteristics
Storm date/ Source CME date Associated Flare Class Halo Type Initial Halo Speed Magnetic energy (km s−1) x 1032(ergs)
15 July/14 July, 2000 X5, 3B Full 1775 4.0
31 March/29 March 2001 X1.7, 1N Full 900 3.5
29 October/28 October 2003 X17.2, 4B Full 2125 5.8
30 October/29 October 2003 X10.2,2B Full 1950 4.8
20 November/18 November 2003 M3.9, 2N Full 1660 3.5
Table 2. Comparison of source active regions associated with CMEs.
CME Date Location Area No. of sunspots Area per sunspot Magnetic class Magnetic field (G) (×10−6AJ) (×10−6AJ)
14 July 2000 N17E00 1560 243 6 AP 2600–3000
29 March 2001 N14W16 2440 51 49 Delta 2600–3000
28 October 2003 S16E18 2500 55 45 FKC 2600–3000
29 October 2003 S14W06 2500 74 34 FKC 2600–3000
18 November 2003 S02E18 370 25 15 FKI 2600–3000
the five super-storms described above, in order to identify the possible factors that influence the magnitude of a geo-magnetic storm.
3 Solar sources of super-storms
With the exception of the 18 November 2003 event, which originated in a small active region and was associated with M-class flare, all other events had their origins in large ac-tive regions and were associated with strong X-class flares. The former was the source of the strongest super-storm (Dst∼−472 nT). The magnetic field of all of the active
re-gions range between 3000–3500 G. The tabulated values of magnetic field strength have been obtained from the Mt. Wil-son sunspot data monthly reports. Thus, the magnetic field strengths and the sizes of source active regions were large, which implies that a large amount of magnetic energy was available for the occurrence of flares. This follows from the theoretical calculations by Low (1985). The magnetic class of these active regions indicated that the active regions were complex, being potential regions for producing major flares. As can be noticed from Table 2, the location and size of active regions appear to play important roles in producing strong geo-effective events. The active region AR9393 of March 2001, is one of the largest groups of sunspots ever ob-served and is the largest of the present cycle to date (Srivas-tava and Venkatakrishnan, 2002). Equally large is the NOAA AR 10501 of October 2003. It is of a size comparable to that of the March 2001, followed by the AR of October 2003, thereby implying that a large amount of magnetic energy is available per sunspot for release. Table 1 summarizes the characteristics of the solar sources of the CMEs associated
with the super-storms. The source CMEs were observed as full halos in the LASCO field of view. These halo CMEs were fast; the measured initial speeds from LASCO images for all the events were found to be greater than 1600 km s−1. These source regions were located close to the center of the Sun, which provided a good link with the Earth. Venkatakr-ishnan and Ravindra (2003) show that the velocity (V) of a CME is directly related to the magnetic energy (E) of the associated active region:
log10V = −12.4 + 0.48 log10E. (1) This relation is based on the assumption that the entire en-ergy available in an active region goes into driving the CME. Using Eq. (1) we found that the magnetic energies associ-ated with the events studied in this paper are of the order of 1032ergs (last column in Table 1).
4 Interplanetary and geomagnetic activity
Burton et al. (1975) have shown that the geo-effectiveness of solar wind depends upon its speed and the embedded south-ward magnetic field. Furthermore, Gonzalez et al. (1994) found that strong geomagnetic storms (Dst<−100 nT) could
be attributed to interplanetary structures with intense long duration and southward magnetic fields (Bz) which
intercon-nect with the Earth’s magnetic field and allow solar wind en-ergy transport into the Earth’s magnetosphere. To understand the solar wind-magnetosphere coupling mechanism, it is therefore important to calculate the VBzparameter. Amongst
several characteristic features, for example, southward Bz,
duration, wind speed and density, Chen et al. (1996) chose the duration and the magnitude of Bzas important quantities
Table 3. Interplanetary consequences of the geo-effective CMEs.
Storm Date (Dst index) Shock Speed Ram Pressure Bz, BT VBz Duration of TBz VBzTBz (km s−1) (×10−7dynes cm−2) (nT) (mV/m) (hr) (mV/m) hr 15 July 2000 (−300 nT) 850 2.7 −58, 59 23.25 4.8 111.60 31 March 2001 (−385 nT) 580 6.0 −48, 48 26.44 6.0 158.64 29 October 2003 (−363 nT) 2000 1.2 −30, 46 58.50 3.6 210.60 30 October 2003 (−400 nT) 1000 2.7 −35, 40 63.00 4.8 302.40 20 November 2003 (−472 nT) 730 1.7 −55, 60 35.75 13 464.75
for predicting geo-effectiveness. In Table 3 the IP character-istics of the super-storms studied in this paper are listed. We found that each super-storm is preceded by an interplanetary shock, which indicates increased ram pressure and, therefore, sudden compression of the Earth’s magnetosphere (Gonza-lez et al., 1999). This leads to a positive jump in the Dst
value, indicating the arrival of the shock and thereby caus-ing a storm sudden commencement or SSC. Therefore, ram pressure, which is proportional to nV2(where n is the proton density, and V the solar wind speed) at 1 AU, is an impor-tant quantity for estimating the strength of the impact of an IP shock on the magnetosphere. However, we find that the shock speed has no bearing on the magnitude of the result-ing geomagnetic storm. This is consistent with the earlier findings of Srivastava and Venkatakrishnan (2004). We cal-culated the ram pressure at L1 for each of the geo-effective events and found that the ram pressure value is high (of the order of 10−7 dynes cm−2) for all the events. Since high
ram pressure is a good indicator of severe geomagnetic ac-tivity, it can be used as a predictor of the occurrence of strong storms (Table 3). In the present study, the strengths of the geomagnetic storms vary for the individual geo-effective CMEs. This is suggested by Dst index values which vary
from −300 nT to −472 nT (Table 4). The average duration of the storms is approximately 7 h. Each of the storms was accompanied by a sudden storm commencement, with the exception of the 30 October 2003 event, as reported in the Solar Geophysical data. From this study, we found that the magnitude of the resulting geomagnetic storm not only de-pends upon the interplanetary-magnetospheric coupling pa-rameter VBz but also on the duration of Bz given by TBz. The higher the value of VBzTBz, the higher the strength is of the geomagnetic storm (Fig. 3). A strong correlation coeffi-cient of 0.9 suggests that the two quantities are highly corre-lated. This confirms the earlier result of Chen et al. (1997), who concluded that the strength of a geomagnetic storm not only depends upon the magnitude of VBzin the
interplane-tary medium but also on the duration of the southward com-ponent of the interplanetary magnetic field.
5 The prediction of arrival time
The forecasting of super-storms involves an accurate pre-diction of the arrival time of the CME at the Earth and the
Table 4. Geomagnetic activity associated with events studied. Storm Date SSC Storm duration Minimum Dst
(hours) (nT) 15 July 2000 Y 9 −300 31 March 2001 Y 5 −385 29 October 2003 Y 7 −363 30 October 2003 N 5 −400 20 November 2003 Y 7 −472
Fig. 3. Dependence of the strength of the geomagnetic storm in-tensity on the solar wind-magnetospheric coupling parameter and the duration in hours for which the interplanetary magnetic field remains southward.
strength of the resulting storm. The arrival time of a CME has been defined in this study as the difference in the start time of the CME, as observed in EIT images, and start time of the geomagnetic activity at the Earth. The method of ob-taining the start times of the CMEs and the geomagnetic storms (including the errors) have been discussed in Sri-vastava and Venkatakrishnan (2004), who studied 64 CMEs that led to major geomagnetic storms (Dst<−100 nT) during
1996–2002 and obtained the following relation between the transit time and the initial speed using regression analysis
2994 N. Srivastava: Predicting the occurrence of super-storms The above regression formula was applied to predict the
ar-rival times of the super-storms in the present study, which are tabulated in Table 4. It was found that the actual arrival time of the geo-effective CMEs studied in this paper are gen-erally smaller than the predicted arrival times and there is approximately a 20% error in predicting the arrival times of the CMEs. This may be due to several reasons:
1. Statistical analysis of fast CMEs may not be robust be-cause they occur less frequently. Therefore, the empir-ical relation derived by Srivastava and Venkatakrishnan (2004) may not always hold good, in particular, for ex-treme events;
2. The amount of deceleration given by the empirical for-mula may be larger than the deceleration a CME actu-ally undergoes as it travels outward in the interplanetary medium;
3. The interaction of a geo-effective CME with the ambi-ent solar wind or with another CME as it propagates towards the Earth may affect the time of arrival. Such may be the case for the 29 October 2003 event which was preceded by another strong geo-effective event on 28 October 2003.
6 Conclusions
Four of the five geomagnetic super-storms studied in this pa-per were associated with flares originating from large mag-netic active regions located close to the central meridian and at low latitudes. Although the speed of the 18 November 2003 CME was quite small, the resulting storm of 20 Novem-ber 2003 possibly owes its large magnitude to the long dura-tion for which the Bzcomponent remained southward.
Our analysis leads to the following conclusions:
1. If the source active region of a CME is large in area, it posseses a large amount of magnetic energy. The larger the magnetic energy available, the higher the speed is of the ensuing CME which causes higher ram pressure of the solar wind on the magnetosphere and consequently, higher compression of the southward component of the IMF (Bz). However, it does not imply that if the area is
smaller, then the ensuing CME cannot be strongly geo-effective. As the 18 November 2003 event shows, such CMEs arrive without prior warning and therefore the magnitude of the resulting geomagnetic storms are dif-ficult to predict;
2. The strength of a geomagnetic storm not only depends on the interplanetary-magnetospheric coupling parame-ter VBzbut also on the duration of Bz. The higher the
value of VBzTBz, the higher the strength will be of the geomagnetic storm;
3. The prediction of the arrival time of the CMEs, in par-ticular for the extreme events, is difficult because the
derived empirical relation may not always hold good, especially for rare events, like the events studied in this paper. Also, the empirical relation does not take into ac-count the interaction of the CME with another or with the solar wind, due to which errors involved in the esti-mation of the arrival time are large.
Acknowledgements. We acknowledge the LASCO/EIT and
CELIAS operational teams on SoHO and ACE for the data used in this paper. The author also acknowledges the support of European COST724 action for providing partial financial support to present this work at the first European Space Weather week held during November 2004 at ESTEC, The Netherlands.
Topical Editor T. Pulkkinen thanks R. Schwenn and N. Vilmer for their help in evaluating this paper.
References
Biesecker, D. A., Myers, D. C., Thompson, B. J., Hammer, D. M., and Vourlidas, A.: Solar Phenomena Associated with “EIT Waves”, Astrophys. J., 569, 1009–1015, 2002.
Burton, R. K., McPherron, R. L., and Russell, C. T.: An empiri-cal relationship between interplanetary conditions and Dst , J.
Geophys. Res., 80, 14 204–14 214, 1975.
Brueckner, G. E., Howard, R. A., Koomen, M. J., et al.: The Large Angle Spectroscopic Coronagraph, (LASCO), Solar Phys., 162, 357–402, 1995.
Cane, H. V., Richardson, I. G., and St. Cyr. O. C.: Coronal mass ejections, interplanetary ejecta and geomagnetic storms, Geo-phys. Res. Lett., 27, 3591–3594, 2000.
Chen, J., Cargill, P. J., and Palmadesso, P. J.: Real-time identifi-cation and prediction of geoeffective solar wind structures, Geo-phys. Res. Lett., 23, 6., 625–628, 1996.
Chen, J., Cargill, P. J., and Palmadesso, P. J.: Predicting solar wind structures and their geoeffectiveness, J. Geophys. Res., 102(A7), 14 701–14 720, 1997.
Delaboudiniere, J.-P., Artzner, G. E., Brunaud, J., et al.: Extreme Ultraviolet Imaging telescope for the SoHO mission, Solar Phys., 162, 291–312, 1995.
Feldstein, Y. I.: Modelling of the magnetic field, Space Sci. Rev., 59, 83–, 1992.
Fenrich, F. R. and Luhmann, J. G.: Geomagnetic response to mag-netic clouds of different polarity, Geophys. Res. Lett. 25, 2999– 3002, 1998.
Feynman, J. and Gabriel, S. B.: 2000, On space weather conse-quences and predictions, J. Geophys. Res., 105, 10 543–10 564 , 2000.
Gonzalez, W. D., Joselyn, J. A., Kamide, Y. M., Kroehl, H. W., Rostoker, G., Tsurutani, B. T., and Vasyliunas, V. M.: What is a geomagnetic storm?, J. Geophys. Res. 99, 5571–5792, 1994. Gonzalez, W. D., Tsurutani, B. T., and Gonzalez, A. L. C.:
In-terplanetary origin of geomagnetic storms, Space Sci. Rev., 88, 529–562, 1999.
Gopalswamy, N., Lara, A., Lepping, R. P., Kaiser, M. L., Berdichevsky, D., and St. Cyr, O. C.: Interplanetary accelera-tion of coronal mass ejecaccelera-tions, Geophys. Res. Lett., 27, 145–148, 2000.
Gopalswamy, N., Lara, A., Yashiro, S., Kaiser, M. L., Howard, R. A.: Predicting the 1-AU arrival times of coronal mass ejections, J. Geophys. Res., 106, 29 207–29 218, 2001a.
Gopalswamy, N., Lara, A., Kaiser, M. L., and Bougeret, J.-L.: Near sun and near earth manifestation of solar eruptions, J. Geophys. Res., 106, 25 261–25 278, 2001b.
Klein, L. W and Burlaga, L. F.: Interplanetary magnetic clouds at 1 AU, J. Geophys. Res., 87, 613–624, 1982.
Low, B. C.: Modeling solar magnetic structures, in NASA conf. Pub. 2374, “Measurements of solar vector magnetic fields”, (Ed.) Hagyard, M. J., 49–65, 1985.
O’Brien, T. P. and McPherron, R. L.: An empirical phase space analysis of ring current dynamics: Solar wind control of injection and decay, J. Geophys. Res., 105, 7707–7720, 2000.
Plunkett, S. P., Thompson, B. J., St. Cyr. O. C., and Howard, R. A.: Source regions of coronal mass ejections and their geomagnetic effects, J. Atmos. Sol. Terr. Phys., 63, 389–402, 2001.
Richardson, I. G., Cliver, E. W., and Cane, H. V.: Sources of ge-omagnetic storms over the solar cycle: Relative importance of coronal mass ejections high-speed streams, and slow solar wind, J. Geophys. Res., 105, 18 203–18 214, 2000.
Richardson, I. G., Cliver, E. W., and Cane, H. V.: Sources of ge-omagnetic storms for solar minimum and maximum conditions during 1972–2000, Geophys. Res. Lett., 28, 2569–2572, 2001. Schwenn, R., Dal Lago, A., Huttunen, E., and Gonzalez, W. D.:
The association of coronal mass ejections with their effects near the earth, Ann. Geophys., 23, 1033–1059, 2005,
SRef-ID: 1432-0576/ag/2005-23-1033.
Sheeley, N. R., Jr., Harvey, J. W., and Feldman, W. C.: Coro-nal holes, solar wind streams, and recurrent geomagnetic distur-bances, 1973–1976, Solar Physics, 49, 271–278, 1976.
Srivastava, N. and Venkatakrishnan, P.: Relation between CME speed and geomagnetic storm intensity, Geophy. Res. Lett., 29, 1287, doi:10.1029/2001GL013597, 2002.
Srivastava, N. and Venkatakrishnan, P.: Solar and interplanetary sources of major geomagnetic storms during 1996–2002, J. Geo-phys. Res., 109(A010103), doi:10.1029/2003JA010175, 2004. Tsurutani, B. T., Gonzalez, W. D., Lakhina, G. S., and Alex, S.:
The extreme magnetic storm of 1–2 September 1859, J. Geophys. Res., 108(A010103), doi:10.1029/2002JA009504, 2003. Venkatakrishnan, P. and Ravindra, B: Relationship between CME
speeds and magnetic energy of active regions, Geophys. Res. Lett., 30, 2181, doi:10.1029/2003GL018100.
Vilmer, N., Pick, M., Schwenn, R., Ballatore, P., and Villain, J. P.: On the solar origin of interplanetary disturbances observed in the vicinity of the earth, Ann. Geophys., 21, 847–862, 2003, SRef-ID: 1432-0576/ag/2003-21-847.
Wang, Y. M., Ye, P. Z., Wang, S., Zhou, G. P., and Wang, J. X.: A statistical study on the geo-effectiveness of earth-directed coro-nal mass ejections from March 1997 to December 2000, J. Geo-phys. Res., 107, 1340, doi:10.1029/2002JA009244, 2002. Zhang, J., Dere, K. P., Howard, R. A., and Bothmer, V.:
Identifica-tion of solar sources of major geomagnetic storms between 1996 and 2000, Astrophys. J., 582, 520–533, 2003.