Design and Modeling of a Third Generation
Slumping Tool for X-ray Telescope Mirrors
by MASSACHUSETTS INS E
bu
ZOF TECHNOLOGYAbdul Mohsen Z. Al Husseini
JUL 2 9 2011
B.E., McGill University (2009)
L
,LIBPARIES
Submitted to the Department of Mechanical Engineering
in partial fulfillment of the requirements for the degree of
Master of Science in Mechanical Engineering
at the
MASSACHUSETTS INSTITUTE OF TECHNOLOGY
June 2011
©
Massachusetts Institute of Technology 2011. All rights reserved.
A u th or ... ... . .. .. ...
Department of Mechanical Engineering
May 6, 2011
/-Certified by... ... .
..
.)...
V
Mark L. Schattenburg
Senior Research Scientist
Thesis Supervisor
A ccepted by ...
...
David E. Hardt
Chairman, Department Committee on Graduate Students
Design and Modeling of a Third Generation Slumping Tool for X-ray Telescope Mirrors
by
Abdul Mohsen Z. Al Husseini
Submitted to the Department of Mechanical Engineering on May 6, 2011, in partial fulfillment of the
requirements for the degree of
Master of Science in Mechanical Engineering
Abstract
Glass sheets with high surface quality and angular resolution of 5 arcsec are in de-mand for the International X-Ray Observatory. Several glass flattening techniques are presented in this thesis, including a method of thermally shaping individual sheets of glass using porous mandrels as air bearings developed at the Space Nanotechnology
Lab. This method, a second generation slumping tool, eliminates the problems of
sticking and dust particle-induced distortion that plague traditional slumping meth-ods.
A detailed mathematical model of the slumping process is developed, allowing prediction of final glass shape based on process parameters that include air supply pressure, imperfections on the mandrel surface, glass total thickness variations and gravity vector orientation. Simulations were conducted for a variety of scenarios to study the impact of apparatus tilt and pressure asymmetries on glass shape.
Experiments to verify model findings are conducted under closed-loop control of pressure and apparatus tilt. Little improvement in repeatability is seen, suggesting that the error is due to unmodeled forces such as contact forces from the glass holding technique.
Finally, the design process and fabrication of a third generation slumping tool is presented. In addition to scaling the design to accommodate larger flats, slumps are done horizontally to float the glass and minimize contact during the process. New capabilities of the tool also include active gap measurement and control, as well as plenum air temperature monitoring.
Thesis Supervisor: Mark L. Schattenburg Title: Senior Research Scientist
Acknowledgments
Special thanks are due to my beautiful family; my mother Sahar, father Zuheir, and two sisters Dalia and Mariam. I would not be here had it not been for your unwavering support and unconditional belief in me during each step. Mariam and Wajeeh, your overwhelming kindness and occasional pampering definitely helped. My dear nephew Shaker, thank you for constantly putting a smile on my face. You'll read this when you grow up, and I expect to be in your acknowledgements.
Farah, my beloved fiance, no words can dream of expressing my gratitude. Despite being continents apart, you were there for me day in and day out through the ups and downs of MIT. To you I am eternally indebted.
I cannot forget my advisor, Dr. Mark Schattenburg, for offering me the
oppor-tunity to work in the Space Nanotechnology Lab and for his continued guidance and support. Mark, the depth and diversity of your knowledge is truly inspiring and has been immensely helpful. Thank you for believing in me.
I have learned much and gained invaluable insight from my many discussions with Alex Slocum, Ralf Hielmann, Mireille Akilian, Robert Panas and Jay Fucetola. Mireille, thank you for your invaluable input and for coming to the lab on a couple of occasions to help me out. Jay, you put up with my endless questions and selflessly offered your time. Thank you, your help has been instrumental to my success.
Everyone from the MIT Kavli Institute staff has been beyond helpful, particu-larly Raymond Scuzzarella and Teresa Santiago. Ray, thank you for making order placement an efficient and enjoyable process.
This list is by no means comprehensive. Thank you to all the friends I have made over the past two years, you have made my stay Boston a most pleasant experience. Funding from the National Aeronautics and Space Administration made this thesis possible.
Contents
1 Introduction
1.1 X-Ray Telescopes Optics . . . . 1.1.1 Monolithic Mirrors . . . . 1.1.2 Sheet Optics . . . .
1.1.3 International X-ray Observatory Requirements
1.2 Current Techniques to Improve Flatness . . . . 1.2.1 Conventional Thin Optic Slumping . . . . 1.2.2 Silicon Pore Optics . . . .
1.3 MIT Slumping Tools . . . .
1.3.1 Pin Chucks . . . .
1.3.2 Porous Air Bearings . . . .
2 Mathematical Model
2.1 Pressure Distribution for Non-uniform Gaps . . . . . 2.1.1 Governing Equations . . . . 2.1.2 Boundary Conditions . . . ....
2.1.3 Numerical Analysis . . . . 2.2 Glass Shape Simulation . . . .
2.3 R esults . . . .
2.3.1 Pressure Differences . . . .
2.3.2 Tilt A ngle . . . . 2.3.3 Varying Pressures Under Constant Tilt . . . . 2.3.4 Varying Gap Under Constant Tilt . . . .
21 . . . . 24 . . . . 25 . . . . 27 . . . . 27 . . . . 28 . . . . 28 . . . . 30 . . . . 32 . . . . 32 . . . . 33 39 . . . . 40 . . . . 42 . . . . 43 . . . . 46 . . . . 48 . . . . 51 . . . . 51 . . . . 52 . . . . 53 . . . . 53
2.4 C onclusion . . . .
3 Model Verification Experiments
3.1 O ld H ardw are . . . . 3.1.1 A ngle Control . . . . 3.1.2 Pressure Control . . . . 3.2 LabVIEW Platform . . . . 3.2.1 U ser Interface . . . . 3.2.2 C ontroller . . . .
3.3 Experiments and Results . . . .
3.3.1 Shack-Hartmann Metrology System . . . .
3.3.2 Experimental Results . . . . 3.4 C onclusion . . . .
4 Design of New Slumping Tool
4.1 Design Strategy . . . . 4.2 Design Concepts . . . . 4.2.1 Degrees of Freedom . . 4.2.2 Design Modules . . . . 4.3 Sensor System . . . . 4.3.1 Position Sensors . . . . 4.3.2 Pressure Sensors . . . 4.3.3 Temperature Sensors . 4.4 Air Bearing Assembly . . . . 4.4.1 Mandrel-Housing Joint 4.4.2 Material Selection . . . 4.4.3 Mandrel Grinding . . . 4.4.4 Housing Machining . . 4.4.5 Material Properties at 4.5 Model Verification . . . . 4.5.1 Load Capacity . . . . . High Temperatures 69 69 72 . . . . . . . .
4.5.2 Deflection from Pressure
4.5.3 Deflection from Kinematic Coupling . . . . 4.6 Furnace ...
4.7 Actuation Concept . . . . 4.7.1 Flexure Configuration 4.7.2 Actuator Configuration 4.8 Actuation Detail Design . . . . .
4.8.1 Coarse Positioning System 4.8.2 Fine Positioning System . 4.8.3 Cooling . . . . 4.9 Data Acquisition . . . . 4.10 Conclusions and Future Work . .
A Glass Temperatures
B MATLAB Simulation Code
B.1 Generalized Pressure Distribution . . . . B .2 Shape Solver . . . . 100 100 . . . 100 . . . 102 . . . 102 . . . 104 . . . 107 . . . 107 . . . 109 . . . 121 . . . 124 . . . 127 129 131 131 135
List of Figures
1-1 Flat glass sheets produced through the (a) Crown Process (b) Cylinder P rocess . . . . 22 1-2 Schematic of the Slot-draw process, used to produce Schott D-263 glass
sheets used in this research . . . . 23 1-3 (a)Glass sheet with flat surfaces and a uniform thickness. (b) Glass
sheet with uniform thickness but with non-flat surfaces. (c) Glass sheet
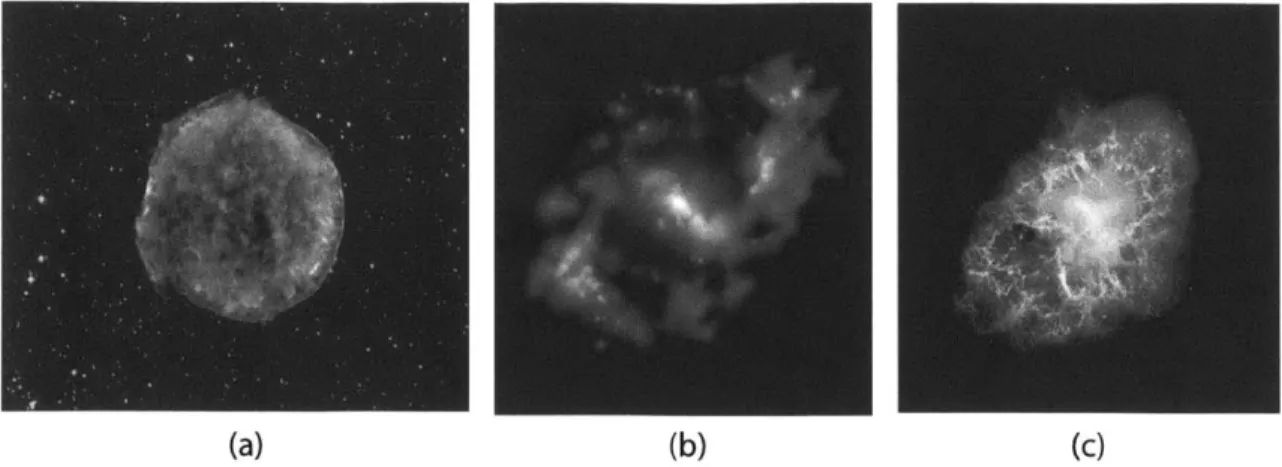
with one flat surface (right surface) but not uniform in thickness. . . 24 1-4 (a) Tycho's supernova remnant, produced by the explosion of a white
dwarf star in our Galaxy, 10,000 light years away. (b) NGC 4151 is a spiral galaxy with an actively growing supermassive black hole at its center. (c) A star's spectacular death in the constellation Taurus was observed on Earth as the supernova of 1054 AD. . . . . 25 1-5 Photo-electric absorption: Incident photons are absorbed and electrons
ejected at high velocities. . . . . 26 1-6 A Wolter-1 mirror configuration containing 4 nested shells, with
in-coming x-rays reflected at glancing angles . . . . 26 1-7 Nested mirrors in the Wolter configuration in the Chandra telescope . 26 1-8 Thousands of nested mirrors in the Wolter configuration in the XMM
Newton telescope . . . . 27 1-9 Tolerated surface flatness error within IXO requirements . . . . 28 1-10 Schematic showing how a glass sheet conforms to mandrel shape as
1-11 (a)-(d) Depiction of sticking problem encountered during conventional
thermal shaping of thin glass optics, and the problems with proposed solutions. . . . . 30
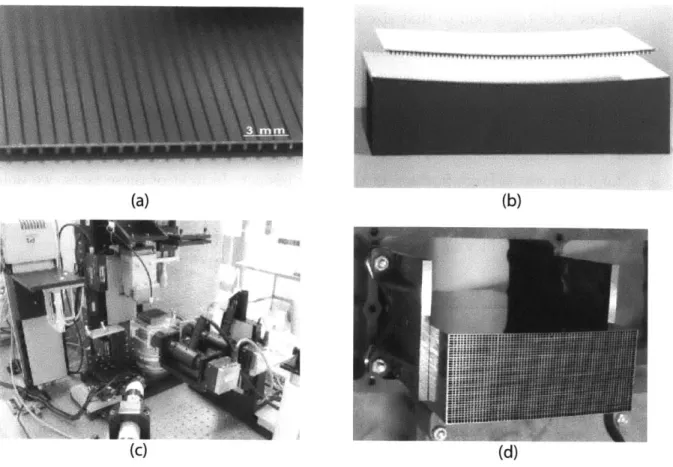
1-12 Photographs of the ESA pore optics fabrication process. (a) Silicon wafer after backside ribsawing and front side metallization. (b) Optic assembly robot. (c) First mirror being bonding to formingmandrel.
(d) Final optic module mounted for x-ray testing. . . . . 31 1-13 An array of pins fabricated on a flat fused silica mandrel to allow for
dust particles to settle between pins. (a) shows a thin substrate at room temperature and (b) shows the substrate after slumping. ... 32
1-14 Schematic of the slumping process, not drawn to scale. (a) Glass sheet is vertically suspended by hooks between the mandrels, never making contact with their surfaces. Gap is much smaller than glass thickness.
(b) Viscous restoring forces drive the glass to be symmetry about its
m idplane. . . . . 33
1-15 Glass sheets are hung by two hooks through holes made by laser
abla-tion. Tantalum spacers are used in conjunction with chamfered glass edges to obtain the desired air gap. . . . . 34
1-16 The temperature cycle followed for slumping the glass between two
porous m andrels . . . . 34
1-17 (a) Surface of Glass HI with 2.26 tm P-V of warp after slumping. (b)
Difference map between Glass HI and H2, P-V of 1.61 pm. . . . . 35
1-18 Histograms of surface of Glass H1 after slumping . . . . 35 1-19 Histograms of the difference between Glass HI and Glass H2 after
slumping each individually . . . . 36
1-20 (a) Vertical slumping apparatus placed inside the furnace. (b) Schematic illustrating how pressured air is supplied and its pressure measured is measured via data acquisition hardware. . . . . 36
2-1 The pressure profile at 600'C in the air gap of a 100 mm x 100 mm x12.7 mm porous bearing at film thickness of (a)5 pm (b)10 pm (c)15 pam 39
2-2 (a) Porous air bearing with a uniform gap. (b) Porous air bearing with a nonuniform gap . . . . 40
2-3 Air bearing with a non-uniform gap: (a) Top view. (b) Side view . . 41 2-4 Air bearing with a non-uniform gap . . . . 43
2-5 Flowchart illustrating the iteration cycle . . . . 49
2-6 Illustration of the various model inputs, glass shape s(x, y), glass
thick-ness profile t(x, y), supply pressures pi and P2. 0 measured positive
counterclockwise. . . . . 49
2-7 Mapping FDM nodes to glass elements and back . . . . 50 2-8 Calculation of cell displacement in each cycle . . . . 50 2-9 Centerline displacement of a glass sheet due to pressure differential.
G ap = 50 pm . . . . 51
2-10 P-V bow resulting from apparatus tilt. Simulated over an area of 80x 80 m m . . . . 52
2-11 Zernike reconstruction of surface topography for 3' tilt (Z-axis in mi-crons) ... ... 53
2-12 Bow resulting from varying pressure with a constant angle. . . . . 54
2-13 Effect of varying gap size on P-V bow. Constant tilt angle of 6',
p1 = p2 = 0.3 psi . . . . 54
3-1 Schematic outlining the mechanical clamping method for the air bear-ing assem bly . . . . 58 3-2 Assembled air bearing inside the furnace, resting on two stainless steel
b locks. . . . . 58 3-3 List of all components in the air bearing assembly. . . . . 59
3-4 Graphic summary of the assembly steps. . . . . 59 3-5 (a) 1.5 ton capacity scissor-jack. (b) 0.05 resolution angle measure
3-6 (a) MKS Baratron 74021TFE3GA capacitance manometer (b) MKS
1179A01353C51BB Mass Flow Controller . . . . 61
3-7 Screen shot of the LabVIEW Graphical User Interface . . . . 62
3-8 Screen shot of the LabVIEW Block Diagram . . . . 62
3-9 Control loop for controlling process pressure . . . . 63
3-10 Shack-Hartmann Metrology System . . . . 64
3-11 (a) Cross section indicating affect of wave aberration on CCD image. (b) Microlenslets focus spots on the detector. The array of boxes repre-sents the areas-of-interest (AOI). Spots shifted from the center of their AOI's indicate an aberration in the wavefront. . . . . 65
3-12 Single measurement results (a) Measured surface topography after slump-ing (80 mm aperture), P-V 0.83 pm. (b) Deformation histogram, RMS = 0.199 pm. (c) Angle y histogram, RMS = 1.57 arcsec. (c) Angle x histogram, RMS = 3.96 arcsec. . . . . 66
3-13 Repeatability measurement results (a) Measured surface topography after slumping (80 mm aperture), P-V 2.41 pm. (b) Deformation his-togram, RMS = 0.63 pm. (c) Angle y hishis-togram, RMS = 11.346 arcsec. (c) Angle x histogram, RMS = 6.23 arcsec. . . . . 67
4-1 Glass sheet upward bow experienced when slumping on a single hori-zontal air bearing . . . . 70
4-2 Top view of how the glass could be constrained in-plane during hor-izontal slumping. Four pins on all sides can keep it floating in the center. . . . . 7 1 4-3 Two different strategies for positioning the air bearings. (a) Moving top plate, stationary bottom plate. (b) Stationary top plate, moving bottom plate . . . . 72
4-4 Optical intensity sensor fundamentals: (a) Light supplied by trans-mitting fibers is then collected by light receiving fibers in a position dependant manner. (b) Typical supply-receiving fiber distributions. (c) Output voltage vs. Target displacement curve highlighting the two linear regions. . . . . 74 4-5 Eddy-current sensor operation: Eddy-currents generate distance
de-pendant opposing magnetic fields used to measure displacement. . . . 75 4-6 (a) Capacitance dependant current flows through the circuit, from
which displacement can be inferred. (b) Capacitive sensor construc-tion: a sensing area, body, and guard to focus the electric field in the gap. ... ... 76
4-7 (a) Button sensors, embedded into place. (b) Cylindrical probes, fas-tened with a set-screw. (c) Threaded sensors, screwed into place. . . . 76 4-8 Nextel ceramic-insulated type K thermocouple . . . . 78
4-9 Illustration of the capillary effect essential to the brazing process. (a) The two parts to be bonded are loosely fitted with a filler alloy sheet (b) As the temperature rises above the filler's melting point, the capillary effect causes the filler to wick up and be distributed in the gap. As the temperature is reduced, a permanent metallurgical bond is formed. . 80
4-10 (a) Flame brazing, local heat is applied through a flame. (b) Fur-nace brazing, global heat is applied by raising the temperature of the environm ent . . . . 80
4-11 (a) Rather than melting, it was observed that the braze alloy was oxidized. (b) Stains from volatile organics that only became visible after the therm al cycle . . . . 82
4-12 Better braze results were obtained after cleaning the ceramic surface and clean-firing the ceramic. Destructive test results show that the ceramic failed before the bond. . . . . 83
4-13 Thermal expansion coefficient (CTE) comparison of Kovar Alloy with 94% A lum ina . . . . 85
4-14 (a) Grounding the mandrel using one translational and two rotational motions. (b) Only a 4" x 4" area was ground in the center of the 6" x6"
m andrel . . . . 86
4-15 The BoX Ultra Precision Free Form Grinding and Measuring Machine from Cranfield University . . . . 86
4-16 Method of fixturing the ceramic plate inside the BoX machine. ... 87
4-17 CMM measurements with a Lietz PMM-F, with a 5 mm probe tip. Larger P-V values can be seen at the ceramic plate's edges. . . . . 88
4-18 Confocal microscope images: (a) Refractron porous ceramic, holes of 25-30 microns distributed over the surface. (b) Cranfield porous ce-ram ic sam ple. . . . . 89
4-19 Ceramic Housing CAD Model (a) Top View (b) Bottom View . . . . 90
4-20 Tensile stress in the brazing interface plotted as a function of the num-ber of disks and their sizes . . . . 91
4-21 Actuation interfaces distributed on the perimeter of a 9" circle. . . . 92
4-22 Method for calculating brazing connection dimensions . . . . 92
4-23 (a) Mounting disk for actuation system. (b) Mounting disk for kine-m atic coupling. . . . . 93
4-24 (a) Air feedthrough, connects to a T-fitting (b) Thermocouple feedthrough, thermocouple is secured to it through adhesive. . . . . 93
4-25 (a) Capacitive sensor insert, with a clearance hole and thread. (b) Grounding plate . . . . 94
4-26 Top of the of the three-groove kinematic coupling used to repeatably position the bottom air bearing on the furnace hearth. . . . . 95
4-27 (a) Truncated and threaded ball, . (b) Cylindrical post mounted V-block, VB-75-CPM . . . . 95
4-28 Top air bearing, carries sensor grounding plates . . . . 96
4-29 Bottom air bearing, carries capacitive sensors. . . . . 96
4-30 Kovar (a) Young and Shear Modulus. (b) Poisson's Ratio. . . . . 97
4-32 Yield stresses of various Ni-Fe alloys as a function of temperature . . 98
4-33 Y ield . . . 100 4-34 FEA results illustrating the bow of the air bearing under its own
weight, when supported by the kinatmic coupling. A maxmimum de-flection of 75.3 nm is reported. . . . 101 4-35 Schematic of the XLE-3648 model from L&L Special Furnace Company 101 4-36 (a) Horizontal flexure configuration. (b) Vertical flexure configuration 103 4-37 Horizontal flexure configuration . . . 104 4-38 Vertical flexure configuration . . . 105 4-39 (a) Three linear actuator configuration. (b) M-235 Heavy-Duty
Preci-sion Linear Actuator from Physik Instrumente . . . . 106 4-40 Four linear actuator configuration, using a coarse-fine technique. . . . 106 4-41 (a) 23A102C Hybrid Non-captive Stepper Motor (b) PCL601USB
Pro-grammable Step Motor Controller (c) MBC05641 Microstep Driver . 108 4-42 CAD Model of the coarse motion stage . . . . 108
4-43 Cross-section view of the coarse motion stage CAD model. . . . . 109
4-44 FEA results showing the deflection of the coarse motion stage due to the load of the air bearing and driving rods. Maximum displacement w as 1 p m . . . . 109
4-45 PA 100/T14 piezo-actuator from Piezosystem Jena . . . 111 4-46 Force Generation vs. Displacement Curve for the Piezo-actuator . . . 111 4-47 Differential element of a beam under pure bending . . . 112 4-48 The fillet radii shown here are one-half, one, three-halves and two times
the blade thickness. The deflected shape and the contours of von Mises stress result from a moment load. [25] . . . 113 4-49 The stress concentration factor for moment loading is closely
approx-imated by a fourth-order polynomial, where r/t is the ratio of fillet radius to blade thickness. [25] . . . . 113
4-50 Flexure for top system . . . . 114 4-51 Clamped guided flexure boundary condition . . . . 115
4-52 FEA displacement of the piezo under 63N of total force . . . . 116
4-53 Different flexure types considered for the rotation flexure. (a) Hour-glass flexure. (b) Hinge flexure. (c) Blade flexure. . . . . 118
4-54 Schematic of the two layers of flexures giving the air bearing rotation freedom . . . . 119
4-55 Cantilever with end moment load . . . . 120
4-56 Displacement rotation . . . . 121
4-57 Natural modes and frequencies of the flexure assembly . . . . 122
4-58 Kovar rod out of the oven . . . . 123
4-59 Hollow macor rod . . . . 124
4-60 DAQ Modules . . . . 125
4-61 Overall slumping apparatus assembly . . . . 126
A-1 Typical viscosity temperature curve using a borosilicate glass as an example. Courtesy of BRAND GmbH. [24] . . . . 129
List of Tables
2.1 Properties of air used in the simulation . . . . 42
4.1 Requirements and Design Parameters of the new slumping tool . . . . 70 4.2 HPT-150 resolution in nanometers for different calibrations of
measur-ing range and frequency. ... ... 77 4.3 Requirements and Design Parameters of the new slumping tool . . . . 78 4.4 List of different high temperature Ceramic adhesives by Aremco . . . 79 4.5 Composition and properties of the Incusil Active Brazing Alloy from
Morgan Technical Ceramics . . . . 82
4.6 Comparison of different materials used for brazing to Aluminum Oxide 84 4.7 Grinding results of both plates . . . . 87 4.8 Elevated temperature properties of Aluminum Oxide at 600'C . . . 96 4.9 Composition of NILO Ni-Fe alloys and their densities. [9] . . . . 97
4.10 D263 glass weight in N, for different combinations of size and thickness 99 4.11 Air bearing load capacity, calculated at a gap of 50 pm . . . . 99
4.12 Functional requirements and design parameters of actuation system . 102 4.13 Functional requirements and design parameters of the coarse motion
stage ... ... 107
4.14 Functional requirements and design parameters of the fine actuation system . . . . 110 4.15 Requirements and Design Parameters of the new slumping tool . . . . 114 4.16 Deflection and maximum stress results for the piezo flexure . . . 116 4.17 Functional requirements and design parameters of the rotation flexures 117
4.18 Thermal conductivities of different materials . . . . 123
Chapter 1
Introduction
Since the discovery of glass by the Phoenicians around 5000 BC in the region of Syria, the versatility, low-cost and unique properties of this amorphous material have attracted both artisan and scientist. While the use of glass was initially restricted to glazing pots and vases, the discovery of glass-blowing techniques (27BC - 17AD)
allowed more versatile shapes and creations to be made from sand formed by fire. Glass has now become an essential part of many products we use in our every day lives. This large scale adoption can be credited to the continuous development of manufacturing processes that have improved quality and throughput over the years
[31].
Glass blowing was also the initial step in a variety of techniques used to obtain flat glass sheets between the 13th and 19th centuries such as broad sheet glass, crown glass, and cylinder glass (Figure 1-1). The first two processes fundamentally involve blowing a glass ball that is continuously twirled, until a disk is formed from which flat sheets can be cut. In the latter method, a cylinder is blown then cut open to produce a large flat sheet. The cylinder method allowed larger and more uniform sheets to be produced, and was thus the method of choice until the late 19th century. While these methods produced mirrors flat enough for artwork and window panels, they remained limited in their throughput and ability to minimize glass thickness variations [8].
The 20th century witnessed the development of several new techniques that re-placed old ones. Most flat glass today is produced through either the float process,
-57
4
Figure 1-1: Flat glass sheets produced through the (a) Crown Process (b) Cylinder Process
slot-draw process or the fusion process. Of the three processes, we only discuss the slot-draw process (Fig. 1-2) used to produce the Schott D-263 glass used in this re-search for to its low softening temperature'. As suggested by its name, this process involves drawing molten glass from a slot in the bottom of a glass reservoir, with the size of the slot determining glass thickness. Glass is allowed to flow downward as it solidifies and cools, and then directed by rollers on both sides to be cut, inspected and packaged at a production rate of 1-5 tons/day [17]. Despite only making contact once glass has solidified, rollers still have a small impact on thickness variation, which Schott rates for their 0.4 mm D-263 substrates as a maximum of 20 pm.
While this number may seem insignificant, thin glass substrates with stringent surface flatness requirements have become central to many applications such as pre-cision optics, the hard-disk industry and flat panel displays. In the case of liquid crystal displays, a critical gap of 5-10 pm known as the cell spacing must be main-tained between two glass sheets. Glass warp causes variations in cell spacing between different pixels, leading to variations in the electric field and non-uniform color [5]. Since commercially available glass has a surface flatness up to 600 pm, holding critical cell spacing tolerances is a challenge and a major constraint for flat panel technology. Given that surface flatness errors are more pronounced for thin glass, sheets thicker
Stirrer
Hot glass
-Slotted orifice
0 o Pulling rollers
Thin glass
Figure 1-2: Schematic of the Slot-draw process, used to produce Schott D-263 glass sheets used in this research
(a) (b) (c)
Figure 1-3: (a)Glass sheet with flat surfaces and a uniform thickness. (b) Glass sheet with uniform thickness but with non-flat surfaces. (c) Glass sheet with one flat surface (right surface) but not uniform in thickness.
than necessary must often be used to meet the desired performance adding to the overall weight of the displays. Achieving similar flatness on thinner displays at a comparable cost is therefore desirable. Figure 1-3 illustrates the difference between sheet thickness variation and flatness, two different concepts that are often conflated.
1.1
X-Ray Telescopes Optics
X-ray astronomy is the branch of observational astronomy concerned with the study of x-ray emissions from celestial objects. The invisible realm of x-ray emissions in space is generated by a variety of high-energy phenomena such as matter reaching temperatures of millions of degrees, high magnetic fields and high concentrations of matter like black holes. Observations made at the x-ray band can help scientists better understand the turbulent processes occurring in neutron stars, and uncover some of the earliest black holes in the universe by penetrating surrounding gas and dust clouds [10]. This information can help answer important questions about the history of our galaxy and our universe. Figure 1-4 shows a few examples of the images that can be obtained with x-ray telescopes.
(a)
(b)Figure 1-4: (a) Tycho's supernova remnant, produced by the explosion of a white dwarf star in our Galaxy, 10,000 light years away. (b) NGC 4151 is a spiral galaxy with an actively growing supermassive black hole at its center. (c) A star's spectacular death in the constellation Taurus was observed on Earth as the supernova of 1054
A.D.
The high energy (0.1 - 10 keV) and short wavelength (0.1 - 10 nm) of x-rays cause them to undergo photo-electric absorption in the Earth's atmosphere (Figure
1-5) making Earth-based observations impossible. X-ray instruments must therefore
be mounted on high altitude balloons, carried on sounding rockets or sent to orbit via satellites in order to capture the high energy photons. Furthermore, to avoid photo-electric absorption in the telescope, x-rays must be focused by reflecting them at glancing angles by parabolic-hyperbolic mirror pairs known as the Wolter I ar-rangement, depicted in Figure 1-6. Very strict figure requirements are imposed on x-ray reflecting surfaces in order achieve high resolution imaging.
1.1.1
Monolithic Mirrors
NASA's 10 m focal length Chandra X-ray Observatory is perhaps the most known among space x-ray telescopes. In order to achieve its record overall resolution of 0.5 arcsec, Chandra utilizes thick monolithic mirrors that were ground and polished to yield a smoothness on the order of a few atoms [20]. However, the heavy weight of the monolithic mirrors meant only 4 sets could be flown providing with an overall collecting area of only 800 cm2 (Figure 1-7).
X-ray photon
electron ;y
oxygen atorn
PHOTO-ELECTRIC ABSORPTION
Figure 1-5: Photo-electric absorption: Incident photons are absorbed and electrons ejected at high velocities.
Paraboloid Hyperboloid Surfaces Surfaces
X-rays
Focal Point
X-rays
Figure 1-6: A Wolter-1 mirror configuration containing 4 nested shells, with incoming x-rays reflected at glancing angles
d
4 Nested Paraboloids
4 NestedHyperboloids
fge ed
Mirror eleents are 0.8 n lon and rom
0.6
m to 1.2 m diareerFigure 1-7: Nested mirrors in the Wolter configuration in the Chandra telescope
X-rays x-rays
Figure 1-8: Thousands of nested mirrors in the Wolter configuration in the XMM Newton telescope
1.1.2
Sheet Optics
Sheet optics are a lightweight alternative to monolithic mirrors, and have been used on several X-ray telescopes such as the European Space Agency's X-ray Multi Mirror
(XMM) and joint US-Japanese ASTRO-E telescopes. Thousands of sheet optics were
used in a nested shell arrangement (Fig. 1-8) to achieve a much higher collecting area than monolithic mirrors for the same weight or cost. The main drawback with sheet optics is the limit on the resolution, with the resolutions for XMM and Astro-E being
15 and 110 arcsec respectively [28, 13].
1.1.3
International X-ray Observatory Requirements
In the case of the proposed International X-ray Observatory (IXO) which this research was targeted for, a much larger area of 3 m2 is required at a resolution of only 5 arcsec
to resolve more distant and faint objects. Due to the large collecting area, payload restrictions limit the areal density of the glass to 50 gm/cm 3, 50 times smaller than Chandra and 8 times smaller than XMM [18]. Achieving the required resolution on substrates only 400 pm thick at a reasonable cost is the main challenge facing the
E rror
Glass Sheet
5 arcsec
L=100 mm
Figure 1-9: Tolerated surface flatness error within IXO requirements
IXO mission and the main motivation behind this work. For substrates 100mm long, the 5 arcsec requirement translates to a surface error due to bow of roughly 0.6pim as shown in Figure (1-9).
1.2
Current Techniques to Improve Flatness
Over the past decade much research has been devoted to producing glass sheets that can meet IXO performance requirements. Researchers at the Goddard Space Flight Center have adopted a glass slumping technique while their European counterparts at ESA have been developing a silicon pore optics approach. Both techniques are described herein and their pros and cons outlined. Earlier experiments by the Space
Nanotechnology Laboratory with non-contact slumping techniques are then presented,
and are the foundation for this work.
1.2.1
Conventional Thin Optic Slumping
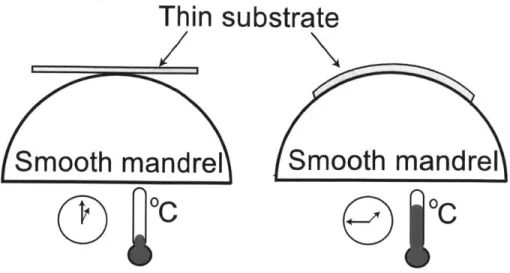
Conventional glass slumping is performed by placing a flat glass substrate over a ceramic mandrel of the desired shape. Both are then heated in a furnace to just
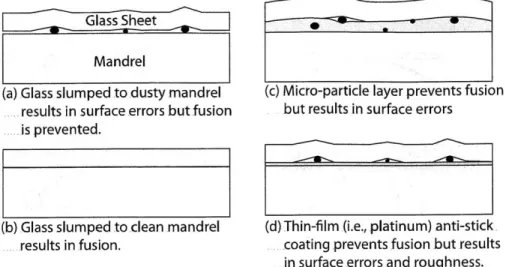
above the glass transformation temperature (500-700 C) so that the softened glass may conform to the shape of the mandrel (Figure 1-10). The pair is then cooled at a slow rate and the shaped glass removed. While this process is simple in principle, it suffers from several drawbacks that may prevent obtaining a satisfactory glass surface (Figure 1-11). Experiments done at Goddard have showed that dust particles on the mandrel cause mid-range spatial frequency errors on glass flatness [37]. Thorough
Thin substrate
Smooth mandrel
Smooth mandrel
C
jC
Figure 1-10: Schematic showing how a glass sheet conforms to mandrel shape as temperature is raised just above transformation temperature
cleaning of the mandrels from dust particles results in another undesirable outcome, with the glass sticking to the mandrel due to the absence of the dust particles that served as spacers between both parts. Stiction has been traditionally mitigated by artisans by coating the mandrel with a slurry of microscopic particles of refractory material, and then buffing it with a rag. Goddard adopted this approach, using boron nitride powder (manufactured for the cosmetics industry) to coat the mandrels. While this solution prevents stiction and is satisfactory for artwork, the non-uniform mixture of microparticles, larger particulate contaminants in the powder, lint, dust and other debris from the rubbing process still leaves behind a poorly controlled surface.
A further complication with coatings is the large coefficient of thermal expansion (CTE) mismatch between the glass and the mandrel. During cooling, the thermal
asymmetry caused by glass facing air on one side and the mandrel on the other results in a temperature gradient developing across the glass. This gradient freezes into the glass causing distortions that can only be prevented by undergoing very slow cooling rates, with Goddard's slumping cycles currently running for several days. Since IXO requires around 14,000 of these mirrors, an acceptable production rate using this technique necessitates having an aircraft hanger filled with furnaces running in parallel, which renders this approach highly inefficient.
Mandrel
(a) Glass slumped to dusty mandrel (c) Micro-particle layer prevents fusion results in surface errors but fusion but results in surface errors
is prevented.
(b) Glass slumped to clean mandrel (d) Thin-film (i.e., platinum) anti-stick.
results in fusion. coating prevents fusion but results
in surface errors and roughness.
Figure 1-11: (a)-(d) Depiction of sticking problem encountered during conventional thermal shaping of thin glass optics, and the problems with proposed solutions.
Using this technique, the best resolution obtained by Goddard was 15 arcsec for an assembled paraboloid-hyperboloid mirror pair, and it remains to be seen how the desired performance will be achieved.
1.2.2
Silicon Pore Optics
This is the fabrication process adopted by the Europeans
[14].
European Space Agency (ESA) chose to begin with 300 mm-diameter silicon wafers. While these substrates are generally smooth and uniform in thickness (< 1pm), their flatness is on the order of 10 pm. The mirror-side of the wafers is coated with metal to achieve good x-ray reflectivity, and the backside is diamond sawed to form a series of ribs that will serve as spacers between subsequent mirrors in the radial direction (Fig. 1-12a). However, this means that the ribs have to be shaped in the axial direction with tol-erances < 0.1pm to form the paraboloids and hyperboloids of revolution required by Wolter x-ray optics, making this a critical and difficult step. An assembly robot then forces the substrate into the desired conical shape, and bonds subsequent mirrors (in the radial direction) together through a cold weld (Fig. 1-12b-c).There are many concerns about the viability of this technique, such as the signif-icant x-ray blockage caused by the frequently-spaced ribs as well as diffraction from
(d)
Figure 1-12: Photographs of the ESA pore optics fabrication process. (a) Silicon wafer after backside ribsawing and front side metallization. (b) Optic assembly robot. (c) First mirror being bonding to formingmandrel. (d) Final optic module mounted for x-ray testing.
the rough backside surfaces. Furthermore, assembly stack-up errors cannot be cor-rected for with this technique due to the rigidity of the wafers, and dust particles interfere with the cold weld process creating delaminated regions that tend to grow with each bonding cycle.
Currently, ESA reports having achieved a resolutions of 17 arcsec. However, these results are of the least curved (outermost) mirrors of the 50 m focal length XEUS mission. It is expected that the silicon pore approach will face great difficulties with the strongly curved (innermost) mirrors of the shorter focal length (25 m) IXO telescope. Furthermore, the need to slice mirrors from 300 mm-diameter wafers limits mirror size to 200 x 200 mm2
, half the size required by IXO. While ESA points out that future 450 mm wafers can solve this problem, most semiconductor industry observers
believe the transition to that size is unlikely. Another drawback is the the small gap between concentric mirrors (500 pm) dictated by wafer thickness. This ultimately limits the telescope's spatial frequency due to Fraunhofer diffraction, as the angular spread due to diffraction is given by 0 = A , where A is the wavelength and d is the gap between mirrors. Even at the low energy end of IXO's energy band this accounts for 1.3 arcsec, a large fraction of the error budget. In light of these facts, we believe that this approach has little chance of progressing to better resolution and is not the ideal path for achieving mission requirements.
1.3
MIT Slumping Tools
1.3.1
Pin Chucks
In an attempt to circumvent traditional slumping technique problems such as dust and stiction, research was conducted at Space Nanotechnology Laboratory to develop their 1st generation slumping tool relying on pin chucks [30]. The warped sheet would
Dust Thin Substrate
Particle
"" -n
n - - Pin.nFlat Mandrel Chucks Flat Mandrel
(a) (b)
Figure 1-13: An array of pins fabricated on a flat fused silica mandrel to allow for dust particles to settle between pins. (a) shows a thin substrate at room temperature and (b) shows the substrate after slumping.
be placed on a rectangular array of thousands of 25 x 25 x 2.5 pm3 fused silica pins interspaced by 250 pm gaps, with the aim of having the dust particles settle between the pin chucks making no contact with the glass (Figure 1-13). A thin rough layer of TiO2 was used to coat the pins, both to protect them from damage and prevent
stiction to the glass. While this technique was successful for small glass sheets, problems were faced trying to scale it to larger optics due to a lack of reproducibility
Porous Mechanical
Ceramic Support
Mandrelel
Air Flow AirFlow
(a) Glass Plenum
(b) BeforeSlumping After Slumping Figure 1-14: Schematic of the slumping process, not drawn to scale. (a) Glass sheet is vertically suspended by hooks between the mandrels, never making contact with their surfaces. Gap is much smaller than glass thickness. (b) Viscous restoring forces drive the glass to be symmetry about its midplane.
in the TiO2 coating process. This technique was eventually abandoned in favor of porous air bearings discussed in the next section.
1.3.2
Porous Air Bearings
Work was conducted at the Space Nanotechnology Lab to develop a second generation slumping tool relying on air bearings, with the aim of eliminating the issues with dust particles and stiction [1, 2]. In this process, glass sheets are vertically hung between a pair of micro-porous ceramic air bearings ground to sub-micron flatness. Mandrel faces are spaced apart by a distance 10-100 pm larger than glass thickness (Fig 1-14), resulting in a 5-50 pm-gap on each side of the glass that is much larger than typical dust particles. This ensures that ripples and dimples caused by particles are no longer present.
Each air-bearing is assembled by mechanically clamping the ground mandrel to a housing to form a plenum chamber. Backside pressure is maintained by continuously supplying air into the furnace through stainless steel tubing, effectively generating uniform pressure distributions on each side of the glass. These pressure distributions
serve as viscous restoring forces that correct glass shape inside a furnace and restore symmetry about the midplane (Fig. 1-14b).
To avoid dust particle problems, an air gap of 50 pm was achieved using Tantalum spacers from AD McKay (Figure 1-15). Supply pressure was maintained at 0.25 psi
No contact between main glass and edge (thickness control) glass pieces
. - Porous mandrel
Contact between main glass and edge (thickness control) glass pieces
Figure 1-15: Glass sheets are hung by two hooks through holes made by laser ablation. Tantalum spacers are used in conjunction with chamfered glass edges to obtain the desired air gap.
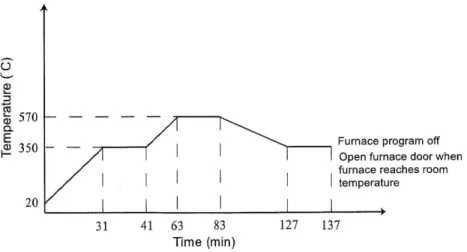
in the plenum. The temperature profile followed that shown in 1-16, with the peak portion of the cycle being at 570'C for 20 minutes.
570 350 Furnace pros Open furnac furnace reac temperature | | I I I I I I gram off e door when hes room 31 41 63 83 127 137 Time (min)
Figure 1-16: The temperature cycle followed for slumping the glass between two porous mandrels
0 -0 P-V: 2.26 um -05 y (nora2ed) 2 05 -0 P-V: 1. 16 urn 00 -05 0 y srwmZedI x (nomakzed)
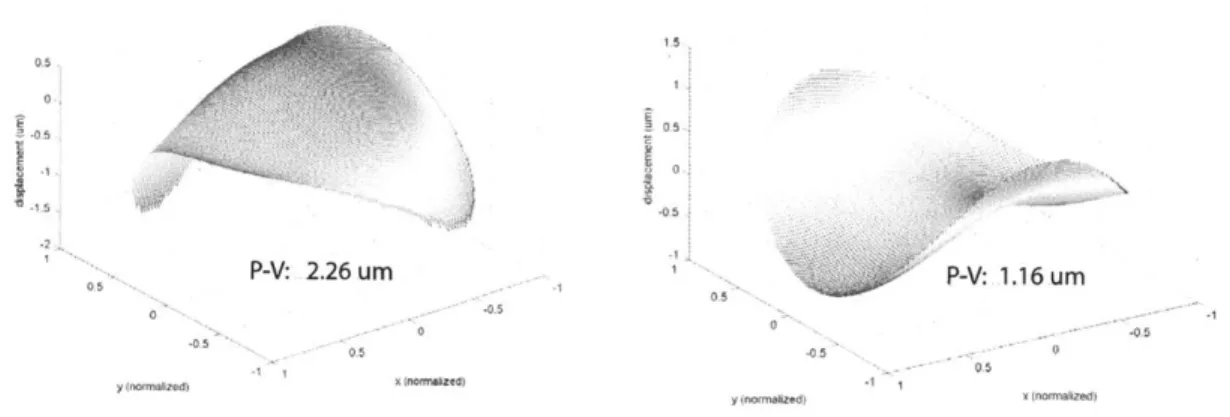
Figure 1-17: (a) Surface of Glass HI with Difference map between Glass Hi and H2,
2.26 pm P-V of warp after slumping.
P-V of 1.61 pm.
Surface Deformation Histogram
60 0 0 -- - - - - -- - - - -5-0U 5000 - ---- - --4 0 0 0 - - - -- - - -- - - -- - - -1000 - - - --2 -1.5 -1 -0.5 0 0.5 1 1.5 2 E Deformation (pm) RMS: 0.39 pm (a) Angle x Histogram .25 -20 -15 -10 -5 0 5 10 15 20 25 * Angle x (arcsec) RMS: 7.53 arcsec Angle y Histogram 3500 - -- - - -3000 - - -- -- --25100 - - - -- - --50 -4 -40 -35 -30 -25 -20 -1 -10 -5 0 5 10 15 20 25 30 Angle y (arcsec) RMS: 12.22 arcsec (c)
Figure 1-18: Histograms of surface of Glass HI after slumping
Experimental Results
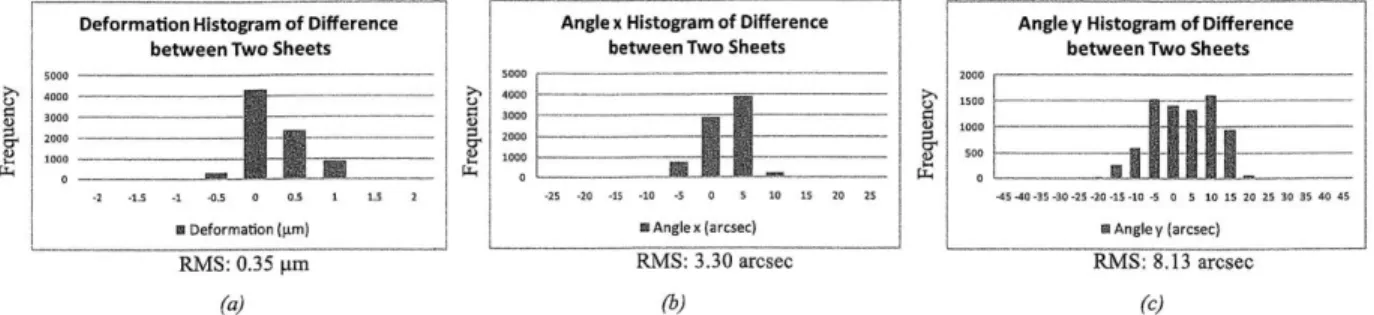
Two separate sheets of dimensions 100 mm x 100 mm x0.4 mm were slumped using the method described above. Results were measured using Shack-Hartmann metrol-ogy system with a repeatability of 40 nm [11]. Glass was constrained during the measurement using a metrology truss with 50 nm repeatability [15]. Measurements showed that the process reduced the the initial 80-600 pum P-V warp down to as little as 2.26 pm with 0.39 pm rms, as depicted in Figure 1-17a. The surface difference between the two separate sheets was 1.6 pm with 0.35 pm rms, shown in Figure 1-17b. Histograms describing the slopes in the x and y directions further reveal that a larger warp was observed in the y-direction aligned with the gravity vector
[3].
Despite the very promising results, the slumping apparatus had several sources
X (normAhzed)
Deformation Histogram of Difference Angle x Histogram of Difference Angle y Histogram of Difference between Two Sheets between Two Sheets between Two Sheets
5000 -5000 -o- 2000 -4000 - - 4000 - 1500 3000 - - - -- - ' - -- 3000 1 0 - - - -= - - -. 2000- -1000 1000 --- --- - 500 -2 -1.5 -1 -0.5 0 0.5 1 15 2 -25 -20 -15 -10 -5 0 5 10 15 20 25 -45 40 -35 -30 -25 -20 -15 -10 -5 0 5 10 15 20 25 30 35 40 45
a Deformation (pm) E Anglex (arcsec) M Angle y (arcsec)
RMS: 0.35 pm RMS: 3.30 arcsec RMS: 8.13 arcsec
(a) (b) (c)
Figure 1-19: Histograms of the difference between Glass HI and Glass H2 after slump-ing each individually
Toai r inoki lobes Ilosio l I 'mco Iaeow hotoojo C ci tso
0omp I eso
AirI inorI6/k
I .o00't'ol000000 0 unnc
DAQ card
ws-d r. it) Nensr,o omoomdo foorsoo.1
-(a) (b)
Figure 1-20: (a) Vertical slumping apparatus placed inside the furnace. (b) Schematic illustrating how pressured air is supplied and its pressure measured is measured via data acquisition hardware.
of error that were suspected to be limiting repeatability of the results. Most no-table is the absence of closed-loop pressure control (Figure 1-20b). Mass-flow meter knobs were manually adjusted to equalize pressure during the experiment. Since the
coarse knobs could not be precisely set to the same position during every run, it was speculated that closed-loop pressure control for both chambers can help improve re-peatability of the results. The larger warp in the direction of the gravity vector also suggested that gravity effects could be contributing to the error. Since this design's assembly process could be causing slight angle variations from run to run, monitoring and controlling apparatus tilt was suggested as a possible way to improve repeatabil-ity. Furthermore, the repeatability measurements compared two different glass sheets.
Since each sheet has it's own thickness variation profile, a portion of the repeatability error can be attributed to glass thickness variation and can be eliminated by double-side grinding the substrates or by slumping the same glass sheet twice and comparing both results. Chapters 2 and 3 investigate these suggestions, and conclusions about the contribution of each factor are made.
Chapter 2
Mathematical Model
In order to select appropriate process parameters for the porous air bearing exper-iments described in Chapter 1, a basic mathematical model had been developed to calculate pressure distributions on the mandrel surface for various gap sizes and
sup-ply pressures. A prominent result obtained from this model was characterizing the
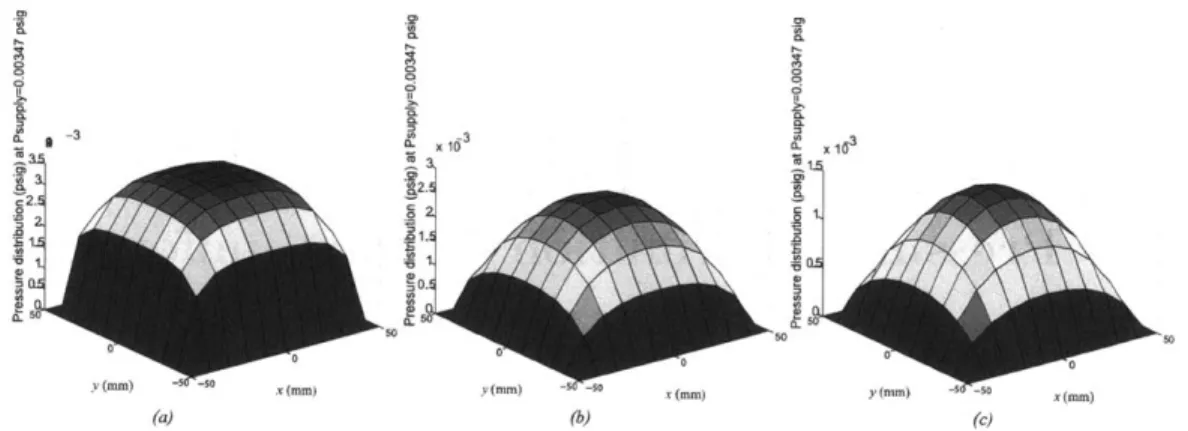
relationship between gap size and pressure distribution uniformity. Simulations sug-gested an inverse proportionality, depicted in in Figure 2-1.
.0 5
163
16
o.o2.
y( --) -50 o (mm) y(mm) -S-P-so Xom( ) y(m) -5 -so X(MM)
(a) (b) (c)
Figure 2-1: The pressure profile at 600'C in the air gap of a 100 mmx 100 mmx 12.7 mm porous bearing at film thickness of (a)5 ptm (b)10 prm (c)15 pm
Although useful for the design of the initial slumping tool, the model was some-what limited by its assumptions of a uniform gap across the mandrel, uniform glass thickness, and a gravity vector orientation parallel to the glass sheet (Figure 2-2a). Furthermore, it only accepted two input parameters, supply pressure and gap size.
CL C I AM A2 0-6
G lass sheet
RDax
Ig
1
4 1(j)(a) (b)
Figure 2-2: (a) Porous air bearing with a uniform gap. (b) Porous air bearing with a nonuniform gap
In this chapter, we build on the previous work to develop a model capable of predicting final glass shape based on the individual pressures in each plenum, gravity vector orientation and glass thickness variation. To achieve this capability, we must first generalize the old model in order to predict pressure distributions for non-uniform gaps, as shown in Figure 2-2b.
2.1
Pressure Distribution for Non-uniform Gaps
The assumption of perfect parallelism between the mandrel and the glass sheet is useful for first order calculations, but is never the case in practice. Factors such as mandrel surface imperfections, glass thickness variations and glass tilt/deformation all contribute to the the non-uniformity of the gap, and are depicted in Figure 2-2b. The assumptions made in the model are summarized here:
1. Creeping flow in the porous ceramic medium, governed by Darcy's law shown
in Equation 2.1
y and z directions.
3. Air flow treated as an ideal gas, properties at the elevated temperature
sum-marized in Table 2.1. Air is isothermal throughout the medium.
4. Steady state conditions in the system.
5. Negligible pressure gradient in the gap along the z direction, compared to the x and y directions.
6. Low Reynold's number laminar flow, therefore air is incompressible.
7. No fluid accumulation occurs in the porous medium.
8. Rigid glass sheet and fixed gap.
y
(a)x
(a)I
w
I
L
Glass Sheetz:
x H'(x,y) = H + M(x,y)Ps
Figure 2-3: Air bearing with a non-uniform gap: (a) Top view. (b) Side view
Density (kg/m 3) Viscosity (pPa.s)
20 0C 1.2 18.3
600 0C 0.4 40.65
% change -66.4 122
Table 2.1: Properties of air used in the simulation
2.1.1
Governing Equations
Darcy's Law is a simple mathematical relation that governs fluid flow through per-meable material, and is given by
U
= -- Vp'. (2.1)A
This equation is used to model our air bearing, where U' is the air velocity vector field in the porous ceramic, k is the permeability coefficient, A is air viscosity and Vp' is the pressure gradient. The equation of continuity describing conservation of mass is also needed,
atu' &v' &w'
+ + = 0, (2.2)
89x By Bz
where u', v' and w' are the air velocity components in the x, y and z directions respectively. Equation 2.1 is then plugged into 2.2 to obtain
a2p' 92
P/
a2p/kx +k + k =0 (2.3) ax2 k9ay2
zaz2
where kx, ky and kz are the ceramic permeability coefficients in the x, y, z directions respectively. Next, Equation 2.3 is normalized through the following dimensionless variables i = x/L, 9 = y/W, i = z/H, P' = p'Pa, Kx = kx/k, and Ky = kvlk,
where pa is the ambient pressure and L, W and H are the length, width and thickness of the ceramic mandrel respectively, shown in Figure 2-3. Kx = Ky= 1 in the
isotropic case. The non-dimensionalized equation becomes 2 __2 L 2 g2p 18D2 H 822 Kx2 + Ky -L) (2.4)
2.1.2
Boundary Conditions
Equation 2.4 coupled with the boundary conditions (Figure 2-4) on the ceramic man-drel's six surfaces allow us to deterministically predict the pressure. The ceramic's bottom surface is one of the plenum walls, and is exposed to the supply pressure P,. The four sides of the mandrel are sealed such that there is no leakage, and along these surfaces the pressure gradient is zero. The pressure boundary condition of the top surface facing the glass is more complex, and is derived from the Navier-Stokes equation as follows, X. (a) I z - ---
-fIL\
P
=Ps
Sealed Modified Reynold's EquationFigure 2-4: Air bearing with a non-uniform gap
(a U
P t + U - VU = ,-p + p,2 U + f
( t
(2.5)where p is the density of the air, U is the velocity vector in the gap, p is air pressure in the gap, y is air viscosity, t is time, and
f
represents external forces such as gravity. Equation 2.5 is essentially the conservation of momentum equation for the fluid, withthe left-hand side representing inertial forces, and the right-hand side including the pressure gradient, viscous forces and other external forces [221.
Our model assumes steady state conditions, with the air gap h(x, y)
<
L, W, thelength and width of the ceramic mandrel respectively. Given the low fluid volume to surface area ratio, viscous terms on the right-hand side dominate and the left-hand side of the equation can be dropped. Since the pressure drop in the z direction is neglected, the driving force for flow in the gap is the pressure gradient in the x and
y directions, with much larger velocity components in both these directions. Due
to the lower flow resistance in x and y, the second order differential terms of their velocity U are negligible compared to z. The gravity component of
f
for flow in thez direction can be neglected, due to the small volume to surface area ratio in the gap.
The Navier-Stokes equation therefore reduces to
82U 1
= -Vp. (2.6)
az2 A
Equation 2.6 is then integrated twice with respect to z, using the boundary conditions
U = 0 on the air-glass interface (z = H + D(x, y)), and U = U' on the ceramic-air
interface (z = H + M(x, y)). Note that the z' axis is measured from the nominal mandrel surface, as shown in Figure 2-3. This step yields
1 (D-)
U
= -(z 2 - (D+ M)z + DM)Vp +
'z)/
(2.7)2pt (D - M)
where U = U (x, y, z) is the velocity vector field in the gap. The velocity variable U' is then replaced by a pressure variable through Darcy's law in Equation 2.1, and the individual velocity components of Equation 2.7 become
1 z2 (D + M) DM (z - D)) 8p u z + + k, (2.8) p 2 2 2 ( D - M ) ax 1 Z2 (D + M) DM k (z - D) p V = __ z + + -(2.9) y 2 2 2 (D - M)) y
w =
(D-M)k
J
/(2.10)
(D - M ) p I z =H_where M = M(x, y) represents off-nominal mandrel imperfections and D = D(x, y)
is the distance from the nominal mandrel surface to the glass surface. For the u and v components, the negligible pressure drop across the gap implies that pressure gradients in the gap are equal to those on the ceramic-air interface (p = p'). For the
w component, pressure drop across the gap is neglected, and pressure is left in terms
of that in porous medium p'. We next apply conservation of mass by substituting the derivatives of these velocity components into the continuity equation,
Du Dv Dw
Ox Dy Dz (2.11)
and integrating the result across the gap from z = H
+
M(x, y) to z = H+
D(x, y)to obtain the two-dimensional equation in x and y
(D - M) (D - M)2 + 6k] + 2p
8X2 igy2
+3 [(D - M) 2 + 2k] ( 2 (D
-M)22 + D(D - M)
p
= 12k Dp"(Dx
Dx Dy Dy 19z) H'The substitution h = h(x, y) = D(x, y) - M(x, y) is then applied to obtain
(2.12)
h[h + 6k] 2 ) +3[h 2 + 2k] (Dhax+
( x2
gy2
axax
Given that k is in on the order of 10- m2 and h2 is The equation simplifies to
h 2p + D2P + 3h2 (Dh p+ Dhap
oX nu n gapx Dotuy y,
Non-uniform gap contribution
DhOp _12k OPI Oyay) Oz )z=H' (2.13) about 10-12 MI2 , k < h2 [16]. (Dp' -12k Dz (2.14)
or in abridged form,
h V2p + 3h2Vp Vh= 12k az V -
(h
3vP)
=12k(.
( Z) z=H'
We then non-dimensionalize Equation 2.14 using the non-dimensional variables de-fined earlier to obtain
h
3H
12kL
2(
2
p
gg 2 2 a2p ag23h2
H
12kL2(h
ap
82
a8a
L 2 W 8D 89 ) z=H' (2.16)The variable a = H/(12kL2) can be used to simplify the equation [35].
2.1.3
Numerical Analysis
The finite differences method (FDM) is implemented to solve the coupled partial differential equations. The ceramic plate is divided in a grid of nodes, separated by distances of A,, Ap and Ai in the x, y and z directions respectively. The second order partial differentials are approximated from Taylor polynomials as