HAL Id: hal-01409015
https://hal.univ-lorraine.fr/hal-01409015
Submitted on 5 Jul 2019HAL is a multi-disciplinary open access archive for the deposit and dissemination of sci-entific research documents, whether they are pub-lished or not. The documents may come from teaching and research institutions in France or abroad, or from public or private research centers.
L’archive ouverte pluridisciplinaire HAL, est destinée au dépôt et à la diffusion de documents scientifiques de niveau recherche, publiés ou non, émanant des établissements d’enseignement et de recherche français ou étrangers, des laboratoires publics ou privés.
porosity evolution upon hydration of a compacted
swelling clay
Luc Massat, Olivier Cuisinier, Isabelle Bihannic, Francis Claret, Manuel
Pelletier, Farimah Masrouri, Stéphane Gaboreau
To cite this version:
Luc Massat, Olivier Cuisinier, Isabelle Bihannic, Francis Claret, Manuel Pelletier, et al.. Swelling pressure development and inter-aggregate porosity evolution upon hydration of a compacted swelling clay. Applied Clay Science, Elsevier, 2016, 124-125, pp.197 - 210. �10.1016/j.clay.2016.01.002�. �hal-01409015�
1
Swelling pressure development and inter-aggregate porosity evolution
1upon hydration of a compacted swelling clay
23 4
Luc Massata,b,c, Olivier Cuisiniera,b,*, Isabelle Bihannicd,e, Francis Claretc, Manuel Pelletierd,e, Farimah 5
Masrouria,b, Stéphane Gaboreauc,* 6
7
a CNRS, LEMTA, UMR 7563, Vandoeuvre-lès-Nancy F-54500, France 8
b
Université de Lorraine, LEMTA, UMR 7563, Vandoeuvre-lès-Nancy F-54500, France
9
c
BRGM, Bureau de recherches géologiques et minières, Orléans, France
10
d
CNRS, LIEC, UMR7360, Vandoeuvre-lès-Nancy F-54500, France
11
e
Université de Lorraine, LIEC, UMR7360, Vandoeuvre-lès-Nancy F-54500, France
12 13 14
*Corresponding author at: 15
LEMTA, Université de Lorraine-CNRS, UMR 7563, 2 rue du Doyen Marcel Roubault,TSA 70605, 16
54518 Vandœuvre-lès-Nancy Cedex, France. E-mail address: [email protected] 17
(O. Cuisinier). 18
BRGM, Water, Environment and Ecotechnologies Division, 3 avenue Claude Guillemin, 45060 Orléans 19
Cedex 2, France. E-mail address: [email protected] (S. Gaboreau). 20
2
Abstract
22
A specific oedometer cell has been set up to measure the swelling pressure of compacted 23
montmorillonites at constant volume and to concomitantly visualize the evolution, upon wetting, of how 24
the microstructure is organised through X-ray microtomography. The swelling pressure experiments 25
were conducted with solvents of various natures. In addition to conventionally used water and saline 26
solutions, we used an organic solvent (methyl methacrylate – MMA). We chose this to explore the effect 27
of its different physical and chemical properties, and to differentiate the respective roles of crystalline 28
and osmotic pressures on macroscopic swelling behaviour. 29
The results, which combined both swelling pressure measurements and quantification of microstructure 30
evolution upon hydration for the two different solutes, give sound understanding on the development of 31
osmotic and/or crystalline swelling and their relative impact both on the microstructure and on the 32
magnitude of the macroscopic swelling pressure of compacted montmorillonites. 33
3 35
1 Introduction
36Clays are of importance for many geo-mechanical environments: they are ubiquitous on Earth’s surface, 37
where they play an important role in soil stability. They are also commonly used as engineered barriers 38
or backfill materials in the design of waste disposal repositories (Kaufhold et al., 2015). The main 39
properties that swelling clays such as smectites offer to limit pollutant transfer and ensure the mechanical 40
stability of engineered constructions include ion adsorption capacity, sealing ability, and low 41
permeability. Depending on the context, fluids of different natures (e.g. alkaline, acid, salty) may interact 42
with clay materials. We need to understand the driving force responsible for the underlying clay swelling 43
to optimize engineered barrier behaviour. Therefore, to assess performance, we have to understand 44
swelling pressure development in situations close to field conditions. 45
Swelling behaviour in bentonites is mainly related to the presence of montmorillonites, a clay mineral 46
made of 2:1 layer structure in which one octahedral sheet is sandwiched between two tetrahedral layers 47
(Figure 1). Due to isomorphous substitutions involving either the tetrahedral or the octahedral sheet, the 48
clay unit layer bears a structural negative charge, which is balanced by cations adsorbed on layer surfaces 49
in the interlamellar spaces. The particular behaviour of clay with respect to water or aqueous solutions 50
results from cation hydration, but is also influenced by how the sheets are turbostratically stacked to 51
form particles (Bergaya and Lagaly, 2013). 52
For a clay system in contact with an aqueous solution or a humid atmosphere, two main processes 53
contribute jointly to control the overall swelling in the materials: crystalline swelling and osmotic 54
swelling (Laird et al., 1995; Madsen and Müller-Vonmoos, 1989; Norrish, 1954). Crystalline swelling 55
happens at the nanometric level for the lowest water contents (undersaturated systems). From an initially 56
dry state, hydration occurs on the most energetic sites, i.e. on unit layer surfaces (both on particles’ 57
external interfaces and in interlayer spaces) and on interlayer cations (Bérend et al., 1995; Cases et al., 58
1992; Rinnert et al., 2005). This latter phenomenon of cation solvation results in the successive 59
adsorption of several water layers in the interlamellar spaces and leads to separation of clay unit layers 60
that can be followed by the measurement of the basal spacing (d001)using X-ray diffraction (XRD). 61
4
Several authors, for instance Lloret et al. (2003), Ferrage et al. (2005), Likos and Wayllace (2010), 62
Holmboe et al. (2012) and Villar et al. (2012), have shown that for Na-montmorillonites the basal 63
spacing d001 evolves from 9.7 Å in the dry state to 12.6 Å, 15.6 Å and 18.6 Å corresponding to one, two, 64
or three water layers, respectively, as the relative humidity increases. Crystalline swelling is influenced 65
by different parameters such as interlayer cation nature, relative humidity or water activity, dry density 66
and swelling conditions (free or confined) (Di Maio, 1996; Di Maio et al., 2004; Imbert and Villar, 2006; 67
Karnland et al., 2011; Karnland et al., 2008; Karnland et al., 2006; Karnland et al., 2007; Kaufhold et 68
al., 2015; Komine and Ogata, 1994, 1996, 2003; Komine et al., 2009; Lloret et al., 2003; Pusch, 1982; 69
Schanz and Tripathy, 2009; Sridharan et al., 1986; Studds et al., 1998; Villar et al., 2012; Villar and 70
Lloret, 2008). 71
In addition to crystalline swelling, the other process that comes into play during hydration is osmotic 72
swelling. This occurs for higher water contents (water activities above 0.8-0.9 and in saturated systems) 73
and corresponds to a further ingress of water in the materials (Madsen and Müller-Vonmoos, 1989). The 74
driving force for osmotic swelling is the repulsion between the electrical diffuse double-layers that form 75
on platelet surfaces (Chapman, 1913; Gouy, 1917; Gouy, 1910; Stern, 1924). For smectites exchanged 76
with monovalent cations, osmotic swelling manifests itself by clay platelet separation distances larger 77
than 40 Å and that can progress continuously towards infinity for very dilute suspensions (Meleshyn 78
and Bunnenberg, 2005; Michot et al., 2004; Norrish, 1954). For divalent smectites (Ca- or Mg-79
montmorillonite), osmotic swelling seems to be prohibited in the interlayer spaces due to strong ion-ion 80
correlation forces that reduce double-layer repulsion (Kjellander et al., 1988; Wang et al., 2011). For 81
divalent montmorillonite, the greatest basal spacing measured does not exceed 19 Å (Holmboe et al., 82
2012; Michot et al., 2013; Norrish, 1954). Even if basal distances are limited to 19 Å, Ca-83
montmorillonite may continue to accommodate additional water that cannot enter the interlamellar 84
spaces and that is found outside particles. This phenomenon is called “inter-particle osmotic swelling” 85
and is linked to osmotic forces that may exist on the particles’ outer surfaces (Madsen and Müller-86
Vonmoos, 1989; Segad et al., 2010), meaning that the interlamellar spaces are not the only places that 87
play an important role in the swelling behaviour of clay materials but particles’ external surfaces have 88
also to be taken into account (Laird, 2006; Liu, 2013; Madsen and Müller-Vonmoos, 1989). 89
5
From this we conclude that regardless of the swelling mechanism and whatever the cation nature, 90
hydration will induce major reorganization in both the clay fabric and the associated porosity. That is 91
why we must refer to porosity when we speak of swelling. 92
Many studies (Bihannic et al., 2009; Bihannic et al., 2001; Cases et al., 1992; Keller et al., 2013; Likos 93
and Wayllace, 2010) have focused on the porosity description. They used various investigative 94
techniques (XRD, SAXS/SANS, FIB/SEM, MIP), and from those results, we can schematically consider 95
the total porosity to be composed of pores of different sizes (Figure 1) such as the interlayer space, the 96
porosity between particles (inter-particle porosity) and the porosity between aggregates (inter-aggregate 97
porosity). The effect of hydration on microstructure has been described (Delage et al., 2006; Devineau 98
et al., 2006; Tang et al., 2011; Van Geet et al., 2005) but often only considering one or two porosity 99
levels, e.g. inter-aggregate and/or interlayer porosity. Globally, for sodium-dominated clays, hydration 100
leads to widening of interlayer spaces with an associated decrease in inter-aggregate porosity. Some 101
authors (Kozaki et al., 2001; Pusch and Yong, 2006; Tomioka et al., 2010) explain this process by the 102
formation of gel structure on the outer part of the particle/aggregate and/or by exfoliation of the particles 103
(Cui et al., 2002; Pusch, 1982). Indeed it has been observed that hydration leads to a decrease in the 104
number of layers per particle (Bérend et al., 1995; Perdrial and Warr, 2011; Saiyouri et al., 2004). 105
Hydration has consequences on clay microstructure organisation and pore distribution, and consequently 106
it also impacts materials’ mechanical properties, especially in confined or compacted conditions. In that 107
case, as macroscopic swelling is prevented, swelling pressure develops in the materials. Its amplitude is 108
again related to the nature of the exchangeable counterions and the ionic strength of the solutes, but also 109
to the material’s dry density. Some authors (Brackley, 1973; Gens et al., 2011; Imbert and Villar, 2006; 110
Pusch, 1982; Schanz and Tripathy, 2009) have shown that for samples with dry density of between 1.2 111
and 2.0 Mg/m3, swelling pressure behaviour upon wetting is non-monotonic. It reaches a peak, then falls 112
significantly and rises to a value that remains stable over time. Push (1982) suggested that this behaviour 113
could be related to the clay fabric being modified upon hydration. Validating this hypothesis remains 114
difficult as most of the microstructural studies are conducted either on samples submitted to a specific 115
preparation procedure (freeze drying, solvent exchange, etc.) that may have altered their fabric (Delage 116
et al., 2006; Holzer et al., 2010), or without any concomitant determination of materials’ macroscopic 117
6
mechanical properties (Van Geet et al., 2005). Most of the time microstructures are only observed once 118
the sample reached the final steady state, without intermediate observations between the beginning of 119
wetting and the final stage. 120
These kinds of experimental conditions limit the understanding of the relationships between fabric 121
modifications upon wetting and swelling pressure development but it has been established that this 122
mechanical behaviour is influenced by water uptake (Harjupatana et al., 2015) and induced 123
physicochemical phenomena occurring at different porosity scales: (1) interlayer, (2) inter-particle and 124
(3) inter-aggregate (Bérend et al., 1995; Laird, 2006; Madsen and Müller-Vonmoos, 1989; Perdrial and 125
Warr, 2011; Saiyouri et al., 2004). 126
In this context, the main objective of our study was to analyse the relationship between swelling pressure 127
development and the associated microstructure evolution induced by wetting. A new oedometer cell, 128
transparent to X-ray, was designed both to monitor swelling pressure over time and to visualise inter-129
aggregate porosity changes through X-ray micro-computed tomography (µCT), on a unique specimen. 130
During µCT, the mechanical constraint was kept on the sample, thus limiting disturbance related to its 131
preparation (e.g. sample decompaction, or sample dehydration). A commercially purified 132
montmorillonite was used to perform the experiments. Homo-ionic water solutions with two ionic 133
strengths and a polar organic solvent were considered to analyse the relative impact of osmotic and 134
crystalline swellings on the clay fabric and to tentatively relate microstructural changes to swelling 135
pressure development. 136
137
2 Material and methods
1382.1 Kunipia-G, Japanese swelling clay
139
A smectite provided by Kunimine Industries was used for this study (Table 1). This material, available 140
as Kunipia-G grade, is a highly pure montmorillonite (>95%) (Fukushima, 1984; Kozaki et al., 1999; 141
Sato, 2008; Sato et al., 1992; Wilson et al., 2004) and has among others the advantage of avoiding long 142
purification steps to remove secondary mineral phases. Powder X-ray diffraction (XRD) patterns 143
indicate traces of quartz and carbonates (Figure 2). Examination of the 060 band at 1.49 Å indicates that 144
7
Kunipia-G is a dioctahedral smectite. XRD patterns obtained on oriented preparations recorded in air-145
dried conditions after ethylene glycol solvation or after temperature increase (550°C) show that (i) the 146
basal spacing recorded in the air-dried state is compatible with a Na interlayer counterion, (ii) a 147
rationality of the 00l reflections (Figure 2a) proving the absence of illite/smectite mixed layered 148
minerals. The cation exchange capacity (CEC) determined by the chloride cobaltihexamine 149
displacement method (Orsini and Rémy, 1976) is 115 mequiv/100g with the following distribution of 150
exchangeable cations: Na 91%, Ca 8%, K 1.0%. The chemical formula, 151
Na0.41K0.01Ca0.04(Si3.92Al0.08)(Al1.51Mg0.37Fe0.12)010(OH)2,nH2O, derived from X-ray fluorescence 152
(XRF), is compatible with previous studies (Fukushima, 1984; Sato, 2008; Sato et al., 1992; Wilson et 153
al., 2004). The dry particle density of Kunipia-G is 2.71 Mg/m3. 154
The specific surface area determined from a nitrogen adsorption experiment using the BET equation 155
(Brunauer et al., 1938) is 42 m²/g, similar to the specific surface area (SSA) founded by Kozaki et al. 156
(1999). The water sorption isotherms (data not shown) have a typical shape for swelling clays and 157
particularly for Na-exchanged smectites, with two steps on the water adsorption curve (Cases et al., 158
1992). Considering the desorption branch of the water isotherm, and assuming that in this state all the 159
interlayers are accessible, applying BET formalism gives an estimated total surface area of around 524-160
660 m²/g. This estimation agrees with the ethyleneglycolmonoethylether (EGME) measurement (Kozaki 161
et al., 1999). 162
2.2 Experimental strategy: new tomographic oedometer to follow both
163
swelling pressure and inter-aggregate pore evolution
164
2.2.1 Tomographic oedometer cell features 165
A new oedometer device has been developed to continuously monitor swelling pressure during the 166
hydration process, and to image, at selected swelling stages, the specimen structure using X-ray micro-167
computed tomography (µCT) (Figure 3). The designed cell has been built with polyether ether ketone 168
(PEEK), which is a material with limited X-ray attenuation and that can sustain high swelling pressure 169
with very low deformation. TECAPEEK CF 30 grade, provided by Ensinger®, was used due to its 170
improved mechanical strength with 30% carbon fibre (Young’s modulus: 18.5 GPa, yield stress: 171
8
215 MPa). The cell is composed of three parts: a ring and two pistons. Compared to standard oedometer 172
cells, the sample diameter was reduced to 10 mm in order to obtain the best possible resolution taking 173
into account the shape and size constraints (distance of the sample relative to the X-ray source and to 174
the charge coupled device (CCD)). The initial sample height was set at 10 mm. The dimensions of the 175
complete device were adapted to the available space in the X-ray tomograph (Phoenix Nanotom). 176
Under these conditions, µCT images were recorded with a voxel size of 5 micrometres. 177
2.2.2 Simultaneous in situ measurement of both swelling pressure and sample 178
microstructure at the X-ray tomography scale 179
The cell was placed on a load frame to monitor sample swelling pressure. The solution was injected (50 180
kPa) at the lower side of the sample with a pressure-volume controller. All the tests were performed 181
under constant volume conditions. A closed-loop control kept the sample height constant, i.e. we had 182
constant volume conditions, by adjusting the vertical load exerted on the sample during the wetting. All 183
the experiments were conducted at a temperature of 20 ± 1.5 °C. Vacuum was imposed inside the pistons 184
before the beginning each test to avoid air bubbles being trapped at the base of the sample, or in the 185
lower piston. 186
An experimental protocol was defined to remove the cell from the loading frame to perform X-ray 187
tomography acquisition. It consisted in stopping fluid injection, screwing the cell to prevent any 188
volumetric sample deformation and placing the whole in the tomograph. The entire scanning process 189
lasted between 3 and 4 hours. In total, five points were selected at specific times on the swelling curve. 190
The impact of that protocol on material behaviour has been assessed and is discussed later in this paper. 191
2.2.3 Image processing and inter-aggregate porosity (at a 5 µm resolution scale) 192
extraction 193
Images were recorded using a Phoenix Nanotom tomography system and its 180 kV/20 W nanofocus 194
X-ray tube. Scans were performed at 80 kV and 75 µA with 2880 projections to cover 360° (angle step 195
of 0.125°). During X-ray tomography scans, the Coupled Charge Device (CCD) recorded the intensity I 196
of the X-ray beam passing through the specimen to reconstruct a 3D-volume after mathematical 197
reconstruction based on back-projection. 198
9
Each voxel of the reconstructed volume (8-bit) is characterized by its intensity value ranging on a 199
greyscale from 0 (black) to 255 (white), which is linked to the X-ray attenuation by the specimen: the 200
higher the attenuation, the higher the intensity, i.e. a solid medium (such as our Kunipia-G) has a higher 201
grey value than macropores. For each sample, a sub-volume of the same size (450 x 1400 x 1800 pixel3) 202
was extracted from the same position (Figure 4a). The aim was to reduce the amount of data we had to 203
analyse and to optimize the volume of interest (VOI). The VOIs are 9 mm tall (1800 pixels) excluding 204
0.5 mm at both ends of the sample because the conical shape of the beam means these parts are not 205
illuminated similarly to the rest of the sample. 206
The inter-aggregate porosity was quantified along the height of the specimen (z-profile) using an image 207
analysis procedure that was adapted to extract the pores from the solid skeleton of the 3D computed 208
volumes. Image quality was first enhanced by applying (i) a contrast and brightness adjustment 209
spreading the histogram and (ii) a classic Gaussian Blur 3D filter with a radius of 2 pixels to reduce 210
noise. To separate these pores from the surrounding clay matrix, the maximum gradient magnitude, 211
which is equivalent to the inflection point of the smooth intensity profile across the interface (due to the 212
insufficient resolution), was enhanced by optimizing the edge of the transition between pores and solid 213
grains. The sharp transition of the greyscale profile across the solid/pore interface was restored from the 214
actual smooth profile by using a local weighted filter. This sharpening filter does not transform the edge 215
position of the object but improves sharpness by increasing acutance (Sheppard et al., 2004). A 216
watershed algorithm (Vincent and Soille, 1991) was then used to separate the pore from the solid in the 217
gradient greyscale images. The watershed separations (markers belonging to the pores and solid) were 218
selected by identifying the slope change of the grey level histogram on its first derivative (Gaboreau et 219
al., 2016; Prêt et al., 2010a; Prêt et al., 2010b). The result of this segmentation at the initial dry state is 220
illustrated in Figure 4. 221
In addition, a morphological characterisation of the pore space distribution with pore size distribution 222
(PSD) was performed using a public domain software iMorph (http://imorph.fr/). The characterization 223
was done in five regions of interest (ROI) of same height (1.8 mm) along the z-profile from bottom to 224
top (ROI1 being close to the solvent inlet at the specimen bottom and, ROI5 at the top). 225
10
2.2.4 Comparison with standard constant volume oedometers 226
In order to validate the results obtained with the new tomographic oedometer cell, constant volume 227
oedometers were used to characterize the swelling behaviour of Kunipia-G specimens in standard 228
conditions. The basic principle of these devices is to allow sample hydration and to maintain the sample 229
at constant volume while measuring swelling pressure. On the lower side of the specimen, hydration 230
occurs by diffusion during the entire test duration, and the solution is renewed with a peristaltic pump. 231
The height of the sample in these devices was set at 10 mm for diameters of 50 mm or 34 mm. More 232
details on these standard oedometer cells are available in Cuisinier (2002). 233
2.3 Experimental procedure
234
2.3.1 Sample preparation and compaction 235
The dry density of the specimens compacted in the tomographic cell was set to 1.40 ± 0.02 Mg/m3, 236
corresponding to a theoretical total porosity ø of 48% according to the following equation: 237
ø = 1 − 𝜌𝜌𝜌𝜌𝑑𝑑
𝑠𝑠
1
where ρd is the dry density (Mg/m3) and ρs is the particle density (Mg/m3). 238
The specimens were statically compacted from a crushed and sieved dry Kunipia-G powder (~1 mm) 239
(oven-dried at 105 °C) at a speed of 1.14 mm/min, to the desired dry density. 240
2.3.2 Solvent selection 241
To assess the effect of the solvents on swelling pressure, two aqueous solutions (NaCl) at two different 242
ionic strengths (10-1 and 10-4 M) and an organic solvent (methyl methacrylate, MMA) were used. 243
Saturation with NaCl solutions was to evaluate the coupled development of crystalline and osmotic 244
swelling. In our case, at full saturation, considering the chosen dry density (1.4 Mg/m3), the intercalation 245
of two to three-water layers in the interlayer spaces is estimated (Holmboe et al., 2012; Villar et al., 246
2012), regardless of the ionic strength of the solution. Salt concentration is mainly expected to affect 247
osmotic phenomena. 248
MMA was also selected for its physical properties close to those of water (Table 2). MMA is widely 249
used to impregnate finely divided solids (Gaboreau et al., 2012; Gaboreau et al., 2011; Gaboreau et al., 250
2016; Prêt et al., 2010a; Prêt et al., 2010b; Prêt et al., 2004; Pusch and Schomburg, 1999; Sardini et al., 251
11
2009). Given its properties, impregnated MMA samples are described as mimicking a hydrated 252
microstructure (Prêt et al., 2010b; Pusch, 1999; Sammartino et al., 2002) with the intercalation of MMA 253
molecules in clay interlayer spaces (Prêt, 2003; Prêt et al., 2010b). Such behaviour is mainly due to 254
MMA’s low viscosity and its dipolar moment close to that of water. Indeed, MMA, like water, is a polar 255
molecule, so apparently leads to interlayer hydration (Blumstein et al., 1970; Tabtiang et al., 2000). A 256
smectite powder saturated with MMA displays basal spacing d001 of 17.2 Å (Blumstein, 1965; Prêt, 257
2003), characteristic of two layers of MMA in the interlayer, mainly though electrostatic dipole-ion 258
interaction with the ester functional group. This was confirmed by powder X-ray diffraction patterns of 259
Kunipia-G samples saturated with MMA (Figure 2b), where d001 was found to be 17.1 Å. This d001 260
value is equivalent to a hydration state between two and three water layers when hydration is performed 261
with water solutions. Moreover, no osmotic swelling is detected with MMA, while in the same XRD 262
acquisition conditions (free swelling in a huge solution volume) with a 10-3M NaCl solution, large basal 263
d001 spacings have been measured, corresponding to osmotic swelling leading to around 21 Å, equal to 264
four layers of water molecules (Holmboe et al., 2012; Michot et al., 2004). Further experiments 265
undertaken at the macroscopic scale showed that the interaction of MMA molecules with clay induced 266
swelling pressure in compacted clay specimens (Pusch, 1999). Therefore, using MMA was a good 267
means of assessing the swelling pressure and the porosity evolution mostly controlled by the influence 268
of the crystalline swelling component, as the osmotic pressure was hindered. 269
2.3.3 Measurement approach 270
First of all, experiments were conducted to validate the new oedometer tomographic cell. This was based 271
on comparing results obtained with standard oedometer cells, and literature data. The impact of sample 272
size and the tomography procedure were assessed. These experiments were conducted using NaCl 10-4 273
M solution. 274
Once the cell was validated, experiments were performed to characterise the impact of fluid features on 275
swelling pressure development and on the associated porosity reorganisation. Five experiments were 276
undertaken with compacted Kunipia-G specimens at dry density of 1.4 ± 0.02 Mg/m3 using the 277
tomographic cells. Two experiments were conducted with NaCl 10-4 M solutions and two others used 278
NaCl 10-1 M, the last run being acquired with MMA. For each run, X-ray tomography scans were 279
12
performed at the initial and final states. Intermediate scans were only performed for one specimen of 280
each NaCl ionic strength. In those cases, a first acquisition (t0) was performed just after compaction. 281
Four different scans (t1, t2, t3, t4) were performed to obtain intermediate hydrated states at particular 282
specific times on the swelling pressure curve. The last scan (t5) was performed once steady state 283
conditions were reached. Intermediate scans with MMA as wetting fluid were not conducted because of 284
the high kinetics of hydration process. 285
3 Results
2863.1 Assessment of the tomographic cell measurements
287
3.1.1 Comparison with standard oedometers 288
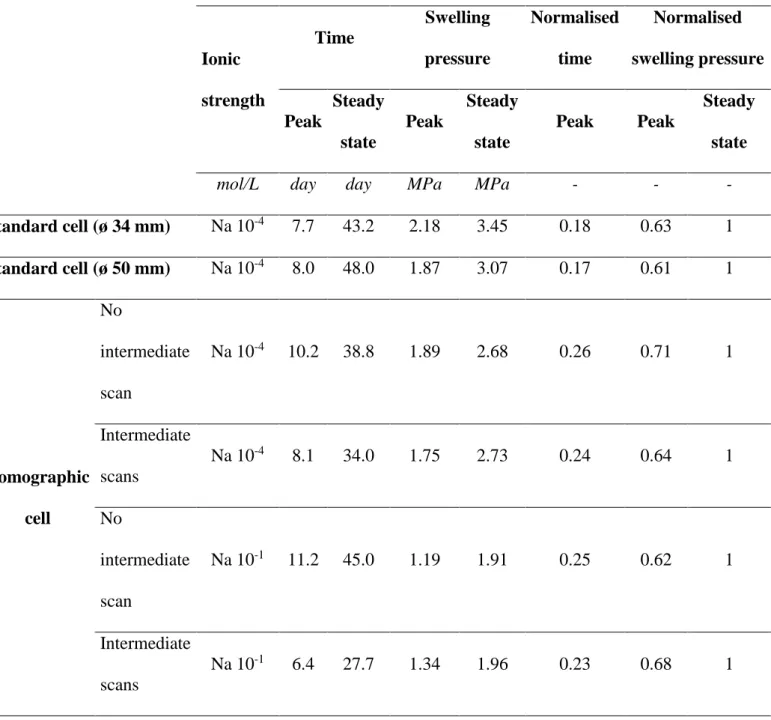
The swelling pressure measured over time and swelling pressure values at steady state for both the 289
standard oedometer cells and the new tomographic cell were compared. In this sub-section, all the 290
experiments were performed with NaCl 10-4 M solutions. Swelling pressure first developed a peak 291
reached after a few days (Table 3) and then a plateau (Figure 5a). After the peak, the swelling pressure 292
fell to around 10% of the peak value. Steady state conditions (second maximum value) were then 293
reached. Typically the first peak was obtained between 7.7 and 10.2 days while the steady state occurred 294
after 38 and 48 days. The first maximum was comprised between approximately 1.9 and 2.2 MPa while 295
the steady state values are comprised between 2.7 and 3.5 MPa. The first maximum typically occurred 296
at around 20% of the time needed to reach the steady state and corresponded to about 60% of the stable 297
swelling pressure value. In all cases, the swelling pressure curves obtained with the Kunipia-G hydrated 298
with NaCl 10-4 M solutions were typical of those described in the literature (Gens et al., 2011; Imbert 299
and Villar, 2006; Komine and Ogata, 2003; Pusch, 1982; Schanz and Tripathy, 2009). 300
The steady state values, i.e. at final stage of the test, were compared to existing literature data obtained 301
with two other types of clays, and to data obtained on Kunipia-G for densities ranging between 1.2 and 302
1.75 Mg/m3 (Table 3 and Figure 5b). At a dry density of 1.40 Mg/m3, the difference between swelling 303
pressure at peak and at steady state is limited whatever the specimen size (10, 34, 50 mm diameter with 304
tomographic, pressure and injection cell respectively). These results are in line with the study of Gens 305
et al. (2011), Komine et al. (2009), Imbert and Villar (2006) or Volckaert et al. (1996) working with 306
13
oedometer cells at different sample sizes. They demonstrated that the size of the sample, diameter rather 307
than height, modifies the kinetics of swelling pressure upon hydration (slower for longer specimens), 308
but does not significantly impact the magnitude of swelling pressure (difference at peak and at final 309
state). Based on these conclusions, a dimensionless representation of the curve displaying the swelling 310
pressure versus time has been used previously to facilitate sample comparison. The y-axis corresponds 311
to the ratio of swelling pressure to swelling pressure at the plateau and the x-axis is the ratio between 312
time to the time of peak occurrence. 313
3.1.2 Effect of intermediate tomography scans 314
The impact of intermediate tomography scans was assessed by comparing swelling pressure curves 315
determined in the new oedometer cell of specimens hydrated by 10-4 M and 10-1 M NaCl with and without 316
intermediate scans (Figure 6 and Table 3). Swelling pressure curves of samples subjected to tomography 317
scans fit well to the swelling pressure evolution of the test undertaken without tomography acquisition. 318
As described previously, swelling pressure evolution is non-monotonic: the peak swelling pressure 319
reached around 65% of the swelling pressure at steady state with or without intermediate scans. Slight 320
differences over time are observed for the specimen hydrated by NaCl 10-1 M solution. The kinetics of 321
swelling pressure over time of this specimen subjected to intermediate tomography scans were slightly 322
impacted by the intermediate scans, but the peak appearance was at 20% of the total time to reach the 323
plateau as it was with the other tests and the swelling pressure value at the peak is comparable (68% of 324
the final value). 325
Thus, the experimental procedure used to assess both swelling pressure and porosity with intermediate 326
scans has limited impacts on swelling pressure development in the compacted samples as a function of 327
time from the beginning of hydration. 328
3.2 Effect of fluid features on swelling pressure
329
3.2.1 NaCl hydration at various ionic strengths 330
The shapes of the swelling pressure curves for specimens hydrated with 10-1 M NaCl solutions (Figure 331
6) are similar to those recorded with 10-4 M NaCl solutions. The non-monotonic behaviour is also 332
observed, with a peak before reaching a stable plateau. The swelling pressure peak was observed at a 333
14
time equivalent to 20% of the time needed to reach the maximum, and the value corresponded to about 334
66% of the final pressure irrespective of ionic strength (Table 3). Nonetheless, we see (Figure 7) that 335
the higher the ionic strength, the lower the swelling pressure at peak and at steady state (30% lower with 336
Na 10-1 M than Na 10-4 M). These results, in accordance with previous studies (Karnland et al., 2006; 337
Karnland et al., 2007; Pusch, 1982), are related to the development of repulsion between the electrical 338
double layers whose thickness is reduced at higher ionic strength (Norrish, 1954; Santamarina et al., 339
2002). Consequently, the osmotic pressure also falls at higher ionic strength. 340
3.2.2 MMA hydration 341
With MMA injections, swelling pressure increases sharply over time, almost instantaneously, to reach 342
a plateau within a few minutes (Figure 7). The maximum swelling pressure value is significantly higher 343
(3.10 MPa) with MMA as hydrating fluid than those measured with 10-4 or 10-1 M NaCl solutions. The 344
experiment was stopped sooner than for the samples hydrated with NaCl solutions since the steady state 345
was reached after 15 days. The slight variations observed in steady state can be explained by the 346
sensitivity of MMA fluidity to slight temperature variations in the room (20°C±1°C). 347
3.3 Tomography results
348
The X-ray tomography images recorded for the Na 10-4 M specimen are displayed in Figure 8a. For 349
clarity, only four times were selected. The fabric observed in the initial state before the beginning of 350
hydration is an entangled multi-layered structure, characterized by darker zones that may be assigned to 351
pores. The pores are anisometric and ellipsoidal and the largest are some hundreds of microns long and 352
a few tens of microns wide. Pores are oriented with their biggest size perpendicular to the compaction 353
axis. This type of layered structure is uniformly distributed throughout the entire specimen. For the first 354
point visualized during hydration, which is in the rise of the curve before the peak (t1), some changes 355
are observed in the lower part of the image. The contrast between pores and the particles that separate 356
them is greatly reduced, giving an impression of a homogeneous structure. This lowest part of the 357
specimen is the one that is first hydrated by water. As hydration and swelling progress, this 358
homogeneous zone extends on the image, with some tenuous remaining traces of the initial status in the 359
15
upper part of the images recorded at t3 (minimum position after the peak) and then complete 360
homogenisation on the plateau (t5). 361
While the same porosity modification trends can be observed for the sample hydrated with the second 362
ionic strength (Figure 8b), the evolution is different with MMA. With MMA, due to the rapid increase 363
in swelling pressure, only the final state was imaged (Figure 8c). Wetting with MMA does not lead to 364
the homogenization observed with water. Contrasting zones remain, with a shape and orientation that 365
seem more isotropic than in the initial state. The distribution along the vertical axis is uniform, without 366
the gradients that were observed in the intermediate steps during water hydration. 367
To analyse µCT pictures further, an image pre-processing step (see section 2.2.3) was applied for 368
binarizing the images and extracting inter-aggregate porosity. The porosity as defined corresponds to 369
the areas that have sufficient contrast with respect to the clay matrix to be distinguished from it, and 370
have spatial resolution greater than 5 microns. For the initial states after compaction, the µCT porosity 371
calculated in this manner corresponds to 38-39% of the total volume of the specimen whose total 372
theoretical porosity is 48%. These results are very comparable to other swelling clay like the case of 373
MX-80 as shown by Gens et al. (2011) at the same dry density from MIP data (inter-aggregate porosity: 374
37%, total porosity: 48%). This means that the thresholding procedure is valid for estimating the inter-375
aggregate porosity, in agreement with results found in the literature and derived using other techniques 376
(MIP, nitrogen adsorption) on different swelling clays. 377
In addition, we deduce the inter-aggregate porosity evolution versus specimen height (Figure 9a and 378
Table 4). Initially, a slight inter-aggregate porosity gradient is observed along the vertical axis inside the 379
specimen. The inter-aggregate porosity increased from about 37% on the top up to more than 45% on 380
the bottom. Both ends are also slightly over-compacted. This is related to the compaction procedure, 381
and this effect has been well described in the case of compacted soils (Eslami, 2014; Tisot, 1974; Winter 382
and Clarke, 2002). These effects of the compaction procedure were comparable for all the samples 383
prepared in the context of that study. From morphological analysis (Table 5), the gradient is also 384
noticeable with a pore size reduction in the upper part of the sample (ROI 3 to 5). In this initial state, the 385
mean aperture radius is of 15.6 µm. 386
16
The µCT inter-aggregate porosity profiles derived at the intermediate stages of hydration with Na 10-4 387
M solution show that the swelling pressure development is associated with reduced inter-aggregate 388
porosity. For t1 and t2, this porosity decrease is not uniform along the specimen z-axis: the reduction is 389
much greater in the lower part of the specimen, i.e. close to the water inlet (from 45% in the initial state 390
to a few percent in the hydrated state), whereas less uniform inter-aggregate porosity reduction occurred 391
in the upper part of the sample (porosity is reduced by half for distances greater than 6 mm from the 392
inlet). Between these two zones a gradient was observed. On average, more than 75% of the inter-393
aggregate porosity volume was reduced when the first peak of swelling pressure was reached. At t3 the 394
inter-aggregate porosity distinguishable with µCT was lower than 3%, and this time corresponded to the 395
minimum swelling pressure reached after the first peak. The swelling pressure increased between t3 and 396
the final stage occurred without any major change to porosity profile except a slight decrease in the 397
mean value: the profiles display similar shapes at t3 and at the end of the test. The decrease of the 398
detected porosity is also combined to a reduction of the inter-aggregate pore size (Table 5). At t1 and 399
t2, the reduction of the inter-aggregate pore size is greater in the lower part of the specimen (mean 400
aperture radius around 8.0 µm) than in the upper part (mean aperture radius around 12.0 µm). At t3, no 401
difference is observed between lower and upper part with a mean aperture size of 8.0 µm. After t3, a 402
slight decrease of pore size is noticed (mean aperture size of 7.5 µm). 403
The impact of ionic strength is less obvious on the µCT porosity profiles (Figure 9b and Table 4) and 404
the pore morphology (data not shown) than on the swelling pressure values. 405
In the case of the sample hydrated with MMA, only the scans before and at the end of the tests were 406
performed. At the end, some macropores defined by a size larger than 5 µm and a contrast different from 407
the clay matrix, still remained, all over the specimen height (Figure 9c). A slight gradient was observed, 408
probably resulting from sample preparation. The average porosity was about 8%; this value was 409
significantly higher than the one derived after water hydration (Table 4). At this final state, the pore 410
morphology (Table 5) shows also the gradient with bigger pore size in the lower part (ROI1) than in the 411
upper part of the specimen (ROI5). The final state of the specimens hydrated by MMA is associated 412
with larger pores at 8.1 µm. 413
17
4 Discussion
415
Kunipia-G’s swelling pressure was monitored for two different solvents (sodium chloride and MMA). 416
In the case of NaCl, the ionic strength has been varied from 10-4 to 10-1 M. During swelling pressure 417
development, changes in the structure (inter-aggregate pores) were visualised using micro-tomography. 418
The main experimental observations are the following (Figure 10): 419
• in the case of MMA, the swelling pressure abruptly increases before levelling off. On the contrary, 420
for hydration with a NaCl solution, the swelling pressure first increases, reaches a local maximum, 421
then decreases and rises until reaching a plateau (Figure 7); 422
• for NaCl, the maximum value reached at the plateau is lower for the highest ionic strength, whereas 423
the shape of the swelling pressure curve does not depend on the salt concentration (Figure 7); 424
• a correlation exists between the fabric heterogeneities observed in the sample at the resolution of 425
tomographic scans (inter-aggregate pores) and the macroscopic evolution of the swelling pressure; 426
• although in the case of MMA it is still possible to detect some inter-aggregate porosity by X-ray 427
tomography at the apparatus’ resolution (5 µm) even on the steady state, for NaCl, whatever the ionic 428
strength, the inter-aggregate porosity has disappeared at the dip that appears after the swelling 429
pressure decreases and before it increases again (Figure 9). Nevertheless, in all the cases, the decrease 430
of inter-aggregate porosity is linked to an evolution of the initial anisotropic pore distribution with 431
the obvious development of pores with size lower than the resolution. 432
Some of these differences observed between samples hydrated by water solution or by MMA can be 433
explained by MMA’s properties. In particular its low viscosity and low surface tension (Table 2) 434
increase the wettability of the solvent injection in the sample and consequently the swelling pressure 435
kinetics. 436
The following discussion focused on the experimental results summarised above, aims at understanding 437
(i) the inter-aggregate porosity changes and (ii) the non-monotonic swelling pressure evolution with 438
peak occurrence. 439
18
4.1 Processes responsible for inter-aggregate porosity decrease
440
As already discussed in the introduction, the main processes that generally operate in concert to control 441
bentonite swelling in aqueous systems are crystalline (interlayer) swelling and osmotic swelling (both 442
double-layer at the inter-particle and the inter-aggregate level); the second process leading to break-up 443
the initial dry particles into thinner ones. Based on the work of Liu (2013), these two contributions can 444
be evaluated from its model for the Kunipia-G material used in this study (Figure 11a). Whereas the 445
crystalline pressure is empirically related by an exponential law (see equation 26 and the related one in 446
Liu (2013)) to the length of the diffuse double layer (DDL) between two montmorillonite particles 447
(reflecting the decay of the hydration forces as the distance increases), the osmotic pressure can be 448
derived by applying the Gouy-Chapman theory according to the following equation issued from Liu 449
(2013). 450
PDDL = 2cRT(cosh ym-1) 2
Where c is the ionic concentration of the pore solution in mol/m3, R is the gas constant, T is the absolute 451
temperature in Kelvin and ym is the scaled midplane potential at the midpoint between unit layers. 452
In this approach, an important parameter, the Deybe length, which can be considered as an estimate of 453
the double layer thickness, has to be used. The Debye length is square root dependent on the relative 454
dielectric constant of the pore solution. Considering that MMA’s relative dielectric constant is about 12 455
times lower than water’s (6.32 versus 78.54, see Table 2), calculation shows (Figure 11b) that for a dry 456
density of 1.4 Mg/m3, the osmotic pressure developed with MMA is one order of magnitude lower than 457
that obtained with water (NaCl, both 10-4 and 10-1 M), reaching a negligible pressure (0.4 MPa) 458
compared to the total pressure measured (3 MPa). 459
The first conclusion that can be derived from this simple calculation is that in the case of MMA the main 460
process that operates is crystalline swelling. The second is that, in the case of sodium chloride solution, 461
the calculated osmotic pressure is approximately 2.65 MPa for ionic strength of 10-4 M and 2.16 for 10 -462
1 M. These values are very close to the values that are measured during our experiment after reaching a 463
steady state (Figure 7 and Figure 11b). Introducing crystalline pressure into the calculation of total 464
swelling pressure slightly increases this value, and strongly suggests that for saline solutions, the main 465
19
contribution at the working density is given by osmotic processes (Figure 11a and b). In the case of 466
MMA, crystalline pressure cannot be calculated because no isotherm data are available with MMA but 467
it contributes mainly to the total swelling pressure as the osmotic component is negligeable (Figure 11b). 468
Hydration of Kunipia-G specimens by saline solutions induces particle breakup due to osmotic 469
component with major aggregate reorganisation. This could explain partly the inter-aggregate porosity 470
reduction seen by µCT (Figure 8a and b). In contrast, for specimens hydrated by MMA, only crystalline 471
swelling occurs which does not lead to particle breakup, probably explaining the slighter inter-aggregate 472
porosity decrease observed by µCT (Figure 8c). The assumption made concerning particle breakup 473
leading to inter-aggregate filling is confirmed by literature results (Perdrial and Warr, 2011; Saiyouri et 474
al., 2004), nevertheless further investigations at lower scale (FIB/SEM, TEM) may ensure that (currently 475
conducted). 476
477
4.2 Explanation of peak occurrence
478
Several assumptions have been made to describe the non-monotonic swelling behaviour of smectite-479
rich material related to inter-aggregate pore evolution. For instance, Pusch (1982) related the swelling 480
pressure peak to the formation of gel structures upon wetting that modify the mechanical characteristics 481
of aggregates/particles (shear strength) and decrease the swelling pressure. This has been integrated by 482
Alonso et al. (1999) in the Barcelona Expansive Model (BExM), with the progressive reorganisation of 483
the internal structure of samples upon wetting. Progressive filling of the macrostructure (inter-aggregate 484
void ratio decrease) occurred. Gens et al. (2011) modelled this process, based on tests performed on 485
FoCa clay compacted at 1.45 Mg/m3. They showed that the modelled non-monotonic swelling pressure 486
is linked to the modelled reorganisation of inter-aggregate porosity. This reorganisation is progressive 487
upon wetting with remaining inter-aggregate porosity of 25% at the end of the test. Figure 12 shows that 488
the kinetics of observed inter-aggregate porosity decrease of our Kunipia-G’s specimen wetted by NaCl 489
10-4 M agree with the evolution of the FoCa clay at different specimen heights (lower, middle and upper 490
part). Nevertheless the extent of the porosity decrease is different, with almost total filling of the inter-491
aggregate porosity with the Kunipia-G sample. A possible explanation for this difference may be linked 492
20
to the difference in mineralogy of both materials. FoCa is only made of 45% swelling clay, the remaining 493
mineral being kaolinite, whereas Kunipia-G contains 95% of smectite. Another explanation could be 494
relied to the BBM definition with the interaction function between microstructure elastic deformation 495
and macrostructure plastic deformation. 496
Thus, from our results and the above comparison with BExM model, we can suppose the non-monotonic 497
behaviour with peak occurrence is related to the progressive inter-aggregate porosity reorganisation. 498
This may be linked directly to the particle-solvent interaction introduced previously in the discussion, 499
in other words to the crystalline and osmotic swellings. 500
Regarding hydration processes, Wang et al. (2013) conducted wetting experiments on a specimen 501
composed of a 7/3 MX80/quartz dry mass mixture to assess the evolution of the relative humidity versus 502
specimen height. They concluded that specimens hydrated by aqueous solutions are not subject to the 503
same water transfer between the lower part in contact with fluid and the upper part. Liquid water transfer 504
occurs in the lower part whereas above the hydration front vapour water transfer prevails (Pusch and 505
Yong, 2003). Moreover, Ichikawa et al. (2004) have followed the change in d spacing with an in situ 506
XRD apparatus called a 1-D consolidometer for a dry density of 1.4 Mg/m3 and loading of 1.9 MPa 507
(close to the measured swelling pressure in our experiment). They have described two consolidation 508
stages. Firstly, external pore water is drained, and the state of three water layers’ hydration causes a 509
large displacement; secondly two water layers of hydration are detected, increasing with time; and 510
finally in the final stage the water layers of hydration remain constant while the displacement is still 511
increasing. In this latter stage the interlayer water is drained. In the case of MMA the intercalated layers 512
are always limited to two, leading to basal spacing mimicking 2-3 water layers. Like vapour water 513
hydration (Tang et al., 2011), the intercalation of two MMA molecule layers into the interlayer spacing 514
(Figure 2b) leads to swelling of particles filling up the inter-particle porosity with limited closure of 515
inter-aggregate porosity. Such swelling development without the momentary decrease of swelling 516
pressure over time has been also observed under RH regimes when particle swells without total inter-517
aggregate porosity filling (Likos and Wayllace, 2010; Tang et al., 2011). Instead of microstructure 518
reorganisation in between the aggregates, the intercalation of water layers inside and between particles 519
leads to their swelling, which fills up the inter-aggregate pores. Depending on the ionic strength this 520
21
particle reorganisation can be described as gel formation with the exfoliation of particles situated on the 521
outer surface of the aggregates (Kozaki et al., 2001; Pusch and Yong, 2006; Tomioka et al., 2010). We 522
should note that this explanation only stands for monovalent cations, and solutions with low ionic 523
strength. 524
Considering these data, osmotic component (PDDL) is mainly the physical driving force leading to the 525
reorganization of the microstructure and cumulative mechanisms are responsible for the non-monotonic 526
swelling pressure evolution upon hydration. Visualising the structure by tomography corroborates the 527
assumption of reorganization already made, mainly when osmotic phenomena may develop. 528
Unfortunately, the spatial resolution of this technique does not allow qualifying or quantifying this new 529
arrangement at a smaller scale. 530
531
5 Conclusion
532In this study, the specific experimental procedure conducted with a newly designed innovative 533
oedometer allowed us to assess the evolution of swelling pressure and inter-aggregate porosity upon 534
hydration at the same time (and for the first time as far as we know). From X-ray tomography scans and 535
image post-processing, we can correlate between both parameters. The inter-aggregate porosity 536
diminished from the start of the test until the minimum after the peak is reached. Then, water 537
redistribution inside the structure leads to reaching a stable swelling pressure. Moreover, controlling the 538
swelling pressure at a particle scale via the use of various fluids (NaCl at two ionic strengths and MMA) 539
aimed to differentiate between the impact of crystalline swelling and osmotic swelling on swelling 540
pressure development. Two behaviours of swelling pressure developments were observed according to 541
the different solvents with non-monotonic and monotonic evolutions according to saline solutions and 542
MMA inlets, respectively. Because this non-monotonic behaviour is not seen with MMA, where 543
calculation has shown that the osmotic pressure is negligible (crystalline contribution), the non-544
monotonic swelling pressure development was found to be due to the osmotic pressure under the 545
hydration front of the compacted sample, leading to reorganisation of the microstructure with filling of 546
part of the inter-aggregate porosity; combined phenomena could be both responsible for the drop in 547
22
swelling pressure. A comparison with the BExM model shows a similar correlation between swelling 548
pressure and inter-aggregate porosity reorganisation upon wetting. 549
Further investigations performed on a smaller scale (from µm to nm) will allow assessment of the inter-550
aggregate pores of size smaller than 5 µm and the number of layers per particle at full saturation in 551
compacted samples and will lead both to improvement in how we understand our system and to 552
connections across the different scales. 553
Acknowledgments
554The work was conducted within the framework of an InterCarnot thesis (ICEEL-BRGM). We are deeply 555
grateful for the support of the NEEDS MIPOR consortium (CNRS, ANDRA, CEA, EDF, BRGM) and 556
that of Région Lorraine. 557
We thank C. Morlot for his participation in microtomography measurements performed at 558
GEORESSOURCES (UMR 7359, CNRS-Université de Lorraine). We thank F. Demeurie, J-Y. Morel 559
and the LEMTA’s engineering team for their help in experimental device development. We thank F. 560
Villieras, J. F. L. Duval, Z.G. Yigzaw, C. Chiaberge and C. Tournassat for fruitful and stimulating 561
discussions. 562
23
Alonso, E.E., Vaunat, J., Gens, A., 1999. Modelling the mechanical behaviour of expansive clays. 564
Engineering Geology 54, 173-183. 565
Bérend, I., Cases, J.M., François, M., Uriot, J.P., Michot, L., Masion, I.A., Thomas, F., 1995. 566
Mechanism of adsorption and desorption of water vapor by homoionic montmorillonites: 2. The Li+, 567
Na+, K+, Rb+ and Cs+ - exchanged forms. Clays and Clay Minerals 43, 324-336. 568
Bergaya, F., Lagaly, G., 2013. Handbook of clay science. Newnes. 569
Bihannic, I., Delville, A., Demé, B., Plazanet, M., Villiéras, F., Michot, L., 2009. Clay Swelling: New 570
Insights from Neutron-Based Techniques, in: Liang, L., Rinaldi, R., Schober, H. (Eds.), Neutron 571
Applications in Earth, Energy and Environmental Sciences. Springer US, pp. 521-546. 572
Bihannic, I., Tchoubar, D., Lyonnard, S., Besson, G., Thomas, F., 2001. X-Ray Scattering Investigation 573
of Swelling Clay Fabric: 1. The Dry State. Journal of Colloid and Interface Science 240, 211-218. 574
Blumstein, A., 1965. Polymerization of adsorbed monolayers. I. Preparation of the clay–polymer 575
complex. Journal of Polymer Science Part A: General Papers 3, 2653-2664. 576
Blumstein, A., Malhotra, S.L., Watterson, A.C., 1970. Polymerization of monolayers. V. Tacticity of 577
the insertion poly(methyl methacrylate). Journal of Polymer Science Part A-2: Polymer Physics 8, 1599-578
1615. 579
Brackley, I., 1973. Swell pressure and free swell in compacted clay, 3rd International Conference of 580
Expansive Soils. National Building Research Institute, Council for Scientific and Industrial Research, 581
Haifa, pp. 169-176. 582
Brunauer, S., Emmett, P.H., Teller, E., 1938. Adsorption of gases in multimolecular layers. Journal of 583
the American Chemical Society 60, 309-319. 584
Cases, J.M., Berend, I., Besson, G., Francois, M., Uriot, J.P., Thomas, F., Poirier, J.E., 1992. Mechanism 585
of adsorption and desorption of water vapor by homoionic montmorillonite. 1. The sodium-exchanged 586
form. Langmuir 8, 2730-2739. 587
Chapman, D.L., 1913. A contribution to the theory of electrocapillarity. The London, Edinburgh, and 588
Dublin Philosophical Magazine and Journal of Science 25, 475-481. 589
24
Cui, Y., Loiseau, C., Delage, P., 2002. Microstructure changes of a confined swelling soil due to suction 590
controlled hydration, Proceedings of the 3rd International Conference on Unsaturated Soils (UNSAT 591
2002), Recife, Brésil. Sous la direction de J. FT Jucá, TMP de Campos et FAM Marinho, pp. 593-598. 592
Cuisinier, O., 2002. Comportement hydromécanique des sols gonflants compactés. Institut National 593
Polytechnique de Lorraine-INPL. 594
Delage, P., Marcial, D., Cui, Y., Ruiz, X., 2006. Ageing effects in a compacted bentonite: a 595
microstructure approach. Géotechnique 56, 291-304. 596
Devineau, K., Bihannic, I., Michot, L., Villiéras, F., Masrouri, F., Cuisinier, O., Fragneto, G., Michau, 597
N., 2006. In situ neutron diffraction analysis of the influence of geometric confinement on crystalline 598
swelling of montmorillonite. Applied Clay Science 31, 76-84. 599
Di Maio, C., 1996. Exposure of bentonite to salt solution: osmotic and mechanical effects. Géotechnique 600
46, 695-707. 601
Di Maio, C., Santoli, L., Schiavone, P., 2004. Volume change behaviour of clays: the influence of 602
mineral composition, pore fluid composition and stress state. Mechanics of Materials 36, 435-451. 603
Eslami, H., 2014. Comportement thermo-hydromécanique des sols au voisinage des géo-structures 604
énergétiques. 605
Ferrage, E., Lanson, B., Sakharov, B.A., Drits, V.A., 2005. Investigation of smectite hydration 606
properties by modeling experimental X-ray diffraction patterns: Part I. Montmorillonite hydration 607
properties. American Mineralogist 90, 1358-1374. 608
Fukushima, Y., 1984. X-ray diffraction study of aqueous montmorillonite emulsions. CLAYS CLAY 609
MINER. Clays Clay Miner. 32, 320. 610
Gaboreau, S., Lerouge, C., Dewonck, S., Linard, Y., Bourbon, X., Fialips, C.I., Mazurier, A., Pret, D., 611
Borschneck, D., Montouillout, V., Gaucher, E.C., Claret, F., 2012. In-situ interaction of cement paste 612
and shotcrete with claystones in a deep disposal context. American Journal of Science 312, 314-356. 613
Gaboreau, S., Prêt, D., Tinseau, E., Claret, F., Pellegrini, D., Stammose, D., 2011. 15 years of in situ 614
cement–argillite interaction from Tournemire URL: Characterisation of the multi-scale spatial 615
heterogeneities of pore space evolution. Applied Geochemistry 26, 2159-2171. 616
25
Gaboreau, S., Robinet, J.-C., Prêt, D., 2016. Optimization of pore-network characterization of a 617
compacted clay material by TEM and FIB/SEM imaging. Microporous and Mesoporous Materials 224, 618
116-128. 619
Gens, A., Valleján, B., Sánchez, M., Imbert, C., Villar, M., Van Geet, M., 2011. Hydromechanical 620
behaviour of a heterogeneous compacted soil: experimental observations and modelling. Géotechnique 621
61, 367-386. 622
Gouy, G., 1917. Sur la fonction électrocapillaire. Ann. Phys.(Paris) 7, 129-184. 623
Gouy, M., 1910. Sur la constitution de la charge electrique a la surface d'un electrolyte. J. Phys. Theor. 624
Appl. 9, 457-468. 625
Harjupatana, T., Alaraudanjoki, J., Kataja, M., 2015. X-ray tomographic method for measuring three-626
dimensional deformation and water content distribution in swelling clays. Applied Clay Science 114, 627
386-394. 628
Holmboe, M., Wold, S., Jonsson, M., 2012. Porosity investigation of compacted bentonite using XRD 629
profile modeling. Journal of contaminant hydrology 128, 19-32. 630
Holzer, L., Münch, B., Rizzi, M., Wepf, R., Marschall, P., Graule, T., 2010. 3D-microstructure analysis 631
of hydrated bentonite with cryo-stabilized pore water. Applied Clay Science 47, 330-342. 632
Ichikawa, Y., Kawamura, K., Theramast, N., Kitayama, K., 2004. Secondary and tertial consolidation 633
of bentonite clay: consolidation test, molecular dynamics simulation and multiscale homogenization 634
analysis. Mechanics of Materials 36, 487-513. 635
Imbert, C., Villar, M.V., 2006. Hydro-mechanical response of a bentonite pellets/powder mixture upon 636
infiltration. Applied Clay Science 32, 197-209. 637
Karnland, O., Birgersson, M., Hedström, M., 2011. Selectivity coefficient for Ca/Na ion exchange in 638
highly compacted bentonite. Physics and Chemistry of the Earth, Parts A/B/C 36, 1554-1558. 639
Karnland, O., Nilsson, U., Weber, H., Wersin, P., 2008. Sealing ability of Wyoming bentonite pellets 640
foreseen as buffer material – Laboratory results. Physics and Chemistry of the Earth, Parts A/B/C 33, 641
Supplement 1, S472-S475. 642
Karnland, O., Olsson, S., Nilsson, U., 2006. Mineralogy and sealing properties of various bentonites and 643
smectite-rich clay materials. SKB Stockholm. 644
26
Karnland, O., Olsson, S., Nilsson, U., Sellin, P., 2007. Experimentally determined swelling pressures 645
and geochemical interactions of compacted Wyoming bentonite with highly alkaline solutions. Physics 646
and Chemistry of the Earth, Parts A/B/C 32, 275-286. 647
Kaufhold, S., Baille, W., Schanz, T., Dohrmann, R., 2015. About differences of swelling pressure — 648
dry density relations of compacted bentonites. Applied Clay Science 107, 52-61. 649
Keller, L.M., Schuetz, P., Erni, R., Rossell, M.D., Lucas, F., Gasser, P., Holzer, L., 2013. 650
Characterization of multi-scale microstructural features in Opalinus Clay. Microporous and Mesoporous 651
Materials 170, 83-94. 652
Kjellander, R., Marčelja, S., Quirk, J.P., 1988. Attractive double-layer interactions between calcium clay 653
particles. Journal of Colloid and Interface Science 126, 194-211. 654
Komine, H., Ogata, N., 1994. Experimental study on swelling characteristics of compacted bentonite. 655
Canadian Geotechnical Journal 31, 478-490. 656
Komine, H., Ogata, N., 1996. Prediction for swelling characteristics of compacted bentonite. Canadian 657
Geotechnical Journal 33, 11-22. 658
Komine, H., Ogata, N., 2003. New equations for swelling characteristics of bentonite-based buffer 659
materials. Canadian Geotechnical Journal 40, 460-475. 660
Komine, H., Yasuhara, K., Murakami, S., 2009. Swelling characteristics of bentonites in artificial 661
seawater. Canadian Geotechnical Journal 46, 177-189. 662
Kozaki, T., Sato, Y., Nakajima, M., Kato, H., Sato, S., Ohashi, H., 1999. Effect of particle size on the 663
diffusion behavior of some radionuclides in compacted bentonite. Journal of Nuclear Materials 270, 664
265-272. 665
Kozaki, T., Suzuki, S., Kozai, N., Sato, S., Ohashi, H., 2001. Observation of Microstructures of 666
Compacted Bentonite by Microfocus X-Ray Computerized Tomography (Micro-CT). Journal of 667
Nuclear Science and Technology 38, 697-699. 668
Laird, D.A., 2006. Influence of layer charge on swelling of smectites. Applied Clay Science 34, 74-87. 669
Laird, D.A., Shang, C., Thompson, M.L., 1995. Hysteresis in Crystalline Swelling of Smectites. Journal 670
of Colloid and Interface Science 171, 240-245. 671
27
Likos, W.J., Wayllace, A., 2010. Porosity evolution of free and confined bentonites during interlayer 672
hydration. Clays and Clay Minerals 58, 399-414. 673
Liu, L., 2013. Prediction of swelling pressures of different types of bentonite in dilute solutions. Colloids 674
and Surfaces A: Physicochemical and Engineering Aspects 434, 303-318. 675
Lloret, A., Villar, M.V., Sanchez, M., Gens, A., Pintado, X., Alonson, E.E., 2003. Mechanical behaviour 676
of heavily compacted bentonite under high suction changes. Géotechnique 53, 27-40. 677
Madsen, F.T., Müller-Vonmoos, M., 1989. The swelling behaviour of clays. Applied Clay Science 4, 678
143-156. 679
Meleshyn, A., Bunnenberg, C., 2005. The gap between crystalline and osmotic swelling of Na-680
montmorillonite: A Monte Carlo study. The Journal of Chemical Physics 122, 034705. 681
Michot, L.J., Bihannic, I., Porsch, K., Maddi, S., Baravian, C., Mougel, J., Levitz, P., 2004. Phase 682
diagrams of Wyoming Na-montmorillonite clay. Influence of particle anisotropy. Langmuir 20, 10829-683
10837. 684
Michot, L.J., Bihannic, I., Thomas, F., Lartiges, B.S., Waldvogel, Y., Caillet, C.l., Thieme, J., Funari, 685
S.r.S., Levitz, P., 2013. Coagulation of Na-montmorillonite by inorganic cations at neutral pH. A 686
combined transmission X-ray microscopy, small angle and wide angle X-ray scattering study. Langmuir 687
29, 3500-3510. 688
Norrish, K., 1954. The swelling of montmorillonite. Discussions of the Faraday Society 18, 120-134. 689
Orsini, L., Rémy, J., 1976. The use of the chloride of cobaltihexamine for the simultaneous 690
determination of the exchange capacity and exchangeable bases in soils. Sci. Sol 4, 269-275. 691
Perdrial, J.N., Warr, L.N., 2011. Hydration behavior of MX80 bentonite in a confined-volume system: 692
implications for backfill design. Clays and Clay Minerals 59, 640-653. 693
Prêt, D., 2003. Nouvelles méthodes quantitatives de cartographie de la minéralogie et de la porosité dans 694
les matériaux argileux : application aux bentonites compactées des barrières ouvragées. Université de 695
Poitiers, Poitiers, pp. [9]-242-[220] p. 696
Prêt, D., Sammartino, S., Beaufort, D., Fialin, M., Sardini, P., Cosenza, P., Meunier, A., 2010a. A new 697
method for quantitative petrography based on image processing of chemical element maps: Part II. 698
Semi-quantitative porosity maps superimposed on mineral maps, American Mineralogist, p. 1389. 699
28
Prêt, D., Sammartino, S., Beaufort, D., Meunier, A., Fialin, M., Michot Laurent, J., 2010b. A new 700
method for quantitative petrography based on image processing of chemical element maps: Part I. 701
Mineral mapping applied to compacted bentonites, American Mineralogist, p. 1379. 702
Prêt, D., Sardini, P., Beaufort, D., Zellagui, R., Sammartino, S., 2004. Porosity distribution in a clay 703
gouge by image processing of 14C-PolyMethylMethAcrylate (14C-PMMA) autoradiographs:: Case 704
study of the fault of St. Julien (Basin of Lodève, France). Applied Clay Science 27, 107-118. 705
Pusch, R., 1982. Mineral-water interactions and their influence on the physical behavior of highly 706
compacted Na bentonite. Canadian Geotechnical Journal 19, 381. 707
Pusch, R., 1999. Experience from preparation and investigation of clay microstructure. Engineering 708
Geology 54, 187-194. 709
Pusch, R., Schomburg, J., 1999. Impact of microstructure on the hydraulic conductivity of undisturbed 710
and artificially prepared smectitic clay. Engineering Geology 54, 167-172. 711
Pusch, R., Yong, R., 2003. Water saturation and retention of hydrophilic clay buffer—microstructural 712
aspects. Applied Clay Science 23, 61-68. 713
Pusch, R., Yong, R.N., 2006. Microstructure of smectite clays and engineering performance. CRC Press. 714
Rinnert, E., Carteret, C., Humbert, B., Fragneto-Cusani, G., Ramsay, J.D., Delville, A., Robert, J.-L., 715
Bihannic, I., Pelletier, M., Michot, L.J., 2005. Hydration of a synthetic clay with tetrahedral charges: a 716
multidisciplinary experimental and numerical study. The Journal of Physical Chemistry B 109, 23745-717
23759. 718
Saiyouri, N., Tessier, D., Hicher, P.Y., 2004. Experimental study of swelling in unsaturated compacted 719
clays. Clay Minerals 39, 469-479. 720
Sammartino, S., Siitari-Kauppi, M., Meunier, A., Sardini, P., Bouchet, A., Tevissen, E., 2002. An 721
Imaging Method for the Porosity of Sedimentary Rocks: Adjustment of the PMMA Method--Example 722
of a Characterization of a Calcareous Shale. Journal of Sedimentary Research 72, 937-943. 723
Santamarina, J., Klein, K., Palomino, A., Guimaraes, M., 2002. Micro-scale aspects of chemical-724
mechanical coupling–interparticle forces and fabric. Chemical Behaviour: Chemo-Mechanical Coupling 725
from Nano-Structure to Engineering Applications, 47-64. 726
![[PDF] Formation d’initiation à la conception objet et au langage C++ | Cours informatique](data:image/gif;base64,R0lGODlhAQABAIAAAP///wAAACH5BAEAAAAALAAAAAABAAEAAAICRAEAOw==)