HAL Id: hal-01524164
https://hal.archives-ouvertes.fr/hal-01524164
Submitted on 17 May 2017HAL is a multi-disciplinary open access archive for the deposit and dissemination of sci-entific research documents, whether they are pub-lished or not. The documents may come from teaching and research institutions in France or abroad, or from public or private research centers.
L’archive ouverte pluridisciplinaire HAL, est destinée au dépôt et à la diffusion de documents scientifiques de niveau recherche, publiés ou non, émanant des établissements d’enseignement et de recherche français ou étrangers, des laboratoires publics ou privés.
UV Spectroscopy of DNA Duplex and Quadruplex
Structures in the Gas Phase
Frédéric Rosu, Valérie Gabelica, Edwin de Pauw, Rodolphe Antoine, Michel
Broyer, Philippe Dugourd
To cite this version:
Frédéric Rosu, Valérie Gabelica, Edwin de Pauw, Rodolphe Antoine, Michel Broyer, et al.. UV Spectroscopy of DNA Duplex and Quadruplex Structures in the Gas Phase. Journal of Physical Chemistry A, American Chemical Society, 2012, 116 (22), pp.5383-5391. �10.1021/jp302468x�. �hal-01524164�
This document is the Accepted Manuscript version of a Published Work that appeared in final form in the Journal of Physical Chemistry A, copyright © American Chemical Society after peer review and technical editing by the publisher. To access the final edited and published work see
http://dx.doi.org/10.1021/jp302468x
UV Spectroscopy of DNA Duplex and Quadruplex
Structures in the Gas Phase
Frédéric Rosu*, Valérie Gabelica, Edwin De Pauw, Rodolphe Antoine, Michel Broyer, Philippe Dugourd*.
†Département de Chimie, Université de Liège, Building B6c, 3, allée de la chimie, 4000 Liège, Belgium ‡CNRS and Université Lyon 1, UMR5579, Boulevard du 11 novembre 1918, 69622 Villeurbanne,
France * [email protected] [email protected]
ABSTRACT
UV absorption spectroscopy is one of the most widely used methods to monitor nucleic acid folding in solution, but the absorption readout is the weighted average contribution of all species present in solution. Mass spectrometry, on the other hand, is able to separate constituents of the solution based on their mass, but methods to probe the structure of each constituent are needed. Here we explored whether gas-phase UV spectroscopy can give an indication of DNA folding in ions isolated by electrospray mass spectrometry. Model DNA single strands, duplexes and G-quadruplex were extracted from solution by electrospray; the anions were stored in a quadrupole ion trap and irradiated by a tunable laser to obtain the UV action spectra of each complex. We found that the duplex and quadruplex spectra are significantly different from the single strands spectra, thereby suggesting that electronic spectroscopy can be used to probe DNA gas phase structure and obtain information about the intrinsic properties of high order DNA structure.
KEYWORDS: Duplex DNA • G-Quadruplex DNA • ion spectroscopy • electrospray • mass spectrometry. TITLE RUNNING HEAD: DNA Spectroscopy.
MANUSCRIPT TEXT
1. Introduction
UV absorption spectroscopy is one of the most widely used methods to monitor nucleic acid folding and unfolding transitions in solution. The formation of a Watson-Crick double helix from single strands is accompanied by a decrease in the absorbance between 220 and 300 nm (hypochromism).1,2 In contrast,
the formation of G-quadruplex DNA structures, where guanines are assembled in stacked G-quartets, is accompanied by an increase in absorbance at 295 nm and a decrease of the absorbance between 220 and 280 nm.3 Although the molecular origins of these spectral changes are not fully understood, it is clear that
the UV spectrum is sensitive to the base environment, and depends on the formation and orientation of the hydrogen bonds and on base stacking in the folded structure.4
Understanding the photoreactivity of nucleic acids is of fundamental importance to elucidate photodamage processes leading to nucleic acids mutations. In solution, Watson-Crick double helices have short excited states lifetime (depending on the detection wavelength from several picoseconds5,6 to
nanoseconds for GC-rich double helix7,8), which explain the relative stability of the DNA against UV
radiation. Conformational motions of the DNA strands and the solvent modulate the lifetime of the excited states9-11 Despite all of these information, the nature and the relaxation of the excited states of nucleic
acids are still a matter of debate. UV spectroscopy could be used to probe the higher-order structure of nucleic acid complexes produced by soft ionization mass spectrometry and understand intrinsic effects of structuration on optical properties.
With the introduction of electrospray ionization (ESI), mass spectrometry has become a versatile tool in biomolecule analysis. In parallel with the development of mass spectrometers themselves, several approaches were proposed to go beyond the determination of the mass and get some insight into the structure of biomolecules. These can be solution phase approaches like chemical or isotopic labeling,12
but as there is now increasing evidence that elements of secondary, tertiary and quaternary structure can also be conserved in the ions produced by electrospray sources,13-18 gas-phase approaches that probe the
structure of ions directly in the mass spectrometer are also being developed. Such gas-phase approaches include ion mobility spectrometry,19 gas-phase H/D exchange,20 native ECD,21 and ion spectroscopy.22-26
To date, phase electronic spectroscopy on large biomolecules has been less widely used than gas-phase vibrational spectroscopy for the investigation of ion structure. The success of IR spectroscopy is partly due to the interpretation procedure based on the comparison of experimental data with vibrational mode calculations, which are relatively affordable on small systems. The infrared (IR) spectra of large DNA systems however have to be interpreted by combining carefully chosen control experiments with calculations on smaller DNA single strand or structure. For example, it is known that the G-quadruplex [(TG4T)4•(NH4)3]5- retains its rigid solution-phase structure in the gas phase,27,28 and the single strand
dTG4T can be used as a control. The infrared signature (IRMPD) of G-Quadruplexes in the gas phase
revealed that H-bonding between guanines is preserved.29 Other DNA structure like i-motif is also
preserved in the gas phase and their IR spectra have been attributed using control experiments and DFT calculations.30
On the other hand, the calculation of electronic spectra, even for simple chromophores in the absence of solvent, still remains a challenge,31 and the field would clearly benefit from the input of experimental
spectra that would serve as benchmarks for calculations. Like in solution, gas-phase UV-visible spectroscopy would potentially provide information on the environment of chromophore included in structurally defined peptide,32,33 protein,34-36 or duplex DNA,37,38 and could serve as a complementary tool
for probing in vacuo structure of biomolecules. UV photodissociation spectra of nucleic acids have been recently reported for isolated mononucleotides,39 for single strand,40,41 double stranded DNA,40 and
drug-DNA complexes.42 In solution phase absorption experiments only the average contribution of all the
absorbing species can be obtained. The advantage of using a mass spectrometer is to study isolated DNA structures of well defined stoichiometries in number of strand and cations. It is of prime importance for a better understanding of the intrisic photophysics of nucleic acids of relevant biological sizes and structures.
Similarly to the approach used previously for IR spectroscopy of nucleic acids, we studied gas phase UV spectroscopy in comparative experiments, and then support the results interpretation by modeling on smaller model units. We focus here on the UV spectra of single-stranded, double helix and G-quadruplex DNA structures isolated in the gas phase.
We studied the self-complementary duplexes A and B (Scheme 1) and compared them to their single strands, in order to compare the same bases but in different environments. The G-quadruplex [(TG4T)4•(NH4)3]5- (C) and its single strand dTG4T were also investigated. The UV spectra show that the
formation of a double helix or G-quadruplex is accompanied by a significant red-shift. The obtained information on the photoreactivity of isolated nucleic acids of relevant biological size (12 to 24 bases) and structures (single strand, duplex and G-quadruplex) will help bridging the gap between studies of small building blocks in vacuo and large nucleic acids strands in solution.
2. Materials and methods Sample preparation
DNA strand: Single-stranded oligodeoxynucleotides d(CGCGAATTCGCG) (sequence A), d(CGCGGGCCCGCG) (sequence B) and d(TGGGGT) (sequence C), were purchased from Eurogentec (Seraing, Belgium), dissolved in water bi-distilled in house, and used without further purification. The samples were prepared so as to obtain the single strand, duplex or G-quadruplex structures in solution. The duplexes structures were formed in 0.1 M ammonium acetate and the G-quadruplex was formed in 0.15 M ammonium acetate. The structures and their stability in solution were verified by electronic circular dichroism and UV melting curves, respectively.
Electrospray mass spectrometry (ESI-MS) and gas-phase action spectroscopy
The following ESI source conditions allowed to transfer the intact complexes in the gas phase as multiply charged anions: needle voltage = 3.5 kV, aux gas flow rate = 35 arbitrary units, capillary temperature = 200 °C, capillary voltage = -10 V, tube lens offset = 45 for a mass range of [1000-2000]. Using those conditions the duplex or quadruplex is the major species (peaks at charge state 5- and small amount at 4-). The single strand (charge state 3-) is also present for sequences A and B, presumably due to in-source dissociation of higher charge states of the duplex. For sequence B, we noticed from the photodetachment spectra that the peak at m/z = 1214, corresponding to single strand 3-, was contaminated with some [Duplex]6-. For that sequence, the single stranded photodetachment spectra were recorded using
slightly harsher source conditions to dissociate the [Duplex]6-: capillary voltage = -30 V and tube lens
offset = 30 V. The single strand of sequence C was added to a pre-formed quadruplex of sequence C, in order to observe both in the mass spectra.
To record the UV spectra in the gas phase, the parent ion of interest is mass selected and the laser enters in the Paul trap during the MS² event. The laser is a Panther OPO laser pumped by a 355-nm Nd:YAG PowerLite 8000 (5 ns pulse width at 20 Hz). Briefly, RF activation amplitude is set to 0 V (i.e. 0 %), so only the laser is causing a reaction, here detachment of an electron. The mass detection of the ions is performed 50 ms or 100 ms after 1 or 2 laser pulses respectively. The resulting mass spectrum is recorded by averaging 30 to 50 scans, each consisting of 3 microscans. The parent ion peak (duplex/quadruplex 5- or ss3-/2-) and radical ion peak (duplex/quadruplex •4- or ss•2-/1-, respectively) are quantified using the centroid function of Xcalibur 1.4.
Ion mobility spectrometry (IMS)
For the ion mobility spectrometry experiments, we used a Synapt G2 HDMS instrument (Waters, Manchester UK) operated in negative ion mode. The instrument is used in negative ion mode for IMS experiments. The source settings were as follows: capillary at 2.2 kV, sampling cone at 20.0 V, extraction cone at 2.0 V, source and desolvation temperatures both at 40°C. The pressure inside the IMS device was monitored using capacitance gauge (Ceravac, Oerlikon). To prevent energy uptake by the ions43,44 and
V. The traveling wave IMS device is using helium at the entrance of the IMS cell at a pressure of 2.493 mbar and nitrogen inside the IMS at a pressure of 2.760 mbar. A wave velocity of 1000 m s-1 and a wave
height of 40 V were used. To determine collision cross section with travelling wave IMS cells, the device must be calibrated with several molecules of known collision cross sections.45 The list of compounds used
and the methodology are the same as previously published.30
Molecular modeling of the structures and theoretical calculations
Experimentally, the charge state 2- is the predominant for the single strand d(TGGGGT) and was choosen for the single strands. We generate nine protonation isomers by neutralization of three of the five phosphate groups. Each protonation isomer of the strands were submitted to 50 ns in vacuo unconstrained molecular dynamic using parm99 amber force field. Hyperchem 8 (Hypercube Inc.) was used to performed molecular dynamics using protocol similar to previously described.28,46 The equilibrium
structure was then optimized using DFT B3LYP at the 3-21G* basis set level. We therefore optimized one conformer per protonation isomer.
To correctly take into account the H-bonds and stacking between the DNA bases, we also compared the structure of strand C (cf7) when optimized with different hybrid functionals (B3LYP, BHHLYP, CAM-B3LYP47, MPWBIK48 and M06-2X49) and basis sets (3-21G*, 4-31G*, 6-31G* and SVP). These
functionals perform well on non-covalent complexes and give the best compromised to described correctly the H-bonds and topology of DNA.48,50 Gaussian 09 A02 software suite was used for the
calculations.
3. Influence of structure on the photoreactivity of isolated DNA ions. Comparison between single strands, double helixes, and G-quadruplex.
All multiply charged DNA anions investigated here undergo electron detachment when submitted to UV laser irradiation:
[DNA-nH]n- → [DNA-nH](n-1)•- + 1 e-
We checked that, upon collisional or thermal heating, none of the DNA structures studied here undergoes electron auto-detachment (without UV laser activation). The major reaction channels for DNA single strand, duplex and quadruplex structures upon thermal activation are neutral base loss, separation of the strand and backbone fragmentation, as described elsewhere.51-54
Upon UV laser activation, the nature of the product ions and their intensities compared to the precursor ion are monitored as a function of the laser wavelength. For each sample at each wavelength, the power was measured using a pyroelectric energy head (Ophir).
The photodetachment yield (PD) is calculated as:
PD = log [ ( Iparent + Iradical ) / Iparent) ] (1)
Typical MS/MS spectra are shown in Supplemental Figure S1. The photodetachment yields scale linearly with the laser power (Figure S2), indicating that electron photodetachment requires a single photon, as observed previously for single strands oligonucleotides.40 Therefore, we lineraly normalized
the detachment efficiency value (PDcorr) as in Eq.2, where is the laser wavelength and Elaser is the
energy per pulse:
PDcorr = PD / ( × Elaser) (2)
Although the details of photoreactivity of nucleic acids is a matter of intense debate, all studies indicate that internal conversion of electronic energy into vibrational energy is a fast process,6,9,10,55 and that the
ground state recovery is on the picosecond time scale to several nanoseconds for GC rich duplex5,8. With
the reasonable assumption that similar decay processes are at stake in our structures in the gas phase, it means that electron photodetachment is competitive with internal vibrational relaxation, and occurs very rapidly after electronic excitation. We therefore postulate that the electron detachment yields scale with the absorption cross section, and that the action spectra obtained by monitoring electron detachment can be compared to absorption spectra.
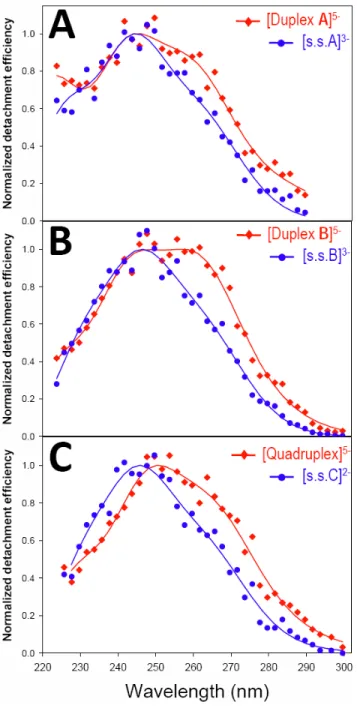
All gas-phase action spectra are shown in Figure 1. The photodetachment efficiency for the single strands is maximum at 245 nm (blue spectra). The UV spectra of the two duplexes and of the G-quadruplex in the gas phase display a significant red-shift compared to the corresponding single strands. The duplex UV spectra (red, Fig. 1A-B) show a relative increase of a contribution at 261.5 ± 1 nm compared to the single strand. This increase is larger for duplex B (100 % GC base pairs) than for duplex A (66 % GC base pairs). For the G-quadruplex, the maximum of the band is red-shifted from 245 nm (5.06 eV) to 248 nm (5.00 eV), and the relative increase of a contribution at 266 nm (4.66 eV) is observed (Fig. 1C).
Figure S3 shows the solution phase aborption spectra of the single strands and the corresponding duplex and quadruplex structure, in ammonium acetate conditions such as electrosprayed here. The maximum extinction coefficients are found at 254-260 nm. For each spectrum, the total number of bases is the same. The change in the absorption spectra is coming from the formation of the Duplex A (3A), Duplex B (3B) and Quadruplex (3C). A hypochromism is detected from 220 to 300 nm for the double helices and from 220 to 280 nm for the quadruplex. This is not represented in the gas-phase spectra, because the photodetachment quantum yields cannot be determined, and therefore the spectra are normalized to unit maximal absorption for comparison. In solution, however, the quadruplex presents an increase of a relative contribution at > 280 nm, similar to that seen in the gas-phase spectra. The noticeable differences between the UV spectra obtained in the gas phase (Figure 1) and solution phase (Figure S3) nevertheless rise questions regarding the effects of the solvent on the electronic transitions energy, about the influence of the positions of the charges on the nucleic acids structures (screened in solution by counterion and solvent) and about possibility of structural changes in the gas phase.
Figure 1. Normalized UV action spectra of DNA sequences (A) (dCGCGAATTCGCG)3-, single strand
(s.s.A) and the corresponding duplex5- (Duplex A); (B) (dCGCGGGCCCGCG)3-, single strand (s.s.B) and
duplex, and (C) (dTGGGGT)2-, single strand (s.s.C) and G-quadruplex5- (Quadruplex).
4. Duplex and G-quadruplex structure in the gas phase. Ion mobility spectrometry experiments.
One the one hand, for each system, the higher-order structure and its respective single strand contain strictly the same bases, so what differs between each pair of blue and red spectra in Figure 1 is only the base environment. On the other hand, all single-stranded spectra are quite similar, whereas each duplex or G-quadruplex spectrum is unique. We can postulate that UV spectral shifts reflect the different base environments, and that the magnitude of the shift reflects the fraction of the bases that undergo such clear change in environment. We will discuss that hypothesis in light of what is known about duplex and
quadruplex structures in the gas phase, and in light of new ion mobility spectrometry (IMS) experiments on duplexes A and B.
IMS separates ions according to their drift velocity through a cell filled with gas. The arrival time is related to the ions collisional cross section (CCS). The core of the G-quadruplex structure, consisting of the four guanine quartets, is well preserved in the gas phase thanks to the the ammonium ions coordinated between the G-quartets, and to the eight H-bonds per G-tetrad.28,56 As the photodetachment are recorded
on the tetramer of strand C with three ammonium ions, the preservation of the G-quartet environment is ensured for each guanine. For the quadruplex C, we obtained the same CCS as previously described, corresponding to intact and perfectly well-stacked G-quartets27,30,57 Assuming that there is only one
possible structure for Quadruplex C, the width of its CCS distribution indicates the instrumental width. Previous ion mobility spectrometry studies showed that GC-duplexes with 10-18 base pairs that have a B-helix structure in solution readily convert into a A-helix structure in the gas phase.58,59 The A-helix is
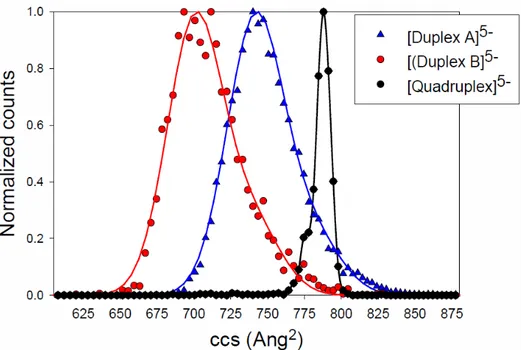
more compact than the B-helix. We therefore suppose that our 12-mer duplex B, wich contains only G-C base pairs, has a A-helix structure in the gas phase. Our IMS results show that Duplex A, which contains AT base pairs, is less compact than Duplex B (Figure 2), and this is interpreted as the conservation of a B-helix structure. Remarkably, the experimental distribution of collision cross sections for the duplexes is significantly broader than for the G-quadruplex, indicating that several conformers are present for each duplex. The double helices are more conformationally dynamic and the solution structure can be altered upon transfer in the gas phase. Molecular modelling simulations showed indeed that GC-rich regions preserved H-bonding and stacking interactions better than AT-rich regions, and that helicity was severely perturbed in the gas phase.46 Our IMS results, showing a larger average CCS for the AT-containing duplex
A compared to the GC-only duplex B, supports that the structure of duplex A is less well preserved in the gas phase.
In summary, the fraction of the bases subjected to a significant degree of ordering (H-bonding, base stacking) in our gas-phase structures ranks lowest to highest in structures A, B and C, respectively, and this is in line with the magnitude of the observed red-shift.
Figure 2: Experimental collisional cross section of the double stranded DNA (Duplex A and Duplex B)
and the quadruplex. The Duplex B (100 % GC base pair) is more compact than Duplex A (66 % GC base pair) indicating a better conservation of the double helix structure in vacuo (stacking and H-Bonds between the base pairs). The quadruplex has a very narrow ccs distribution coming from the high rigidity of the structure.
5. Electronic calculation on the single strand, duplex, G-quadruplex structures
To ascertain whether H-bonding and base stacking can constitute the molecular origin of the red-shift, we undertook calculations to determine the electronic spectra of the single strand, duplex and quadruplex DNA.
First we need to generate an ensemble of conformers that can represent typical base environments found in the UV spectroscopy experiments on the different structures. We indeed assume that, except maybe for the G-quadruplex, several structures of low energy will be populated in the gas phase at room temperature. Extended unrestrained molecular dynamics is used to provide details of the DNA structure and dynamics in vacuo to complement ESI-MS studies.46,56 We also performed molecular dynamics to generate several
equilibrium geometries of the DNA strands in vacuo, which are then further optimized using density functional theory (DFT). Mass spectrometry does not allow the localization of the charges on polyanions DNA (i.e. which phosphate groups are neutralized) and only the total charge state of the ions is unambiguously determined.
For the single strand d(TGGGGT) (sequence C), based on the experimental data, we chose the charge state 2-, and generated different phosphate neutralization possibilities by adding a proton on three of the five phosphate groups to produce nine conformers. For the corresponding G-quadruplex (d(TGGGGT)4),
due to the large size of the complex, only the central core of the quadruplex was extracted after 10 ns in-vacuo molecular dynamics.28 The model G-quadruplex includes two G-tetrads connected with the
smallest constructible G-quadruplex. It has two tetrads including the sugars, phosphate groups and one ammonium cation [d(GG)4-3H++NH4+]2- (264 atoms). One phosphate group was neutralized by a proton
and the total charge was 2-. The charge density of the calculated G-quadruplex is approximately the same as for the experimental G-quadruplex d(TGGGGT)45-. We also studied the influence of the charge state
on the model G-quadruplex [d(GG)4-nH++NH4]2-. Charge states 3-, 2-, and 1- are obtained by selective
protonation of the phosphate groups. For the duplexes, the 12mer single strands are too large to calculate the electronic spectra. We chose to model a single strand d(CGCGCG)2- using the same phosphate
neutralization procedure as for the strand C. To model a double helix DNA with three Watson-Crick base pair, we choose the sequence d(CGC*GCG)2- to keep the same nucleic acids bases for comparison with
the model single strand d(CGCGCG)2-. For the duplex, two phosphate groups (one at each 5’ extremity
of the sequences) are neutralized to reach a 2- charge state.
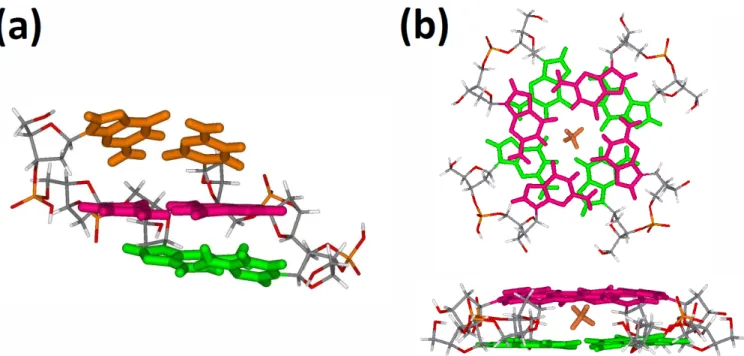
The optimized structures of the duplex d(CGC*GCG)2- and of the quadruplex [d(GG)
4+NH4]2- using
B3LYP is presented in Figure 3. In the structures, the H-bonds and the stacking between the base-pairs or G-tetrad are preserved. The use of different DFT functionals does not imply large changes in the final tridimensional structure with a total RMSD on all the atoms of maximum 2.3 Å, which is low for large DNA structures.
Figure 3: Optimized structures (DFT B3LYP 3-21G*) of (a) 3‐mer model duplex d(CGC*GCG)2-. (b)
G-quadruplex [d(GG)4-3H++NH4+]2-. The Watson-Crick base pairs are colored in green, red and orange. The
G-tetrads are colored in green and red. The central ammonium cation is represented in orange.
To date, most gas-phase calculations dedicated to electronic structure and relaxation pathways of DNA focused on isolated bases, isolated base pairs,60,61 or single strand and duplex with neglecting of the DNA
and they are focused on adenine or thymine sequences.67 Despite all available information, the nature
and the relaxations pathways of the excited states of double helix and G-quadruplex are still a matter of debate, because the transposition of the findings on building blocks to nucleic acid strands and non-covalent structures is neither intuitive nor trivial. Major questions arise, such as: what are the couplings between different bases in a nucleic acids strand upon UV absorption? Does the DNA backbone take part to the electronic transitions or has it only a geometrical constraining role? Our experimental data provide reference gas-phase spectra that can also serve as a basis for testing computational methods on larger, biologically-relevant nucleic acids structures, in the absence of solvent.
A major challenge however comes from the correct representation of the systems under study (up to 24 bases systems) with limited calculations (models containing 6 bases for the single strands and duplex or 8 bases for the G-quadruplex). To obtain the excitation energies and oscillator strengths of our model DNA structures, only time-dependant DFT (TDDFT) calculations are computationally affordable. No comparison with high-level multireference methods is conceivable. Moreover, a large number of electronic states (> 200 states) must be taken into account to cover the experimental energy range (down to 225 nm, i.e. 5.52 eV).
TDDFT requires a careful selection of the functional for the correct treatment of the charge transfer (CT) nature of the excited states. The B3LYP functional tends to underestimate the charge transfer,68 so
we also used the BHHLYP, CAM-B3LYP, MPWBIK and M06-2X functionals and different basis sets, and compared them for one conformer single strand C (cf7), to the experimental gas phase UV spectrum. The results are presented in Figure S5. The theoretical absorption spectra obtained with the B3LYP functional agree best with the experimental data (Figure 1). BHHLYP, CAM-B3LYP, MPWB1K and M06-2X functionals systematically tend to overestimate the HOMO-LUMO gap. As an exemple, the conformer cf7 of strand C (TGGGGT)2- has a HOMO-LUMO gap of 3.66 eV with B3LYP and 6.41 eV
when using M06-2X (using 6-31G* for basis set).
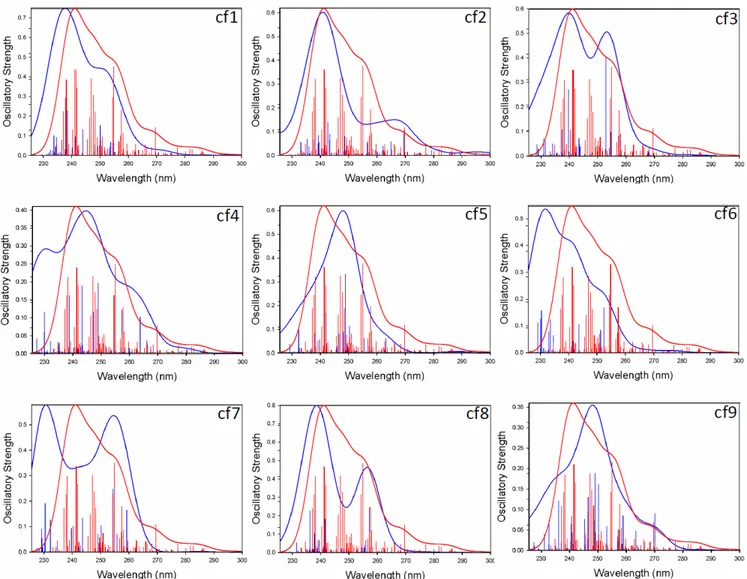
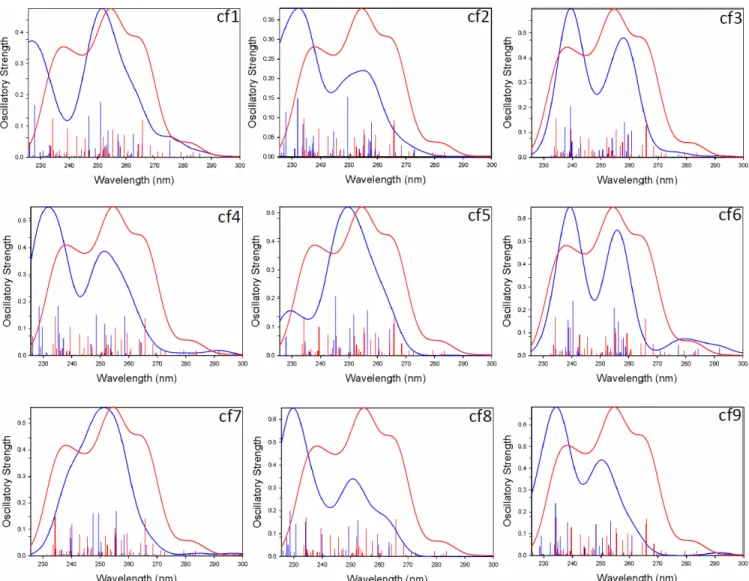
The calculated electronic spectrum of the model G-quadruplex is shown in Figure 4 with the comparison with the spectra of different conformers of single strand C. The theoretical electronic spectrum for the single strand depends on the initial protonation site and conformation. A red-shift for the G-quadruplex structure compared to strand C is observed for most single strand conformers, in agreement with the experimental UV spectra (Figure 1 C), but the single strand electronic spectra greatly vary from conformer to conformer. Remarkably, however, the electronic spectrum of the quadruplex present a red tail starting at 265 nm up to 300 nm, like in the experimental gas-phase spectra, which present electronic transitions of higher oscillatory strength than all singles strands. Similarly, for the model double helix, a red-shift is detected compared to the corresponding single strand d(CGCGCG)2- (Figure 5).
Figure 4: Electronic spectra of the 6‐mer oligonucleotide d(TGGGGT)2- (blue) and of the G-quadruplex
d(GG)42- (red) obtained using TD-DFT at the 3‐21G* level. More than 300 states are taken into account
for the calculations (to access wavelength lower than 220 nm). The blue lines correspond to the different protonation sites of d(TGGGGT)2- (cf. figure S4). cf7, cf8 and cf06 are the lowest energy conformers.
In the absence of solvent, upon UV absorption, an electron detachment is observed and detachment yield is higher for guanine-rich sequences.40 It is also possible that the red-shift is related to the fact that
we analyze bare anions in the gas phase. It is indeed known that the guanine base is the most prone to stabilize a positive hole.69 Experimentally, we found no experimental evidence that the charge state of the
selected DNA ions influence the position of the UV band for single strands, but only one charge state per higher-order structure could be probed. We therefore performed calculation of the electronic spectra for model quadruplex bearing 3 different charge states (1-, 2- and 3-, changing the number of protons on the phosphates). No significant changes are observed as a function of the charge state (Figure S6). This further supports that base H-bonding and stacking is at the molecular origin of the experimental red-shift.
Figure 5: Electronic spectra of the 6‐mer oligonucleotide single strand d(CGCGCG)2- (blue) and of the
Duplex d(CGC*GCG)2- (red) obtained using TD-DFT at the 3‐21G* level. More than 300 states are taken
into account for the calculations (to access wavelength lower than 210 nm). The different blue lines correspond to the different protonation sites for d(CGCGCG)2- (cf. figure S9). cf4, cf5, cf8 and cf9 are
the lowest energy conformers.
We therefore analyzed the molecular orbitals contributing to the most intense transitions to characterize the nature of the electronic transitions of these large DNA polyanions. The MO analysis revealed that most electronic states are represented by a linear combination of several excited determinants with similar coefficients. Most occupied molecular orbitals (MOocc-x (x is the subjacent number related to the
HOMO)) of the quadruplex were found to be distributed over several bases of the G-tetrads (Figure 6). The dominant MO contributions for one of the electronic transitions in the red region of the UV spectrum (269.6 nm) are shown in Figure 6. The electronic transition involves several bases located on the two G-tetrads. For the G-quadruplex, most of the electronic transitions examined in the experimental energy range are similarly delocalized. Other typical contributions are provided in Supplemental Figure S8. The
extensive delocalisation found is in good agreement with theoretical study on quadruplex in the frame of the exciton theory in which a number of about six coherently coupled guanines is found.70 The
examination of MOs on the excited states supports that the extended electronic delocalization in the G-tetrad motifs can explain the red-shift compared to single strand. Therefore, the elementary chromophore for a G-quadruplex structure that must be considered in a quantum chemistry calculation has to be constituted of at least two G-tetrads, and not individual separate bases. This highlights the important role of H-bonding in the G-tetrad and of the stacking between the rigid planar G-tetrads. The contribution of the phosphate groups (bearing the negative charges) to absoprtion are negligible in the experimental UV range (220-300 nm), and the active chromophores are the coupled G-tetrads (see below). A possible origin of the red-shift is an increase in the electron delocalization through H-bond involving bases networks in multiplex structures compared to the single strand. The π-stacks of each G-tetrads are acting as charge-carrier transport and the G-quadruplex structure can act as template in conducting wires.71,72
For the double helix DNA structure, TDDFT calculations using the B3LYP functional qualitatively reproduce the experimental UV action spectra. The duplex DNA also displays delocalised electronic transitions. As an example, the molecular orbitals contribution of the electronic transition of the duplex at 269.4 nm is shown in Supplemental Figure S10. The excited states delocalized over different bases are in agreements with experiments and theoretical calculations on stacked Adenine polynucleotides67 and
AT base-pair duplexes.73 Our results agree with delocalised Frank-Condon excited states on nucleic acids
single strand and double helix.11,74 The electronic delocalization is probably responsible of the
photostability of double helix DNA but has also implications for the aptitude of DNA in charge transport to conduct current.69
Figure 6: Major contributory molecular orbitals for the electronic transition at 269.6 nm for the
G-quadruplex [d(GG)4-3H++NH4+]2- (see figure 3B for the representation of the structure).
6. Conclusion
In conclusion, clear differences in the UV spectra of double helix and G-quadruplex are observed as compared to the corresponding single strands. The red-shift upon higher-order structure formation is
attributed to the absorption of cluster of bases interacting via hydrogen bonds (Watson-Crick for the duplex and Hoogsteen for the quadruplex) and via base stacking. Theoretical calculations of the electronic spectra on large DNA structures (200 atoms and more) also reveal a red-shift upon double helix and G-quadruplex structures formation. This study demonstrates for the first time the use of UV spectroscopy to obtain the electronic signature of higher-order nucleic acids structures in the gas phase, produced by electrospray mass spectrometry. It also opens questions regarding the methodologies used to address optical and electronic properties of highly structured DNAs, and provides experimental benchmarks for testing them.
ACKNOWLEDGMENT
FR was a FNRS scientific collaborator in 2011 and VG is a FNRS research associate. SUPPORTING INFORMATION
Supporting Information Available.
REFERENCES
1. Tinoco, I. Hypochromism in polynucleotides. J. Am. Chem. Soc. 1960, 82, 4785-4790. 2. Rhodes, W. hypochromism and other spectral properties of helical polynucleotides. J. Am.
Chem. Soc. 1961, 83, 3609-3617.
3. Mergny, J.-L.; Phan, A.-T.; Lacroix, L. Following G-quartet formation by UV-spectroscopy. FEBS Lett. 1998, 435, 74-78.
4. Brown, E.; Pysh, E. S. Base Composition Dependence of DNA Hypochromism. J. Chem. Phys.
1972, 56, 31-37.
5. Crespo-Hernandez, C. E.; de La, H. K.; Kohler, B. Ground-state recovery following UV
excitation is much slower in G x C-DNA duplexes and hairpins than in mononucleotides. J. Am. Chem. Soc. 2008, 130 (33), 10844-10845.
6. Crespo-Hernandez, C. E.; Cohen, B.; Hare, P. M.; Kohler, B. Ultrafast excited-state dynamics in nucleic acids. Chem. Rev. 2004, 104 (4), 1977-2019.
7. Vaya, I.; Changenet-Barret, P.; Gustavsson, T.; Zikich, D.; Kotlyar, A.; Markovitsi, D. Long-lived fluorescence of homopolymeric guanine-cytosine DNA dyplexes. Photochem. Photobiol. Sci. 2010, 9, 1193-1195.
8. Vaya, I.; Gustavsson, T.; Miannay, F. A.; Douki, T.; Markovitsi, D. Fluorescence of Natural DNA: From the Femtosecond to the Nanosecond Time Scales. J. Am. Chem. Soc. 2010, 132 (34), 11834-11835.
9. Miannay, F. A.; Banyasz, A.; Gustavsson, T.; Markovitsi, D. Ultrafast excited-state deactivation and energy transfer in guanine-cytosine DNA double helices. J. Am. Chem. Soc. 2007, 129 (47), 14574-14575.
10. Doorley, G. W.; McGovern, D. A.; George, M. W.; Towrie, M.; Parker, A. W.; Kelly, J. M.; Quinn, S. J. Picosecond transient infrared study of the ultrafast deactivation process of electronically excited B-DNA and Z-DNA forms of [poly(dG-dC)2]. Angew. Chem. Int. Ed. 2009, 48, 123-127.
11. Middleton, C. T.; de La Harpe, K.; Su, C.; Law, Y. K.; Crespo-Hernandez, C. E.; Kohler, B. DNA Excited-State Dynamics: From Single Bases to the Double Helix. Annual Review of Physical Chemistry 2009, 60, 217-239.
12. Konermann, L.; Tong, X.; Pan, Y. Protein structure and dynamics studied by mass spectrometry: H/D exchange, hydroxyl radical labeling, and related approaches. J. Mass Spectrom.
2008, 43 (8), 1021-1036.
13. Jarrold, M. F. Unfolding, refolding, and hydration of proteins in the gas phase. Acc. Chem. Res.
1999, 32, 360-367.
14. Wyttenbach, T.; Bowers, M. T. Intermolecular interactions in biomolecular systems examined by mass spectrometry. Annu. Rev. Phys. Chem. 2007, 58, 511-533.
15. Benesch, J. L.; Robinson, C. V. Mass spectrometry of macromolecular assemblies: preservation and dissociation. Curr. Opin. Struct. Biol. 2006, 16 (2), 245-251.
16. Heck, A. J. R. Native mass spectrometry: a bridge between interactomics and structural biology. Nat. Methods 2008, 5, 927-933.
17. Zhong, M.; Robinson, C. V. When proteomics meets structural biology. Trends Biochem. Sci.
2010, 35, 522-529.
18. Yuan, G.; Zhang, Q.; Zhou, J.; Li, H. Mass Spectrometry of G-quadruplex DNA: formation, recognition, property, conversion, and conformation. Mass Spectrom. Rev. 2011, 30, 1121-1142.
19. Clemmer, D. E.; Jarrold, M. F. Ion mobility measurements and their applications to clusters of biomolecules. J. Mass Spectrom. 1997, 32, 577-592.
20. Hemling, M. E.; Conboy, J. J.; Bean, M. F.; Mentzer, M.; Carr, S. A. Gas phase H/D exchange in electrospray ionization mass spectrometry as a practical tool for structure elucidation. J. Am. Soc. Mass Spectrom. 1994, 5, 434-442.
21. Breuker, K.; McLafferty, F. W. Stepwise evolution of protein native structure with electrospray into the gas phase, 10-12 to 102 s. Proc. Natl. Acad. Sci. U. S A 2008, 105 (47),
18145-18152.
22. Bian, Q. Z.; Forbes, M. W.; Talbot, F. O.; Jockusch, R. A. Gas-phase fluorescence excitation and emission spectroscopy of mass-selected trapped molecular ions. Phys. Chem. Chem. Phys. 2010, 12 (11), 2590-2598.
23. Iavarone, A. T.; Duft, D.; Parks, J. H. Shedding light on biomolecule conformational dynamics using fluorescence measurements of trapped ions. J. Phys. Chem. A 2006, 110 (47), 12714-12727.
24. Polfer, N.; Oomens, J. Vibrational spectroscopy of bare and solvated ionic complexes of biological relevance. Mass Spectrom. Rev. 2009, (28), 468-494.
25. Antoine, R.; Dugourd, P. Visible and ultraviolet spectroscopy of gas phase protein ion. Phys. Chem. Chem. Phys. 2011, 13, 16494-16509.
26. Rizzo, T. R.; Stearns, J. A.; Boyarkin, O. V. Spectroscopic studies of cold, gas-phase biomolecular ions. Int. Rev. Phys. Chem. 2009, 28, 481-515.
27. Gidden, J.; Baker, E. S.; Ferzoco, A.; Bowers, M. T. Structural motifs of DNA complexes in the gas phase. Int. J. Mass Spectrom. 2004, 240, 183-193.
28. Gabelica, V.; Rosu, F.; Witt, M.; Baykut, G.; De Pauw, E. Fast gas-phase hydrogen/deuterium exchange observed for a DNA G-quadruplex. Rapid Commun. Mass Spectrom. 2005, 19, 201-208.
29. Gabelica, V.; Rosu, F.; De Pauw, E.; Lemaire, J.; Gillet, J. C.; Poully, J. C.; Lecomte, F.; Gregoire, G.; Schermann, J. P.; Desfrancois, C. Infrared Signature of DNA G-quadruplexes in the Gas Phase. J. Am. Chem. Soc. 2008, 130, 1810-1811.
30. Rosu, F.; Gabelica, V.; Joly, L.; Gregoire, G.; De Pauw, E. Zwitterionic i-motif structures are preserved in DNA negatively charged ions produced by electrospray mass spectrometry. Phys. Chem. Chem. Phys. 2010, in press.
31. Dreuw, A. Quantum chemical methods for the investigation of photoinitiated processes in biological systems: theory and applications. ChemPhysPhem 2006, 7 (11), 2259-2274. 32. Nagornova, N. S.; Rizzo, T. R.; Boyarkin, O. V. Highly Resolved Spectra of Gas-Phase
Gramicidin S: A Benchmark for Peptide Structure Calculations. J. Am. Chem. Soc. 2010, 132 (12), 4040-+.
33. Nagornova, N. S.; Guglielmi, M.; Doemer, M.; Tavernelli, I.; Rothlisberger, U.; Rizzo, T. R.; Boyarkin, O. V. Cold-Ion Spectroscopy Reveals the Intrinsic Structure of a Decapeptide. Angew. Chem. Int. Ed. 2011, 50, 5383-5386.
34. Joly, L.; Antoine, R.; Allouche, A. R.; Broyer, M.; Lemoine, J.; Dugourd, P. Ultraviolet
spectroscopy of peptide and protein polyanions in vacuo: signature of the ionization state of tyrosine. J. Am. Chem. Soc. 2007, 129 (27), 8428-8429.
35. Nielsen, S. B.; Lapierre, A.; Andersen, J. U.; Pedersen, U. V.; Tomita, S.; Andersen, L. H. Absorption spectrum of the green fluorescent protein chromophore anion in vacuo. Phys. Rev. Lett. 2001, 8722 (22), 228102.
36. Iavarone, A. T.; Patriksson, A.; vanderSpoel, D.; Parks, J. H. Fluorescence Probe of Trp-Cage Protein Conformation in Solution and in Gas Phase. J. Am. Chem. Soc. 2007, 129 (21), 6726-6735.
37. Crespo-Hernandez, C. E.; Cohen, B.; Kohler, B. Base stacking controls excited-state dynamics in A-T DNA. Nature 2005, 436 (7054), 1141-1144.
38. Wang, H.; Cheatham, T. E., III; Gannett, P. M.; Lewis, J. P. Differential electronic states
observed during A-B DNA duplex conformational transitions. Soft Matter 2009, (5), 685-690.
39. Marcum, J. C.; Halevi, A.; Weber, J. M. Photodamage to isolated
mononucleotides-photodissociation spectra and fragment channels. Phys. Chem. Chem. Phys. 2009, (11), 1740-1751.
40. Gabelica, V.; Rosu, F.; Tabarin, T.; Kinet, C.; Antoine, R.; Broyer, M.; De Pauw, E.; Dugourd, P. Base-dependent electron photodetachment from negatively charged DNA strands upon 260-nm laser irradiation. J. Am. Chem. Soc. 2007, 129, 4706-4713.
41. Nielsen, L. M.; Pedersen, S. O.; Kirketerp, M. B.; Nielsen, S. B. Absorption by DNA single strands of adenine isolated in vacuo: The role of multiple chromophores. J. Chem. Phys.
2012, 136 (064302), 064302-5.
42. Gabelica, V.; Rosu, F.; De Pauw, E.; Antoine, R.; Tabarin, T.; Broyer, M.; Dugourd, P. Electron photodetachment dissociation of DNA anions with covalently or noncovalently bound chromophores. J. Am. Soc. Mass Spectrom. 2007, 18 (11), 1990-2000.
43. Morsa, D.; Gabelica, V.; De Pauw, E. Effective Temperature of Ions in Traveling Wave Ion Mobility Spectrometry. Anal. Chem. 2011, 83, 5775-5782.
44. Merenbloom, S. I.; Flick, T. G.; Williams, E. R. How hot are your ions in TWAVE ion mobility spectrometry? J. Am. Soc. Mass Spectrom. 2012, 23, 553-562.
45. Ruotolo, B. T.; Benesch, J. L.; Sandercock, A. M.; Hyung, S. J.; Robinson, C. V. Ion mobility-mass spectrometry analysis of large protein complexes. Nat. Protoc. 2008, 3 (7), 1139-1152.
46. Rueda, M.; Kalko, S. G.; Luque, F. J.; Orozco, M. The structure and dynamics of DNA in the gas phase. J. Am. Chem. Soc. 2003, 125, 8007-8014.
47. Yanai, T.; Tew, D.; Hanes, J. A new hybrid exchange–correlation functional using the Coulomb-attenuating method (CAM-B3LYP). Chem. Phys. Lett. 2004, 393, 51-57.
48. Zhao, Y.; Truhlar, D. G. How well can new-generation density functional methods describe stacking interactions in biological systems? Phys. Chem. Chem. Phys. 2005, 7, 2701-2705.
49. Zhao, Y.; Truhlar, D. G. The M06 suite of density functionals for main group thermochemistry, thermochemical kinetics, noncovalent interactions, excited states, and transition
elements: two new functionals and systematic testing of four M06-class functionals and 12 other functionals. Theor Chem Account 2008, 120, 215-241.
50. Sponer, J.; Jurecka, P.; Hobza, P. Accurate interaction energies of hydrogen-bonded nucleic acid base pairs. J. Am. Chem. Soc. 2004, 126, 10142-10151.
51. Gabelica, V.; Rosu, F.; Houssier, C.; De Pauw, E. Gas phase thermal denaturation of an oligonucleotide duplex and its complexes with minor groove binders. Rapid Commun. Mass Spectrom. 2000, 14, 464-467.
52. Gabelica, V.; De Pauw, E. Collision-Induced Dissociation of 16-mer DNA Duplexes with Various Sequences: Evidence for Conservation of the Double Helix Conformation in the Gas Phase. Int. J. Mass Spectrom. 2002, 219, 151-159.
53. Gabelica, V.; De Pauw, E. Comparison of the collision-induced dissociation of duplex DNA at different collision regimes: evidence for a multistep dissociation mechanism. J. Am. Soc. Mass Spectrom. 2002, 13, 91-98.
54. Rosu, F.; Gabelica, V.; Houssier, C.; Colson, P.; De Pauw, E. Triplex and quadruplex DNA structures studied by electrospray mass spectrometry. Rapid Commun. Mass Spectrom.
2002, 16, 1729-1736.
55. bo-Riziq, A.; Grace, L.; Nir, E.; Kabelac, M.; Hobza, P.; de Vries, M. S. Photochemical selectivity in guanine-cytosine base-pair structures. Proceedings of the National Academy of Sciences of the United States of America 2005, 102 (1), 20-23.
56. Rueda, M.; Luque, F. J.; Orozco, M. G-quadruplexes can maintain their structure in the gas phase. J. Am. Chem. Soc. 2006, 128, 3608-3619.
57. Baker, E. S.; Bernstein, S. L.; Gabelica, V.; De Pauw, E.; Bowers, M. T. G-quadruplexes in telomeric repeats are conserved in a solvent-free environment. Int. J. Mass Spectrom.
2006, 253 (3), 225-237.
58. Gidden, J.; Ferzoco, A.; Baker, E. S.; Bowers, M. T. Duplex formation and the onset of helicity in poly d(CG)n oligonucleotides in a solvent-free environment. J. Am. Chem. Soc. 2004,
59. Baker, E. S.; Bowers, M. T. B-DNA helix stability in a solvent-free environment. J. Am. Soc. Mass Spectrom. 2007, 18 (7), 1188-1195.
60. Shukla, M. K.; Leszczynski, J. A Theoretical Study of Excited State Properties of Adenine-Thymine and Guanine-Cytosine Base Pairs. J. Phys. Chem. A 2002, 106 (18), 4709-4717. 61. Tsolakidis, A.; Kaxiras, E. A TDDFT study of the optical response of DNA bases, base pairs,
and their tautomers in the gas phase. J. Phys. Chem. A 2005, 109 (10), 2373-2380. 62. Wesolowski, T. A. Hydrogen-bonding-induced shifts of the excitation energies in nucleic acid
bases: an interplay between electrostatic and electron density overlap effects. J. Am. Chem. Soc. 2004, 126 (37), 11444-11445.
63. de Vries, M. S.; Hobza, P. Gas-phase spectroscopy of biomolecular building blocks. Annual Review of Physical Chemistry 2007, 58, 585-612.
64. Starikov, E. B.; Cuniberti, G.; Tanaka, S. Conformation Dependence of DNA Exciton Parentage. J. Phys. Chem. B 2009, 113 (30), 10428-10435.
65. Varsano, D.; Di, F. R.; Marques, M. A.; Rubio, A. A TDDFT study of the excited states of DNA bases and their assemblies. J. Phys. Chem. B 2006, 110 (14), 7129-7138.
66. Tonzani, S.; Schatz, G. C. Electronic excitations and spectra in single-stranded DNA. J. Am. Chem. Soc. 2008, 130 (24), 7607-7612.
67. Improta, R.; Barone, V. Interplay between "neutral" and "charge-transfer" excimers rules the excited state decay in adenine-rich polynucleotides. Angew. Chem. Int. Ed. 2011, 50, 12016-12019.
68. Aquino, A. J. A.; Nachtigallova, D.; Hobza, P.; Truhlar, D. G.; Hättig, C.; Lischka, H. The Charge-Transfer States in a Stacked Nucleobase Dimer Complex: A Benchmark Study. J. Comput. Chem. 2010, 32, 1217-1227.
69. Genereux, J. C.; Barton, J. K. Mechanisms for DNA Charge Transport. Chemical Reviews 2010, 110 (3), 1642-1662.
70. Changenet-Barret, P.; Emanuele, E.; Gustavsson, T.; Improta, R.; Kotlyar, A.; Markovitsi, D.; Vaya, I.; Zakrzewska, K.; Zikich, D. Optical properties of guanine nanowires:
experimental and theoretical study. J. Phys. Chem. C 2010, 114, 14339-14346.
71. Ortmann, F.; Hannewald, K.; Bechstedt, F. Charge transport in guanine-based materials. J. Phys. Chem. B 2009, 113, 7367-7371.
72. Cohen, H.; Sapir, T.; Borovok, N.; Molotsky, T.; DiFelice, R.; Kotlyar, A. B.; Porath, D. Polarizability of G4-DNA Observed by Electrostatic Force Microscopy Measurements. Nano Lett. 2007, 7 (4), 981-986.
73. Santoro, F.; Barone, V.; Improta, R. Excited States Decay of the A-T DNA: A PCM/TD-DFT Study in Aqueous Solution of the (9-Methyl-adenine)2 · (1-methyl-thymine)2 Stacked Tetramer. J. Am. Chem. Soc. 2009, 131, 15232-15245.
74. Markovitsi, D.; Gustavsson, T.; Banyasz, A. Absorption of UV radiation by DNA: Spatial and temporal features. Mutation Research-Reviews in Mutation Research 2010, 704 (1-3), 21-28.
![Figure 6: Major contributory molecular orbitals for the electronic transition at 269.6 nm for the G- G-quadruplex [d(GG) 4 -3H + +NH 4 + ] 2- (see figure 3B for the representation of the structure)](https://thumb-eu.123doks.com/thumbv2/123doknet/14655929.552826/15.918.98.853.686.919/contributory-molecular-orbitals-electronic-transition-quadruplex-representation-structure.webp)
