HAL Id: hal-02599299
https://hal.inrae.fr/hal-02599299
Submitted on 16 May 2020
HAL is a multi-disciplinary open access
archive for the deposit and dissemination of sci-entific research documents, whether they are pub-lished or not. The documents may come from teaching and research institutions in France or abroad, or from public or private research centers.
L’archive ouverte pluridisciplinaire HAL, est destinée au dépôt et à la diffusion de documents scientifiques de niveau recherche, publiés ou non, émanant des établissements d’enseignement et de recherche français ou étrangers, des laboratoires publics ou privés.
Cultivated, multifunctional and integrated forest
landscapes? An overview of the factors influencing
forest management in the ‘Pontenx’ case study (Landes
de Gascogne, France)
Arnaud Sergent, Philippe Deuffic, Vincent Banos, B. Hautdidier, M.
Maindrault
To cite this version:
Arnaud Sergent, Philippe Deuffic, Vincent Banos, B. Hautdidier, M. Maindrault. Cultivated, multi-functional and integrated forest landscapes? An overview of the factors influencing forest management in the ‘Pontenx’ case study (Landes de Gascogne, France). [Research Report] irstea. 2013, pp.127. �hal-02599299�
Case Study Report:
‘Pontenx’, FRANCE
EU FP7 INTEGRAL D 3.1-2
Cultivated, multifunctional and
integrated forest landscapes?
An overview of the factors influencing forest
management in the ‘Pontenx’ case study
(Landes de Gascogne, France)
Arnaud Sergent, Philippe Deuffic, Vincent Banos, Baptiste Hautdidier & Marc Maindrault
October 2013
Revised version
National research Institute of Science and technology for Agriculture and Environment ADBX Research Unit
Table of contents
1 Introduction ... 7
2 Methods ... 9
2.1 Desktop and website research ... 9
2.1.1 Desktop research ... 9
2.1.2 Web site research ... 9
2.2 Forest stakeholders and forest owners’ interviews ... 10
3 Structural factors ... 12
3.1 Demographic developments ... 12
3.1.1 The total population ... 12
3.1.1.1 Population density ... 12
3.1.1.2 Rural and urban areas ... 13
3.1.1.3 Other functional zonings ... 15
3.1.1.4 Key factors and spatial distributions of the population growth... 16
3.1.1.5 Social changes in the total population ... 18
3.1.2 Demographic development: forest owners ... 21
3.1.2.1 Average size and legal nature of ownerships ... 21
3.1.2.2 Socio-demographic information: age, gender and occupation ... 24
3.1.2.3 Nationality and place of residence ... 24
3.1.3 Impacts of demographic development ... 26
3.1.4 Concluding assessment ... 27
3.2 Public opinion and discourse ... 28
3.2.1 Some elements of methods for a complex issue ... 28
3.2.2 Leisure practices ... 29
3.2.3 Shared traditional values and dominant ideas ... 32
3.2.4 Emergence of contradictory discourses on the Gascony Forest ... 33
3.3 Economic developments ... 35
3.3.1 Main products and services ... 35
3.3.1.1 Pinus pinaster wood ... 35
3.3.1.2 Woody biomass ... 39
3.3.1.3 Recreation, amenities, social and shadow values of the Aquitaine forest ... 40
3.3.1.4 Hunting ... 41
3.3.2 Impacts ... 44
3.3.3 Concluding assessment ... 44
3.4 Technological development ... 45
3.4.1.1 Mechanization ... 46
3.4.1.2 Coarse wood debris, stumps… a broadening of the harvest ... 48
3.4.1.3 Genetic selection ... 48
3.4.1.4 Green wood finger-jointing ... 49
3.4.1.5 Resin-tapping ... 50
3.4.1.6 Feasibility and relevance of alternative forest management practices ... 51
3.4.2 Impacts ... 52
3.4.3 Concluding assessment ... 53
3.5 Ownership structure and tenure ... 53
3.5.1 Main characteristics ... 53
3.5.2 Changes and impacts ... 56
3.6 Forest policy regime ... 58
3.6.1 Forest policy authority ... 58
3.6.1.1 The authority of the State on the forest sector ... 58
3.6.1.2 Peripheral role of decentralized authorities in the forest sector ... 60
3.6.1.3 Private regulation of forest management practices ... 61
3.6.2 Political mediation patterns ... 63
3.6.2.1 Mediation arenas in the forest sector ... 63
3.6.2.2 Mediation practices in the forest sector ... 66
3.6.3 Political ideas ... 67
3.6.4 Concluding assessments ... 68
3.7 Policy coherence... 69
3.7.1 Formal policy goals and instruments... 69
3.7.1.1 Forest policy goals and instruments ... 69
3.7.1.2 Biodiversity policy goals and instruments (related to forest issues) ... 71
3.7.1.3 Local forest development policy goals and instruments (related to forest issues) .. 72
3.7.1.4 Climate policy goals and instruments (related to forest issues) ... 73
3.7.2 Policy coherence ... 75
3.7.2.1 Incoherence of the multifunctional forest policy ... 75
3.7.2.2 Inconsistencies of the forest-related policy implementation process ... 77
3.7.3 Policy processes ... 80
4 Agent-based factors (meso) ... 81
4.1 Actors and their networks ... 81
4.1.1 Theoretical and methodological approach ... 81
4.1.2 Relevant actor networks ... 81
4.1.3 Main network at the local level (NUTS-3) ... 83
4.1.3.1 The family network ... 83
4.1.3.3 The local DFCI network ... 83
4.1.3.4 The GPF network ... 84
4.1.3.5 The private forest advisors networks ... 84
4.1.4 Main network at the regional level (NUTS-2) ... 84
4.1.4.1 The private or associative professional networks: ... 84
4.1.4.2 The political authorities ... 86
4.1.4.3 The non profit organisation networks ... 87
4.1.5 Relations between networks ... 87
4.2 Political resources... 88
4.2.1 Power resources ... 88
4.2.2 Strategies ... 89
5 Agent-Based factors (micro level) ... 91
5.1 Forest management practices ... 91
5.1.1 Evolution of ecosystem services between 1857 and 2000 ... 91
5.1.2 Evolution of ecosystem services and forest practices between 2000 and 2009 ... 92
5.1.2.1 The South western maritime pine model ... 92
5.1.2.2 Some sources of tension ... 95
5.1.3 The hurricane Klaus in 2009: a turning point or a status quo? ... 95
5.1.4 From theoretical forestry model to practices in the field in 2012 ... 97
5.2 Actors’ behaviour ... 99
5.2.1 Theoretical frame ... 100
5.2.2 Methodology for content analysis ... 102
5.2.3 Four main different logics of behaviour ... 103
5.2.3.1 Group G1: forest entrepreneurs ... 104
5.2.3.2 Group G2: “traditionalist” foresters ... 106
5.2.3.3 Group G3: “passive outsiders” ... 107
5.2.3.4 Group G4: “environmentalist foresters” ... 108
5.2.4 Summary of the prevalent logics of behaviour ... 109
5.2.5 Change in future logics of behaviour ... 110
6 ‘STEEP’ analysis ... 114
7 Interplays ... 120
8 Short Conclusive comments ... 121
Tables
Table 1: Reference data about INTEGRAL French case study area ... 8
Table 2: List of interviewees ... 10
Table 3: Population of the LG and others areas during the 1968-2009 period ... 12
Table 4: Population growth rate in LG and others areas during the 1968-2009 period (%) ... 12
Table 5: Average density during the 1968-2009 period (inhabitants per km²) ... 13
Table 6: LAU2 with population density below 150 inh./km² (%) ... 13
Table 7: Population living in local units with population density below 150 inh./km² (%) ... 13
Table 8: Percentages of “rural” local units (2010) ... 15
Table 9: Population living in “rural” local units (%) ... 15
Table 10: Distribution of local units in accordance with ZAU 2010 typology (%) ... 16
Table 11: Average annual population growth rate during the period 1968-2006 (%) ... 17
Table 12: Population by age group in 1968 and 2006 (%)... 18
Table 13: Occupational distribution of the workforce in 1968 and 2009 (%) ... 19
Table 14: Percentage of pensioners in the total population (1990, 1999) ... 20
Table 15: Permanent residents and ‘present’ population in three territories ... 21
Table 16: Surfaces and numbers of forest owners in the ‘Landes of Gascony’ forest area (2006) ... 22
Table 17: Areas and numbers of forest owners in the ‘Pontenx’ case study area ... 22
Table 18: Ratio of areas and owners for forest properties over one hectare (%) ... 23
Table 19: Legal nature of privately owned forests ... 23
Table 20: Areas and numbers of forest owners by age group (%) ... 24
Table 21: Ranking of forested Landscapes ... 31
Table 22: Cynegetic objectives for deers at in the ‘Pontenx’ case study. ... 42
Table 23: Impacts of markets on forest management and land-use in the forested landscape ... 44
Table 24: Impacts of technological developments on forest operations, products and ES ... 52
Table 25: Distribution of the ownership of the public forests in the Aquitaine region in 2012. ... 54
Table 26: Human resources devoted to State forest policy ... 60
Table 27: Estimation of public subsidies devoted to forest policy ... 61
Table 28: Main national interest groups of forest sector ... 62
Table 29: 'Ecologization' referential and main guiding principles of forest policy ... 68
Table 30: State forest policy goals and instruments ... 70
Table 31: Aquitaine Regional council Forest Policy goals and instruments ... 71
Table 32: Biodiversity policy goals and instruments ... 72
Table 33: Local forest development policy goals and instruments ... 73
Table 34: Biomass energy policy goals and instruments ... 74
Table 35: Wood use in construction policy goals and instruments ... 75
Table 36: Inconsistencies of the increase of wood mobilization policies ... 77
Table 37: Inconsistencies of the improvement of competitiveness of the French wood sector policies ... 78
Table 38: Inconsistencies of the conservation of forest resources policies ... 78
Table 39: Inconsistencies of Forest biodiversity conservation policies... 79
Table 40: Inconsistencies of Supporting local wood products and short wood supply chains policies 79 Table 41: Evolution of the main objectives assigned to the Gascony forest ... 92
Table 42: Schematic theoretical maritime pine forestry model (in 2000) ... 93
Table 43: Overview on ecosystem services provision in Gascony forest ... 94
Table 44: Comparative approach of six forestry model for Pinus sp. in the Gascony Forest. ... 97
Table 45: Prevalent logics of behaviour among Gascony forest owners ... 110
Table 46: Distribution by trees species of the re-afforestation areas of the restoration programme 2009-2017. ... 111
Figures
Figure 1: ‘Landes of Gascony’ in a tree species map of European forests ... 8
Figure 2: The French case study area in its context Source : IGN, BD Carto ... 8
Figure 3 : Annual variation of population density in Aquitaine (1999-2008) ... 13
Figure 4 : Regional typology overview ... 14
Figure 5: ZAU 2010 ... 16
Figure 6: Average annual natural growth rate in LG ... 17
Figure 7: Average annual net migration in LG ... 17
Figure 8: Age group 18 to 24 in 1968 and 2006 (%) ... 19
Figure 9: People over 65 in 1968 and 2006 (%) ... 19
Figure 10: Share of farmers in the workforce (1968 / 2006) ... 20
Figure 11: Share of managers in the workforce (1968 / 2006) ... 20
Figure 12: Percentage of pensioners in new incomers (1999) ... 20
Figure 13: Share of second homes in 1968 and 2006 (%) ... 21
Figure 14: Typology of private forest owners, at the scale of the ‘Pontenx’ case study (FORSEE, 2007) ... 25
Figure 15 : Average annual net migration in ‘Landes of Gascony’ ... 29
Figure 16: When do people go to forest? ... 30
Figure 17: Activities practiced in forests ... 30
Figure 18: Appreciated forest attributes ... 31
Figure 19: Unpleasant forest attributes ... 31
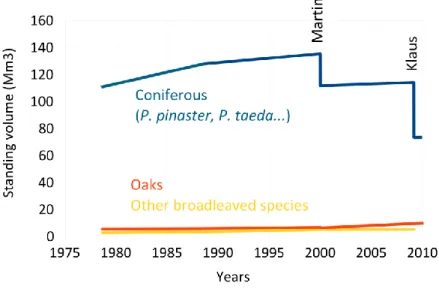
Figure 20: Evolution of estimated standing volumes, ‘Landes of Gascony’. ... 35
Figure 21: Evolution of timber and industrial wood harvest, Aquitaine region, 1995-2011. ... 36
Figure 22: Long-term evolution of dimensional timber production, France, 1947-2011. ... 36
Figure 23: Wage employment in the Forestry-Wood sector in municipalities of the Aquitaine region, 31st dec. 2010. ... 38
Figure 24: Evolution of wild boar kills in the Landes NUTS-3 region, 1983-2008. ... 41
Figure 25: Private hunting rights allowed for wild boar in the Landes NUTS-3 region for the 2012-2013 season. ... 42
Figure 26: Forest contractors offering harvesting services in the Aquitaine region. ... 47
Figure 27: Percentages of private, state-owned and other public forests in metropolitan regions of France. ... 53
Figure 28: Forest areas, private and public, in Aquitaine municipalities. ... 54
Figure 29: Distribution of forest properties areas in NUTS regions and case study areas for the INTEGRAL French case. ... 55
Figure 30: Lorenz curve of cadastered land - Pontenx case study. ... 56
Figure 31: Management delegations amongst private owners in Aquitaine region. ... 56
Figure 32: Clearing authorizations in the Aquitaine region. ... 57
Figure 33: Simplified example of social networks from the French case study area level to the national level ... 82
Figure 34: Overlaps between topics in the paragraphs of the current report ... 120
Figure 35: Network visualization of the number of overlaps between subchapters ... 120
1 INTRODUCTION
The ‘Pontenx’ case study area is the landscape selected by Irstea and EFI-Atlantic for their common work in INTEGRAL. Defined by the boundaries of 13 municipalities (or communes, i.e. LAU2: local administrative units Level 2), it is built around an E-W oriented watershed, covering 102 000 ha. Located in the heart of the ‘Landes of Gascony’ forest region (or Massif des Landes de Gascogne), this area was chosen because it encompassed a diversity of forested landscapes that was representative of this greater forest area. The choice made in this report is that a fair share of the discussed material will relate not only to the ‘Pontenx’ case study stricto sensu but to the whole ‘Landes of Gascony’, as the latter appears as the most relevant master frame and scale to identify and analyse the social, political and economic processes influencing forest management at the landscape level.
‘Landes of Gascony’ is a 1.5 Mha forest area of southwestern France, interfacing Northern Europe and the Iberic peninsula. It is bordered by the Atlantic Ocean on the west and the large urban areas of Bordeaux and Bayonne respectively north and south. From an administrative perspective, ‘Landes of Gascony’ is located in the NUTS-2 region of Aquitaine, intersecting three NUTS-3 regions: Gironde, Landes and Lot-et-Garonne (Figure 2). It is composed of 52 local administrative units Level 1 (LAU1) and 400 LAU2s. While not an administrative region in itself, it is a predominantly wooded area of which identity and coherence are built around three main features: (i) a biophysical unit with podzolic sandy soils and shallow ground water levels; (ii) a dominant forest cover of 66%, compared with agricultural and built-up areas respectively amounting to 18% and 7% of the area in 2009 (Teruti data in (Mora et al., 2012)). Primarily composed of maritime pine (Pinus pinaster Aiton), the forest is often described as the largest cultivated and privately owned (92%) forest in Europe. (iii) A significant economic weight throughout a regional forestry-wood chain, based on a large number of SMEs (logging, sawing, furnishing and packaging) co-existing with major international industries (pulp and paper, panel). The specificity of this forest-based sector is that the two processing stages are almost entirely connected to the local wood resource of maritime pine and localized in the same territory.
The ‘Landes of Gascony’ area is also embedded in a multi-scale of social, political and economic processes which could be studied at three levels (regional, national and European). This is all the more important to take into account that Gascony forest and its related activities are currently facing structural changes and rescaling process. Throughout its history1, this region has underwent important socio-economic and landscape changes but forestry and its related industries have always adapted with valuating of different products and good derived from pine forest (pine-tapping, softwood, pulpwood and, nowadays, fuelwood and green chemistry). Recent changes suggest a multi-scale regulation that include but also extend well beyond the forest-based sector: storm damages (1999 & 2009), population growth with urbanization and new attractiveness of this region, emergence of energy issues and a more broad-based range of economic activities in rural areas. Along with sector trends, such key drivers lead toward a multiplication of -potentially contradictory- socioeconomic representations and uses regarding the Gascony forest. In this respect, ‘Landes of Gascony’ appears as a relevant complementary scale to analyse the ‘Pontenx’ case study and address INTEGRAL research challenges: the competition of diverse demands for multiple forest ecosystem goods and services under changing environmental, economic and social conditions.
1
If pine forests have a long history in Gascony, the afforestation process was being systematized from a law which in 1857 requesting all municipalities to clean and replant their wetlands. This had led to a sharp increase of the Pine forest area, from about 200,000 ha in 1850 to 750,000 ha in 1875. In 1950, pine forest covered “only” an area of 400,000 ha due to
Figure 1: ‘Landes of Gascony’ in a tree species map of European forests
Figure 2: The French case study area in its context Source : IGN, BD Carto
Table 1: Reference data about INTEGRAL French case study area
Scale Names # of LAU2s Area (km²) Forest cover (%)
C ase stud y a re as
INTEGRAL case study area (landscape) ‘Pontenx’ case study 13 102 78 %
Surrounding forest area ‘Landes of Gascony’ 410 15,000 63 %
NUTS-3 Gironde 542 10,000 46 % Landes 331 9,242 60 % Lot-et -Garonne 317 5,361 23 % NUTS-2 Aquitaine 2,295 41,289 43 % National France 36,566 543,965 28 %
2 METHODS
In order to make the conceptual framework operational, a set of topic-specific research questions has been implemented by each of the topic teams (see the handbook for the researchers). To answer these questions, three types of data have been used:
Bibliographic information
Websites information
Empirical data coming from a set of interviews with stakeholders and forest owners.
More methodological details are given in chapters dealing with each topic, but we shortly describe here the main methodological stakes of WP 3.1.
2.1 Desktop and website research
2.1.1 Desktop research
A large deal of the data collected during the desktop research came from the French national service of statistics (INSEE) and from several regional services in the Aquitaine region (NUTS-2). These services produce online documents as annual reports, assessment reports, and statistical surveys. These documents were useful to show the dynamics of different structural factors (as demography, forest economy, and technological development) on a medium or long term (at least the last 20 years)
However, after the Hurricane Klaus in 2009, several statistics had to be updated following the severe damages due to the windthrow (updates of the amount of forest damages, the volume of marketed or marketable timber, the amount of public subsidies for forest cleaning and re-afforestation…). Thanks to the rapid reaction of the regional forest services, most important forestry data were updated in 2010-2011. When we began our own survey for the Integral project, many documents were already available as the report for the ministry of agriculture dealing with the re-afforestation of the Gascony forest (Laffite and Lerat, 2009) or the experts reports done at a regional level by several scientific and technological institutes (INRA, FCBA, CRPF Aquitaine).
Another important source of data comes from a land-use forecasting study (Mora et al., 2012) that had been carried out in the NUTS-2, and more precisely on the Gascony forest (Landes de Gascogne) by the national institute for agricultural research (INRA) during almost three years (2010-2012). Two members of Irstea have participated to this study and a research fellow involved in the study joined our research team to work on the Integral project in 2012.
2.1.2 Web site research
For the data collection, many national and regional state administration web sites have been consulted
the national service of statistics for the topics demographic developments (www.insee.fr/)
the website of the ministry of agriculture (agriculture.gouv.fr/) , of the regional service of forest and agriculture (draaf.aquitaine.agriculture.gouv.fr/) and of the regional center for
private property (www.crpfaquitaine.fr/) for the topics “ownership structure” and “forest policy regime”
the website of the institute for wood technology, building and furniture (www.fcba.fr/) for the topics ‘technological development”
2.2 Forest stakeholders and forest owners’
interviews
Concerning the interviews, two guides – one for forest managers and the other for stakeholders – have been implemented as planned in the Handbook for researchers.
The surveys have been carried out between September 2012 and February 2013. 16 forest stakeholders had been interviewed and 26 forest owners and managers.
Table 2: List of interviewees
Stakeholders Forest owners or managers
Code Profile Code Profile
S01 Politician F01 Forest advisor
S02 politician F02 Forest advisor
S03 Politician F03 Forest advisor
S04 Politician F04 Forest advisor
S05 Politician F05 Forest manager
S06 Politician F06 Forest advisor
S07 Forest administration F07 Forest advisor
S08 Forest administration F08 Forest advisor
S09 Forest administration F09 Forest contractor
S10 R&D F10 Forest owner
S11 Environmental NGO F11 Forest owner
S12 Industrialist F12 Forest owner
S13 Industrialist F13 Forest owner
S14 Industrialist F14 Forest owner
S15 Industrialist F15 Forest owner
S16 Forestry Union F16 Forest owner
F17 Forest owner F18 Forest owner F19 Forest owner F20 Farmer/Forest owner F21 Farmer/Forest owner F22 Forest owner F23 Forest owner F24 Forest owner F26 Forest owner
Unlike quantitative survey, the methodological principles underlying these qualitative surveys were not to ensure a demographically-balanced and representative sample of the forest stakeholders or forest owners’ population but its diversity. It is the reason why the choice of the interviewee was guided by two principles:
We firstly interviewed forest stakeholders whose main field of action was settled at a regional level. These actors had a good overview of the main issues concerning the forestry sector. They also participated into many public debates and often tried to put at the political agenda some strategic issues for their activities;
We secondly interviewed forest owners at a local scale and some forest advisors. If some of them are in relation with the regional forest stakeholders, a majority are only members of local networks (see the chapter on “actors’ networks” and “actors’ behaviours”). In order to to be both retrospective and future-oriented, we also used some interviews that had been carried out the year before and after the Hurricane Klaus in 2009. Thanks to this set of interviews, we have been able to analyze which main changes of forestry practices were induced by the normal evolution of innovations and which ones were induced by the storm itself.
In both cases, our qualitative survey consists of semi-structured, tape-recorded and face-to-face interviews. Due to the lack of time, interviews carried out in 2012 were partly retranscribed.
To achieve the typology of forest owners, we mobilized the answers to the different questions that were proposed in the interview guide for forest managers (as described in the handbook for researchers in November 2012). We tested their responsiveness to structural factors (demography, public opinion and discourses, economic development, technological development, ownership structure and tenure arrangements, forest policy regime) and the impact of agent-based factors (social networks, political resources).
Finally, we performed a two-stage content analysis of their discourse (structural and theme analyses). The first part was the structural analysis which consisted of coding, clustering, and labelling individual extracts from interviews into differently themed categories (structural analysis). The second part was the thematic analysis, which involved studying the different opinions expressed by all interviewees on the same topic (a category or a concept labelled in a thematic item). The aim was to reveal the arguments and the system of values used to accept or reject a specific item (opinions on forest policies, on factors influencing forest management… for more details, see the chapter § 5.2).
3 STRUCTURAL FACTORS
3.1 Demographic developments
3.1.1 The total population
‘Landes of Gascony’ (LG), first regarded as a “desert” in past centuries (Aldhuy, 2006; Sargos, 1997) then as a rural area dedicated to forest and agricultural activities, has progressively become an attractive landscape and living environment for an increasing number of people. In 2009, the estimated population was 840,200, representing almost a 60% increase in forty years (Table 3 & Table 4 below). This growth is not only well above national (26%) and regional (27%) averages, but also is constantly rising: + 8.2% during the period 1990-1999, + 10.5% during the period 1999-2006 (Bergouignan et al., 2011). These demographic trends are based on a combination of three factors: urbanization spread, in particular around Bordeaux and Bayonne, attractiveness of the coast and, nowadays, rural resettlement (Mora et al., 2012).
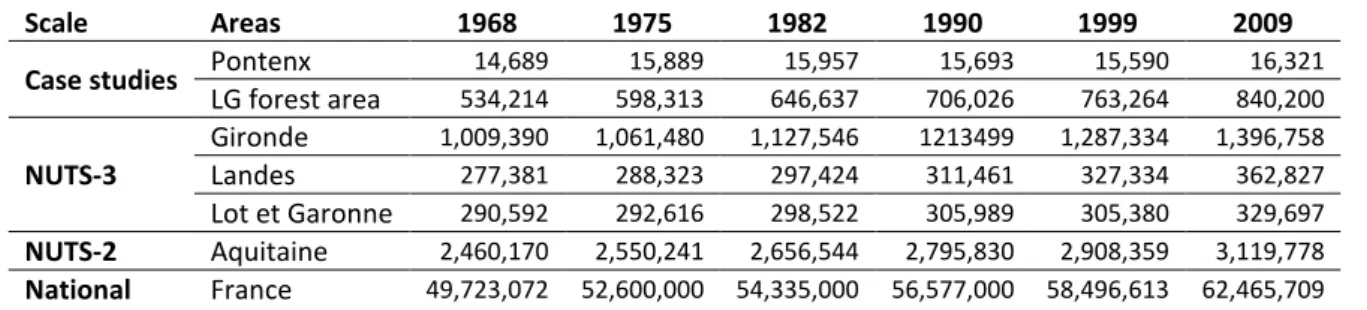
Table 3: Population of the LG and others areas during the 1968-2009 period
Scale Areas 1968 1975 1982 1990 1999 2009
Case studies Pontenx 14,689 15,889 15,957 15,693 15,590 16,321
LG forest area 534,214 598,313 646,637 706,026 763,264 840,200 NUTS-3 Gironde 1,009,390 1,061,480 1,127,546 1213499 1,287,334 1,396,758 Landes 277,381 288,323 297,424 311,461 327,334 362,827 Lot et Garonne 290,592 292,616 298,522 305,989 305,380 329,697 NUTS-2 Aquitaine 2,460,170 2,550,241 2,656,544 2,795,830 2,908,359 3,119,778 National France 49,723,072 52,600,000 54,335,000 56,577,000 58,496,613 62,465,709 Table 4: Population growth rate in LG and others areas during the 1968-2009 period (%)
Scale Areas 1968-1975 1975-1982 1982-1990 1990-1999 1999-2009 1968-2009 Case studies Pontenx 8.17 0.43 -1.65 -0.66 4.69 11 % LG forest area 12.00 8.08 9.18 8.11 10.08 57 % NUTS-3 Gironde 5.16 6.22 7.62 6.08 8.50 38 % Landes 3.94 3.16 4.72 5.10 10.84 31 % Lot et Garonne 0.7 2.02 2.5 -0.2 13 % NUTS-2 Aquitaine 3.66 4.17 5.24 4.02 7.27 27 % National France 5.79 3.31 4.2 3.36 6.75 26% 3.1.1.1 Population density
In 2009, the average population density across ‘Landes of Gascony’ was 58.1 inh./km². This density is far lower than that regional (77.6), national (114) and European (116) averages (Table 5). Moreover, 50% of local administrative units Level 2 (LAU2), i.e. local units or municipalities, have a population density less below 30 inh./km². This threshold is used by INSEE, the French statistical institute, to define the category of ‘Espaces à faible densité’, i.e. rural peripheral area. But, since 1968, average population density has increased of 64%. Furthermore, average density is only a process of grouping small territorial units into larger aggregations. In our case study, this aggregation hides great spatial disparities (Figure 3). For example, urban areas located between Bordeaux and the coast could have population density greater than 150 or 300 inhabitants per km².
Table 5: Average density during the 1968-2009 period (inhabitants per km²) Scale Areas 1968 1982 1990 1999 2009 Cases Studies ‘Pontenx’ 16.8 18.5 18.13 17.99 19.81 LG forest area 35.6 43.03 46.98 50.79 58.12 NUTS-3 Gironde 101 112.8 121.4 128.7 143.5 Landes 30 32.18 33.7 35.42 41.04 Lot et Garonne 54.2 55.68 57.08 56.96 61.5 NUTS-2 Aquitaine 59.6 64.31 67.68 70.41 77.61 National France 91.4 99.89 104.1 107.6 114.8
Figure 3 : Annual variation of population density in Aquitaine (1999-2008)
Source :(Scarabello, 2011)
3.1.1.2 Rural and urban areas
A. The OECD approach : An (up-to-date) definition
The definition of OECD is based on population density and, until 2009, on a two-step approach: First, local units (e.g. municipalities) are identified as rural if their population density is below 150 inhabitants per square kilometre.
Table 6: LAU2 with population density below 150 inh./km² (%) NUTS Areas 1968 1990 1999 2009 LG 94,6 91 90,6 88,4 NUTS-3 Landes 97,3 95,2 95,2 94 Lot et Garonne 95,3 94,1 93,4 92,2 Gironde 88 81,08 81,08 77,5
Table 7: Population living in local units with population density below 150 inh./km² (%)
NUTS Areas 1968 1990 1999 2009 LG 60,4 48,2 48,6 46,9 NUTS-3 Landes 76,2 66,7 66,3 65,2 Lot et Garonne 57,4 52,9 54,6 51,7 Gironde 34,5 28,8 29,1 27,6
Then, NUTS-3 regions are classified in one of the 3 categories:
Predominantly Rural region (PR) : if more than 50% of the population of the region is living in rural local units (with less than 150 inhabitants / km²)
Intermediate Region (IR) : if 15% to 50% of the population of the region is living in rural local units
Predominantly Urban region (PU): if less than 15% of the population of the region is living in rural local units.
Inhabitants / km² Urban Aquitaine ---- ‘Landes of Gascony’
To further refine the typology, this second step considers also the presence of large urban centres:
If there is an urban centre > 200,000 inhabitants (in EU) representing no less than 25% of the regional population in a ‘predominantly rural’ region, it is re-classified as ‘intermediate’
If there is an urban centre > 500,000 inhabitants (in EU) representing no less than 25% of the regional population in an ‘intermediate’ region, it is re-classified as ‘predominantly urban’.
Based on this classification, it can be concluded that ‘Landes’ and ‘Lot et Garonne’ are ‘Predominantly Rural regions’ (NUTS-3). ‘Gironde’ would be classified as an ‘Intermediate Region’ (IR) but is re-classified as ‘predominantly urban’ because Bordeaux is an urban centre around one million inhabitants representing more than 70 % of the regional population.
According to Eurostat and DG Regio recent methods, urban/rural typologies are now defined on the basis of gridded maps of population density (we used the national INSEE RFL2009 survey instead of the older Europe-wide population density map from EEA). Urban areas are equated with continuous patches of 1-km² pixels with a population above 300, reaching a total of 5000 inhabitants. NUTS-3 regions can then be qualified according to the proportion of their population residing in ‘rural’ grid cells: ‘predominantly rural’ if above 50%, ‘intermediate’ if between 20 % and 50 %, predominantly urban if less than 20 %. A ‘remoteness’ criterion has been recently proposed as well: a region should be qualified as remote if less than half of its residents can drive to the centre of a city of at least 50 000 inhabitants within 45 minutes (Dijkstra and Poelman, 2011). The ‘Gironde’ NUTS-3 region (département), with the presence of Bordeaux, is qualified as ‘predominantly urban’. The urban areas of Bayonne/Anglet/Biarritz & Pau lead ‘Pyrénées Atlantiques’ to be defined as ‘intermediate’. The three other départements of Aquitaine are ‘predominantly rural’. But interestingly, only ‘Lot et Garonne’ is also qualified as ‘remote’. The ‘Landes’ département has indeed one the lowest population densities of metropolitan France, but an accessibility by road (and rail) allowing a strong influence of the largest regional urban areas (Bordeaux and Bayonne, but also the Arcachon bay, Mont-de Marsan and Dax).
Figure 4 : Regional typology overview
B. National approach : INSEE definition
Rural areas are defined by INSEE, the French statistical institute, in contrast with urbanized areas, themselves equated with the concept of unités urbaines (urban unit): one or several communes covered by a continuously built-up area, with no distance between habitations greater than 200 meters, and a total population above 2,000 inhabitants. A commune is defined as ‘urban’ if more than 50% of its population is covered by the built-up area. If not, it is a ‘rural’ local unit2.
Table 8: Percentages of “rural” local units (2010)
Scale Name of the areas %
Cases studies ‘Pontenx’ 84 LG 81 NUTS-3 Landes 84 Lot et Garonne 82 Gironde 66 NUTS-2 Aquitaine 82 National France 79
Table 9: Population living in “rural” local units (%)
Scale Name areas 1990 1999 2009
Cases studies ‘Pontenx’ / / 44 LG / / 32.5 NUTS-3 Landes 45.2 42.1 40.2 Lot et Garonne 40.2 38.4 36 Gironde 23 19 16.8 NUTS-2 Aquitaine 35.1 29.3 27 National France 27 24.5 22.5
In 2010, rural areas still covers 81% of the French territory and 79%3 of LAU2 are rural municipalities. These percentages are even more significant in Aquitaine. Countryside make up over 88% of this region and 82%4 of LAU2 in Aquitaine are rural municipalities (Table 8). But, the percentage of population living in these rural local units is relatively low compared with the size of rural areas: 22.5% in France, 27% in Aquitaine. Moreover, these proportions are decreasing steadily (Table 9). That does not mean that rural exodus continues but rather that rural municipalities are absorbed by the expansion of urban areas. For example, in France, 1368 rural local units turned into urban unit during the period 1999-2009; while only 100 Local units became rural LAU2s (Clanché and Rascol, 2011). In Aquitaine, during the same period, 105 rural local units turned into urban units; while only 6 LAU2s became rural (Bernard, 2011). In ‘Landes of Gascony’, almost a quarter of urban units have emerged during the period 1999-2009. These dynamic suggest the decisive importance of the challenges linked to urbanization; including for a low density area as our case study.
3.1.1.3 Other functional zonings
To take into account the dynamics of periurbanisation, approaches of urban/rural processes centered on employment and services were progressively introduced. The latest version—Zonage en Aires Urbaines (ZAU 2010), a joint product of INSEE, INRA and DATAR—was issued in 2010
The ‘large urban pole’ (grand pôle urbain), the first component of this analytical classification, is defined as an urban unit providing at least 10 000 jobs. The ‘large urban area’ (grande aire urbaine) is built in an iterative way around urban poles, by including all communes, rural or not, whose 40% of potential workers have jobs in the urban area. The ‘space under influence of large urban area’ (e.g metropolitan area) is the aggregation of ‘large urban areas’ and ‘multipolarized communes’ (whose at least 40% of workers are attracted to several large urban areas).
2
http://www.insee.fr/fr/methodes/default.asp?page=definitions/unite-urbaine.htm 3
In France, there are 36 570 LAU2 and 7 700 of them are classed as urban units. 4
Figure 5: ZAU 2010
Source: Scarabello, 2011
Table 10: Distribution of local units in accordance with ZAU 2010 typology (%)
LG Aquitaine France “Metropolitan areas” Grands pôles 8.4 10.6 8.9 Couronnes 31.1 24.6 33.5 Communes multi polarisées 3.6 5.9 10.8 Total 43.1 41.1 53.2 “Middle urban Areas” Pôles moyens 1.2 1.4 1.2 Couronnes des pôles moyens 0 1.6 2.2 Total 1.2 3 3.4 “Small urban areas” Petits pôles 4.6 4.8 2.4 Couronnes des petits pôles 3.1 1.6 1.6 Total 7.7 6.4 4 “Others areas” (Rural) Autres communes multi polarisées 26.5 24.1 19.2 Communes isolées 21.4 25.5 20.2 Total 47.9 49.6 39.4
ZAU 2010 also distinguishes:
‘Middle urban area’ (moyenne aire urbaine) that is built in an iterative way around “middle poles” (between 5,000 and 10,000 jobs), by including all communes, rural or not, whose 40% of potential workers have jobs in the urban area.
‘Small urban area’ (petite aire urbaine) that is built in an iterative way around “small poles” (between 1,500 and 5,000 jobs), by including all communes, rural or not, whose 40% of potential workers have jobs in the urban area
ZAU 2010 Typology is a statistical classification but it helps us to enhance the understanding of urban dynamics in our case study (Figure 5). ‘Landes of Gascony’ and Aquitaine (NUTS-2) have almost the same urban structure: ‘metropolitan areas’ are important, but less than at the national scale, while ‘small urban areas’ and ‘others areas’ are more significant than in France. So, if ‘Landes of Gascony’ remains a predominantly rural area, more than a half of its local units are actually under urban influence (Table 10). ‘Metropolitan areas’ of Bordeaux, in the north, and Bayonne, in the South, are the two main drivers of these urban dynamics. Currently, Bordeaux area has a population of around one million and Bayonne became the second most populated urban areas in Aquitaine (250 000 inhabitants).
3.1.1.4 Key factors and spatial distributions of the population growth
Currently, the increase of population in France is mainly natural, whereas migration is the key factor of the population growth in Aquitaine and, even more, in ‘Landes of Gascony’ (Table 11). In our case study, the annual natural growth rate (births less deaths) fell steadily at least since the seventies: 0.3% during the period 1968-1975 (0.6 % in France); 0.1% during the period 1999-2006 (0.4 % in France). If this indicator stays still positive, it is solely due to the expansion and the influence of the large urban area of Bordeaux (Figure 6). Conversely, annual population growth brought by migration has a rate of faster than 1% per year during the period 1999-2006 (0.3 % in France). It is almost exactly the same as it was between 1968 and 1975 but its spatial distribution is different (Figure 7).
--- ‘Landes of Gascony’
Table 11: Average annual population growth rate during the period 1968-2006 (%) Scale Areas Average annual population growth rate 1968-1975 1982-1990 1990-1999 1999-2006 Forest area Landes of Gascony Natural 0.3 0 .1 0.05 0.1 Migrations 1.3 1 0.8 1.3 Total 1.6 1.1 0.9 1.4 NUTS-2 Aquitaine Natural 0.2 0.05 0.01 0.07 Migrations 0.3 0.6 0.4 0.9 Total 0.5 0.6 0.4 1 National France Natural 0.6 0.4 0.4 0.4 Migrations 0.2 0.1 0.01 0.3 Total 0.8 0.5 0.4 0.7
Source : (Bergouignan et al., 2011)
Figure 6: Average annual natural growth rate in LG Figure 7: Average annual net migration in LG
Source : (Bergouignan et al., 2011)
Periurbanisation :
During the period 1968-1975, population of the LG forest area has grown at an annual rate twice that of the population in France: 1.7% vs 0.8% (Table 11). At this time, periurbanisation was the key factor of the population growth (Besserie, 2007). Indeed, in the early 1970s, migrations have particularly concerned rural local units located near growing urban areas (Figure 7). Like in many others regions, the need to acquire more spacious housing and offices, the affordable land prices in the outskirts, the widespread use of private car and road facilities but also the social demand for a living environment closer to the nature scatter of both employment and property ownership towards periurban areas located further and further to urban poles. Urban sprawl was (and still is) especially strong around Bordeaux, in the north of LG, but also Bayonne and Mont de Marsan, in the south of our case study. Presently, these urban dynamics are ongoing but they are not the only factors to be considered.
Attractiveness of the coast:
Attractiveness of the coast is not a new phenomenon. But, we can consider that, in the in the early 1970s, it was especially linked to the expansion of urban area (Figure 7). Obviously, these interactions between attractiveness of the coast and periurbanisation are ongoing and are essential to understand the challenges of urbanization in ‘Landes of Gascony’. These dynamics explain the scale and the speed of urban spread surrounding Bordeaux and how Bayonne became the second most populated urban areas in Aquitaine (Bernard, 2011). However, whole of the Aquitaine coastline is nowadays concerned by the influx of newcomers and, moreover, these areas have the most important net gain from migration today. In Aquitaine, seven local units, with more 5 000 inhabitants, have a population growth above 20% during the period 1999-2006. These small poles are all located on the coastline (Breuil, 2009).
In France, whereas urban5 population has risen by 4.6% between 1999 and 2007, rural population grows by 9% during the same period (Clanché and Rascol, 2011). This process of rural resettlement is also observable in ‘Landes of Gascony’. Today, almost all the rural LAU1 have a positive net migration whereas many of these rural local units had a negative net migration during the period 1968-1975 (Figure 7). It is a significant shift for a low density area which was faced with the challenge of rural exodus until 1970s. Like at the national scale, this process can be explained primarily by the longer distance between homes and workplaces. In ‘Landes of Gascony’, 55.2% of the inhabitants live in one Local administrative unit level 1 (LAU1) and work in another, compared with 54.7% in Aquitaine and 56.8% in France (Talbot, 2001). But, more fundamentally, the key factor of the rural resettlement is a reversal in the values and representations associated with rurality. While not so long ago, rural areas and values could be seen negatively and as an obstacle to the local development, countryside becomes nowadays synonymous of nature, cultural heritages, pleasant landscape, living environment and rurality are meaningful values providing future prospects (Mora, 2008; Mormont, 2009).
3.1.1.5 Social changes in the total population
Population growth produces social reconfigurations, since 2/3 of new permanents residents come from outside ‘Landes of Gascony’. As at national and regional scales, ratio of farmers and workers (factory, construction…) in the labour force fell steadily at least since the seventies and percentage people aged over 65 are increasing. But, the spatial distribution of these dynamics is not homogeneous. Pensioners are over-represented in coastal and rural areas, while percentage of highly qualified workers is increasing in urban and sub-urban areas. Moreover, more than a half of dwellings in coastal areas are actually second homes or cottages (Bergouignan et al., 2011).
A. Age group and aging index
The significant decrease of the share of persons under 18 since 1970s result of the ageing of population in ‘Landes of Gascony’ as at the national and regional scales (Table 12). Currently, people aged over 50 account for 38.5% in the total population (38.4% in Aquitaine; 34.7% in France), whereas they represented 30.7% in 1968 (30.4% in Aquitaine; 27.8% in France). Demographic ageing, which refers to an increase in the relative weight of the elderly in the total population, seems more pronounced in Aquitaine and in ‘Landes of Gascony’ as in France. This is confirmed by the ageing index, defined by the INSEE as the ratio of the number of persons aged 65 and over, to the number of persons under 20, expressed per 100. This ageing index reaches 83 in the LG and 86 in Aquitaine, compared with only 67 at the national scale. An ageing index around 100 indicates that persons aged 65 and over and people aged under 20 are present in the same ratio. More the index is high more the result is favourable to the elderly.
Table 12: Population by age group in 1968 and 2006 (%)
Scale Areas 0-17 18-24 25-34 35-49 50-64 + 65 1968 2006 1968 2006 1968 2006 1968 2006 1968 2006 1968 2006 Forest area Landes of Gascony 29 20.9 9.9 7.5 11 11.3 19.4 21.8 16.2 19.7 14.5 18.8 NUTS-2 Aquitaine 28.4 20.3 10 8.2 11 11.9 19.2 21.2 16.7 19.1 14.7 19.3 National France 30.2 22.2 10.6 9 12.2 13 19.2 21.1 15.2 18.1 12.6 16.6
Source : Bergouignan et al, 2011
5
Peoples aged over 65, which were especially present in countryside in 1968, stay today the main age group of these areas but are also over-representing in the coastal areas (Figure 9). The age group 18 to 24 is currently concentrated near the urban poles, whereas it was rather scattered in areas where families lived in 1968 (Figure 8).
Figure 8: Age group 18 to 24 in 1968 and 2006 (%) Figure 9: People over 65 in 1968 and 2006 (%)
Source : (Bergouignan et al., 2011)
B. Social groups and occupations
France remains affected by a significant decrease in the number of active farmers, even if the rate of this decrease seems currently to be slowing down. Currently, farmers account for 1.8% in the French workforce, whereas they accounted for 9.8% in 1968 (Table 13). The ratio is almost the same in ‘Landes of Gascony’. The percentage of workers also declined, even if this professional group remains the most important in our case study. This relative decrease of workers, compared to the national scale, may be linked inter alia to the persistence of food processing and wood-industries in ‘Landes of Gascony’. But, as at the national and regional scales, this area has witnessed an effective increase of skilled professional groups like employees or managers (Table 13). The activity rate of women in Aquitaine, which is traditionally weaker than in France, has also risen: 46.3% in 1990; 67.8% in 2008. Even so, it was much lower than the activity rate of men: 75%. Half of Aquitaine women are employees (Nadeau, 2012).
Table 13: Occupational distribution of the workforce in 1968 and 2009 (%)
Scale Areas Farmers Workers Employees & intermediate professions
Managerial & intellectual occupations 1968 2006 1968 2006 1968 2006 1968 2006 Forest area Landes of Gascony 10.1 2.1 26.5 22.4 7.6 21.6 3.9 9.8 NUTS-2 Aquitaine 15.1 2.7 26.4 20.7 8.4 21.4 4.2 11.1 National France 9.8 1.8 29.5 20.9 10.9 21.7 5.2 13.7
Figure 10: Share of farmers in the workforce (1968 / 2006) Figure 11: Share of managers in the workforce (1968 / 2006)
Source: (Bergouignan et al., 2011)
The spatial distribution of these social and professional groups is not homogenous. For example, the ratio of farmers in the workforce remains important only in the center and the East of our case study, i.e. predominantly rural areas, whereas the ratio of managers in the workforce becomes significant in the sub-urban and the coastal areas (Figure 10 and 11). Linked to the ageing population but also the attractiveness of Aquitaine, the ratio of pensioners is increasing faster in these areas than in France. In the early 2000s, pensioners accounted for almost 25% in the population of this region and this ratio is still rising. During the period 1990-1999, new incomers account for 58% of the new pensioners in 1999 (Chatel, 2001).
Table 14: Percentage of pensioners in the total population (1990, 1999)
Scale Areas Pensioners
1990 1999 Forest area Landes of Gascony 18.3 24.7 NUTS-2 Aquitaine 19.3 25.3 National France 16.3 22.12
Figure 12: Percentage of pensioners in new incomers (1999)
C. Permanents residents / “present” population
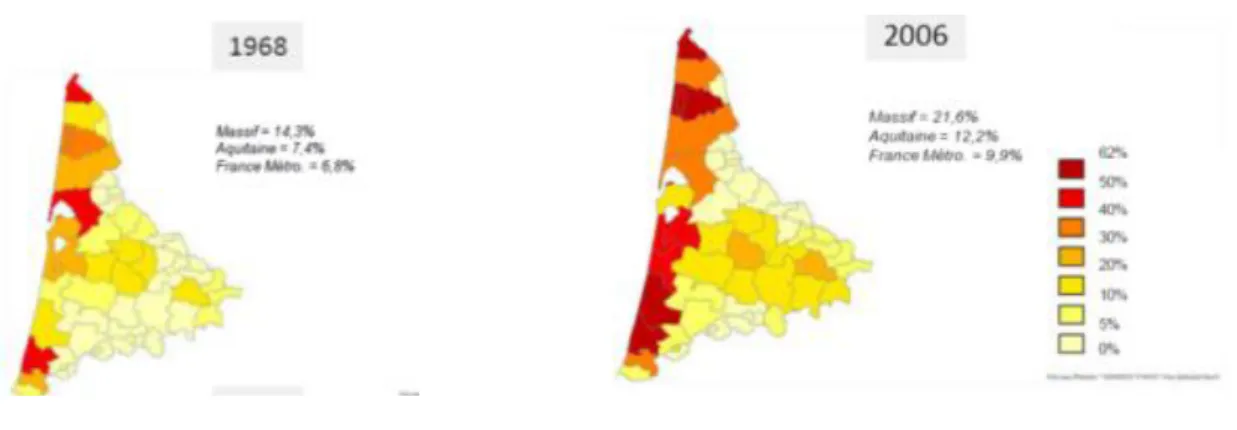
One key implication of attractiveness and mobility, especially for tourism and leisure, is that the people who are temporally present on a territory have nowadays an increasingly important role to play in the local development. In 2006, second homes or cottages account for 21.7% of the dwellings in ‘Landes of Gascony’ (12.2% in Aquitaine; 9.9% in France), whereas they accounted only for 14.3% in 1968 (7.4% in Aquitaine; 6.8% in France). Although this percentage begins to diminish with the population growth, it reaches more than 50% on the coastal areas (Figure 13).
Figure 13: Share of second homes in 1968 and 2006 (%)
Source : (Bergouignan et al., 2011)
More generally, the distinction between permanent residents, i.e. people who live in the territory, and the “present” population, i.e. people who are in the territory at a given time, becomes very important to understand income flows, especially from tourism and leisure (Terrier, 2009). It is even more significant in the cases of attractive areas. Indeed, during the summer, the maximum “present” population in the Landes is more than double that the number of permanent residents (Table 15)
Table 15: Permanent residents and ‘present’ population in three territories
NUTS-3 Permanent residents Average ‘present’ population Maximum ‘present’ population
Gironde 1,331,000 1,338,000 1,478,000
Landes 341,000 368,000 698,000
Lot et Garonne 310,000 310,000 338,000
Source : (Terrier et al., 2005)
3.1.2 Demographic development: forest owners
There are still too few studies about forest owners in France and when the statistical data exist, they are often scattered in different collection methods and different calculation modes. For example, the first National census about forestry and ownership structure (1976-1983) takes into account all the forest owners (Cavalier, 1987) but the second National survey (1999-2000) is only based on forest owners who have more than one hectare (Agreste, 2002). Moreover, a recent regional survey about ownership structure in ‘Landes of Gascony’ takes into account only the forest owners who have at least four hectares (Garnier et al., 2012). All of this limited the availability of long time series and required to refer to specific and timely data (CRPF Aquitaine, 2005; Deuffic et al., 2010; Poissonnet et al., 2007) and stakeholder’s survey. Give the overwhelming part of the privately owned in French forests (75%) and even more in ‘Landes of Gascony’ (92%), this section will focus on the private forest owners.
3.1.2.1 Average size and legal nature of ownerships A. Average size of private properties
The Landes forest is shared among some 58 000 forest owners. The average owned area is 13.9 ha (compared with 3 ha in France and 7.7 ha in Aquitaine) and even 27 ha if we consider only forest holding at least one hectare (compared with 8.8 ha and 13.3 at the regional and national scales). So, despite the homogenous appearance of the pine forest, the structure of property is typified by high disparities in ‘Landes of Gascony’. If 50% of the forest owners have less than 1 hectare, they hold
least one hectare, 18,000 hold between one and ten hectares. About 1,600 forest owners, who have
at least one hundred hectares, share 58% of the private forest estate. For one hundred fifty forest
owners, the surface of the property is larger than five hundred hectares. These forest owners hold more than a quarter of the private forest in ‘Landes of Gascony’ (Deuffic et al., 2010).
Table 16: Surfaces and numbers of forest owners in the ‘Landes of Gascony’ forest area (2006)
Areas Forest owners
Hectares Percentage Numbers Percentage
0 to 1 ha 9,698 1.2 29,141 49.9 1 to 4 ha 26,559 3.3 12,594 21.5 4 to 10 ha 41,445 5.1 6,435 11.0 10 to 25 ha 75,333 9.3 4,745 8.1 25 to 50 ha 84,307 10.4 2,386 4.1 50 to 100 ha 109,041 13.4 1,544 2.6 100 to 500 ha 288,043 35.5 1,446 2.5 500 to 1000 ha 81,497 10.0 119 0.2 More than 1,000 ha 96,300 11.9 39 0.1 Total 812,223 100 58,449 100
Source : (Drouineau and Borios, 2006)
At the scale of the ‘Pontenx’ case study, the average owned area is 31 ha and even 53 ha if we only
consider the forest owners who have more than one hectare. If, about 60% of the forest owners have
less than four hectares, they hold only 1.5% of the forest area (Table 17). Less than 6% of the forest owners, who have more than one hundred hectares, share some 70% of this area.
Table 17: Areas and numbers of forest owners in the ‘Pontenx’ case study area
Areas Forest owners
Hectares Percentage Numbers Percentage
0 to 1 ha 271 0.4 881 40.8 1 to 4 ha 751 1.1 354 16.4 4 to 10 ha 733 1.1 263 12.2 10 to 25 ha 4085 6.0 254 11.8 25 to 100 ha 14,071 20.8 279 12.9 100 to 500 ha 22,588 33.3 115 5.3 More than 500 25,283 37.3 11 0.5 Total 67,782 100 2,157 100
Source: (Poissonnet et al., 2007)
At the national scale, 83% of the forest owners have between 1 to 10 hectares, amounting to 30% of the private forest area. In the ‘Landes of Gascony’ forest area, these ratios fall to 65% and 8.5%; and even 48% and 2% at the scale of the ‘Pontenx’ case study. Conversely, forest ownerships of more than 100 ha amounts only to 25% of the private forest at the national scale but 58 % in ‘Landes of Gascony’ and even 71% at the scale of the ‘Pontenx’ case study.
Table 18: Ratio of areas and owners for forest properties over one hectare (%) 1 to 10 ha 10 to 25 ha 25 to 100 ha More than 100 ha N A N A N A N A France (1999) 83% 30% 11% 18% 5% 27% 1% 25% Aquitaine (1999) 75% 19% 16% 18% 7% 24% 2% 39% LG Forest area (2006) 65% 8.5% 16.5% 9.5% 13% 24% 5.5% 58% ‘Pontenx’ (2006) 48% 2% 20% 6% 22 % 21% 10% 71% N: Numbers; A: Areas
Forest owners’ incomes depend on various factors, among which the surface of the property ranks first. In fact, it is widely agreed that to be able to make a living with their property, Landes owners should belong at least 300 to 500 hectares (Deuffic et al., 2010). For most of them, forest is not the main income but rather a family inheritage, a capital tie up and, potentially, an additional income. Indeed, if for 90% of the Landes owners, wood production is the primary objective of the forest management, they are less than 10% among those who have between four and ten hectares to consider that incomes from sale of wood are significant (Garnier et al., 2012). Moreover, for 90 % of the Landes owners who have less than twenty five hectares, forest accounts for less than one quarter of their income. It is a little bit different for the owners who have between 100 and 500 ha. Among the latter, one in ten considers that forest ownership provides one-half of their income. Forest taxation system could be also interesting and attractive, especially for the largest owners and legal persons. Forest owned is an investment which helps to reduce, for example, the income tax. But, in the end, 75 % of the Landes owners seem to think that forest costs more than they actually gross (Garnier et al., 2012).
B. Legal nature of privately owned forests
In early 2000s, 96 % of the French private forest owners, which have more than one hectare, are natural persons and have 82 % of the forest area. These ratios are to 97 % and 87.3 % in Aquitaine, The average size of an ownership held by a legal person in this region is 55 ha, compared to only 12 ha for a natural person. These figures are higher than average sizes in France (Table 19).
Table 19: Legal nature of privately owned forests
Natural person Legal person6
N A Average Size N A Average size
National census on ownership at least 1 ha (1999) Aquitaine 97 % 87.3 12 ha 3 % 12.7 55 ha France 96 % 82 % 7.5 ha 4 % 18 43 ha Regional Survey on ownership at least 4 ha (2012) LG forest area 92 % 76 % 38 ha 8 % 24 % 260 ha N: Numbers; A: Areas
In ‘Landes of Gascony’, 92 % of the forest owners are natural persons and have 76 % of the private forest. The average size of an ownership held by a legal person in this area is 260 ha, compared to 38 ha for a natural person (Table 19). But, these data derive from a regional survey conducted only on the ownerships over four hectares. So, these results do not challenge that forest ownership is traditionally a private family matter in this area; even if it is also a more and more attractive
6
investment for legal persons. Indeed, two societies on five have been set up for less than ten years (Garnier et al., 2012). At the scale of the ‘Pontenx’ case study area, 30 % of the private forest is actually held by legal persons (Poissonnet et al., 2007).
3.1.2.2 Socio-demographic information: age, gender and occupation
There is very little socio-demographic information about forest owners (natural persons) in France and even fewer at the scales of the INTEGRAL case study area (i.e. Pontenx but also for the whole ‘Landes of Gascony’ forest area). However, some ideas could be given. First, at the national scale, the average age of forest owners is increasing since 59 % of them are aged more than 60; they were only 41 % twenty years ago (Agreste, 2002). At the regional scale, 64 % of the forest owners are aged more than 60 and they hold 67 % of the private forest (Table 20). By comparison, this age group represents only 22 % of the national population and 25 % of the regional population. In ‘Landes of Gascony’, the ageing of forest owners seems more sensitive since near half of forest owners are more than 70 y.o. and only 3 % of them have less than forty years. Average age to become forest owners is 43, generally through inheritance or gift (Garnier et al., 2012). Finally, at the scale of the ‘Pontenx’ case study, the average age of forest owners (natural persons but also legal persons) is 62 and 60 % of them are aged more 50 (Poissonnet et al., 2007). The ageing of forest owners is matter of concern which has been particular mentioned during the interviews by many stakeholders, forest experts and managers but also representatives from industries, cooperatives, devolved State services and regional authorities.
Table 20: Areas and numbers of forest owners by age group (%)
Scale Areas 30 to 39 40 to 49 50 to 59 60 to 69 70 to 79 80 and more
N S N S N S N S N S N S
NUTS-2 Aquitaine 1 2 18 14 16 16 38 32 20 27 6 8
France 5 5 16 14 19 20 27 28 24 24 8 9
N: Numbers; S: Surfaces Sources: Agreste, 2002
Then, at national scale, three forest owners out of ten are women. They hold areas closer to those of men. These ratios are almost the same in Aquitaine and this figure has not changed significantly over the past 30 years (Agreste, 2002). Among matrimonial communities, forest management is made by man in nine out of ten cases.
Finally, at national scale, 57 % of the forest owners, who have more than one hectare, are pensioners and 60 % at the regional scale. In both cases, they hold more than a half of the private forest. The percentage of pensioners among forest owners has risen steeply since twenty years (Agreste, 2002). Farmers are the second largest group, in numbers (12%) and surfaces (13%), but they have fallen steadily since thirty years. Currently, they are catching up by the groups of employees and this of managers both at the national and regional scales. Forest owners who belong to the forest based sector are still few (between 1% and 2%) but the average size of their ownerships is often the most important. Finally, worker account for 2% of the forest owner at the national scale but there is no worker among forest owners at the regional scale (Agreste, 2002).
3.1.2.3 Nationality and place of residence
At the national scale, 99% of the forest owners are French citizens. Almost all of the 1 % remaining is citizen of one of the European Community Member States and hold only 0.8% of the French forest area. Third-country citizens are very few (0.1 %) but the average size of their ownership is around 39 ha. A half of these forest owners are legal persons.
At the national scale, forest owners live mainly in rural areas since 63% of them live in local units less than 2,000 inhabitants (Agreste, 2002). Forest owners who live in the Paris region are few (3 %) but hold some 10% of the forest area. However forest owners live close to their forests. The situation is about the same at regional scale and in ‘Landes of Gascony’. Four out of five owners live in the same NUTS-3 region (“département”) as their forests. However, most regional and local stakeholders point out a withdrawal and, more generally, lack of interest for forest management from “new” owners. These opinions are difficult to confirm but there are eminently clear arguments in favor of that. First, as we have seen, in most cases forest management cannot be considered as the main source of income. Secondly, mobility plays an increasing role in ours societies. Peoples go farther away from home to build their career and lives. Thirdly, gift making and inheritance remain the most dominant mode of transmission; with consequences in terms of fragmentation of private forest holdings. A combination of these factors leads to think that “new” owners who are not living close to their forests could increase. Besides, the largest owners, and even more the legal persons, have often a remote home or head office location. For one-half of them, it is in the Paris region. In this case, delegated forest management is applied.
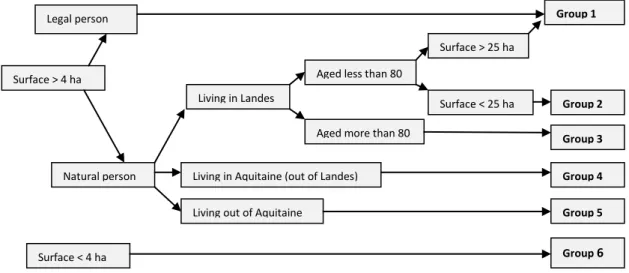
In the frame of the European project FORSEE (2007), a typology of forest owners has been proposed for the ‘Pontenx’ case study. This typology, which is based only on socio-demographic information, is presented below. There is no link between this classification and the typology built around forest owners’ behaviours (Cf. § 5.2.3).
Figure 14: Typology of private forest owners, at the scale of the ‘Pontenx’ case study (FORSEE, 2007)
Owned areas and numbers of private forest owners, by FORSEE groups at the scale of the ‘Pontenx’ case study
Numbers (%) Areas (%) Group 1 14.3 56.9 Group 2 10.6 3.7 Group 3 2.6 10.1 Group 4 7.1 17.8 Group 5 5.5 9.5 Group 6 59.9 2.0
Source: (Poissonnet et al., 2007)
Legal person
Surface > 4 ha
Natural person
Surface < 4 ha
Living in Landes
Living in Aquitaine (out of Landes) Living out of Aquitaine
Aged less than 80
Surface > 25 ha
Surface < 25 ha Aged more than 80
Group 1 Group 2 Group 3 Group 4 Group 5 Group 6
To read this typology (examples)
- Group 1: 14.3 % of the forest owners are either legal persons who have more than four
hectares or natural persons who are aged less than 80 and have more than twenty five hectares. This group belong 56.9% of the private forest at the scale of the ‘Pontenx’ case study.
- Group 5: 5.5 % of the forest owners at the scale of the ‘Pontenx’ case study are natural
persons who have more than four hectares and are living out of Aquitaine. These forest owners belong 9.5 % of the private forest at the scale of the ‘Pontenx’ case study.
3.1.3 Impacts of demographic development
Population growth based on net migration and urbanization mark an important shift in a low population density area which is dedicated to a production forest for a long time. For most of the stakeholders we met, these demographic changes seem to have more negative than positive impacts. First, forest stakeholders but also environmental NGO point out that urban sprawl and transport infrastructure projects could threats the integrity of this forest region. At the ‘Landes of Gascony’ scale, annual building-up rate is 2.3 % (1.8 % in France) during the period 2006-2009 (Mora et al., 2012). Furthermore, statistical data does not allow claiming a significant decrease of forest land in our case study since twenty years (Mora et al., 2012). However, these are only global and average views that do not take into account local land-uses change and, above all, consequences of urbanization in terms of fragmentation. Secondly, many stakeholders and forest advisers assume a connection between fire risk increase and population growth, whether this process implies urbanization or recreational activities in forest increase. But, others prefer to remember the efficiency of the regional fire prevention system (DFCI). Outdoor activities are also often being pointed at as the cause of degradation (damaged trails, litter, mushrooms picked…), even if Gascony forest was (and still is) traditionally an “open space” with tolerance of private owners. More generally, the surveys suggest that a cultural gap could widen between pines forest management and news socials demands toward forest as archetype of “nature”, pleasant living environment and landscape (see § 3.2). But, it is also necessary to remain prudent because if some problems could exist between forest owners and new inhabitants, especially about “clear cut”, these conflicts remain for the moment very occasional and mainly located on coastal areas. As a matter of fact, most mayors we met stressed the key-role of the forest in a building of a common heritage and, nowadays, the attractiveness of the region. For a forest administration of the Regional Council, if the Gascony forest must remain a production forest, it is also necessary to improve recreational functions and, more generally, ecosystem services (especially biodiversity and carbon capture and storage). But, if there is a consensus to consider forest as a regional asset, the question of “what kind of forest?” remains over and could become an increasingly significant issue.
For the moment, very few forest stakeholders interpreted population growth as an opportunity for the production forest, whether in terms of growing demands for timber products or employment. But, it is also clear that they seem more concerned by socio-demographic changes in the forest owners population that in the total population. The ageing of former owners, the increasing geographical remoteness of “new” owners (natural and legal persons) and more generally the decline of incomes related to forest ownership are trend which may raise concern. These structural factors could imply a lack of interest and engagement for the forest management. In this context, storms damages have even more shaken the confidence of owners. All this is viewed by stakeholders as a threat in the medium/long term for the Gascony forest (fire and plants risks) but also for the forest-based sector. This has to be seen in perspective since 90 % of the forest owners would