HAL Id: hal-00297089
https://hal.archives-ouvertes.fr/hal-00297089
Submitted on 9 Apr 2008
HAL is a multi-disciplinary open access
archive for the deposit and dissemination of
sci-entific research documents, whether they are
pub-lished or not. The documents may come from
teaching and research institutions in France or
abroad, or from public or private research centers.
L’archive ouverte pluridisciplinaire HAL, est
destinée au dépôt et à la diffusion de documents
scientifiques de niveau recherche, publiés ou non,
émanant des établissements d’enseignement et de
recherche français ou étrangers, des laboratoires
publics ou privés.
technique using Meteosat Second Generation SEVIRI
nighttime data
B. Thies, T. Nauss, J. Bendix
To cite this version:
B. Thies, T. Nauss, J. Bendix. First results on a process-oriented rain area classification technique
using Meteosat Second Generation SEVIRI nighttime data. Advances in Geosciences, European
Geo-sciences Union, 2008, 16, pp.63-72. �hal-00297089�
Adv. Geosci., 16, 63–72, 2008 www.adv-geosci.net/16/63/2008/
© Author(s) 2008. This work is distributed under the Creative Commons Attribution 3.0 License.
Advances in
Geosciences
First results on a process-oriented rain area classification technique
using Meteosat Second Generation SEVIRI nighttime data
B. Thies, T. Nauss, and J. Bendix
Laboratory for Climatology and Remote Sensing, Philipps-University Marburg, Germany
Received: 31 August 2007 – Revised: 1 September 2007 – Accepted: 29 January 2008 – Published: 9 April 2008
Abstract. A new technique for process-oriented rain area
classification using Meteosat Second Generation SEVIRI nighttime data is introduced. It is based on a combina-tion of the Advective Convective Technique (ACT) which focuses on precipitation areas connected to convective pro-cesses and the Rain Area Delineation Scheme during Night-time (RADS-N) a new technique for the improved detec-tion of stratiform precipitadetec-tion areas (e.g. in connecdetec-tion with mid-latitude frontal systems). The ACT which uses pos-itive brightness temperature differences between the water vapour (WV) and the infrared (IR) channels (1TWV−IR) for the detection of convective clouds and connected precipitat-ing clouds has been transferred from Meteosat First Gen-eration (MFG) Metesoat Visible and InfRed Imager ra-diometer (MVIRI) to Meteosat Second Generation (MSG) Spinning Enhanced Visible and InfraRed Imager (SEVIRI). RADS-N is based on the new conceptual model that precip-itating cloud areas are characterised by a large cloud wa-ter path (cwp) and the presence of ice particles in the up-per part of the cloud. The technique considers information about both parameters inherent in the channel differences 1T3.9−10.8, 1T3.9−7.3, 1T8.7−10.8, and 1T10.8−12.1, to de-tect potentially precipitating cloud areas. All four channel differences are used to gain implicit knowledge about the cwp. 1T8.7−10.8and 1T10.8−12.1are additionally considered to gain information about the cloud phase. First results of a comparison study between the classified rain areas and cor-responding ground based radar data for precipitation events in connection with a cold front occlusion show encouraging performance of the new proposed process-oriented rain area classification scheme.
Correspondence to: B. Thies
1 Introduction
The estimation of precipitation by means of geostationary weather satellites has a long tradition as they provide area-wide information about the distribution of this major factor of the global water cycle in a spatially and temporally high resolution.
Most of the retrieval techniques developed so far rely on the relationship between cloud top temperature in the in-frared channel and the rainfall probability and rate (e.g. Adler and Negri, 1988). Such IR retrievals are appropriate for deep convective clouds that can be easily identified in the infrared and/or water vapour channels (e.g. Levizzani et al., 2001; Levizzani, 2003) but show considerable drawbacks in the mid-latitudes (e.g. Ebert et al., 2007; Fr¨uh et al., 2007), where great parts of the precipitation originates from clouds formed by widespread frontal lifting processes in connection with extra-tropical cyclones (hereafter denoted as advective-stratiform precipitation).
These clouds are characterized by relatively warm top tem-peratures and a more homogeneous spatial distribution of cloud top temperature that differ not significantly between raining and non-raining regions. Therefore, a threshold value for cloud top temperature in the IR channel as used for deep convective clouds seems to be improper for a reliable rain area delineation and leads to an underestimation of the de-tected precipitation area in such cases.
Recently, an improved technique for the detection of en-hanced advective-stratiform precipitating cloud areas associ-ated to convective precipitation processes in the upper parts of the cloud (i.e. enhancement by generating cells in connec-tion with embedded convecconnec-tion; refer to Houze, 1993) has been proposed for MFG MVIRI (Reudenbach et al., 2007). The so-called ACT is based on the Enhanced Convective Stratiform Technique (ECST; Reudenbach, 2003; Reuden-bach et al., 2001), an improved version of the Convective-Stratiform Technique (CST; Adler and Negri, 1988; Bendix,
1997) which additionally uses the positive brightness tem-perature difference between the water vapour (WV) and the infrared (IR) channels (1TWV−IR) of MVIRI (see Schmetz et al., 1997; Tjemkes et al., 1997) for a more reliable detection of deep convective clouds (Kurino, 1997).
The phenomenon of positive 1TWV−IR is caused by the presence of water vapour in the lower stratosphere above the cloud (Fritz and Laszlo, 1993) which is transported there by deep convection with overshooting tops (e.g. Page, 1982; Kley et al., 1982). When the cloud top approaches the tropopause, it blocks lower tropospheric radiation from es-caping into space and hence, the received signal at the satel-lite level originates from the cloud top and the atmosphere aloft. As the temperature in the stratosphere increases with height, the water vapour above the cloud absorbs outgoing ra-diation from the high cloud top and emits rara-diation at higher temperatures. Because of the stronger water vapour absorp-tion lines in the WV channel compared to the IR channel of MVIRI this results in higher brightness temperatures in the WV channel. As a result, the actual brightness temper-ature difference depends on the amount of stratospheric wa-ter vapour and the location of the cloud top with respect to the tropopause. Largest values for 1TWV−IR are calculated when the cloud top reaches the tropopause inversion, where the brightness temperature in the IR channel is at a minimum (Schmetz et al., 1997; Tjemkes et al., 1997).
However, the ACT focuses only on precipitation areas connected to convective precipitation processes. This still leads to an underestimation of the detected rain area, be-cause precipitation fields formed by widespread uplifting processes in connection with extratropical cyclones which are not connected with convective processes (hereafter re-ferred to as advective-stratiform background precipitation; refer to Houze, 1993) are omitted.
In this context Thies et al. (2008) introduced a new rain area delineation scheme during nighttime for MSG SEVIRI which is based on the new conceptual model that precipi-tating cloud areas are characterised by a sufficiently large cloud water path (cwp) and the existence of ice particles in the upper cloud parts. It shows a significant improvement compared to existing retrieval techniques using only a IR threshold for cloud top temperature. This holds especially true for the above mentioned areas of advective-stratiform background precipitation.
A combination of ACT and RADS-N using MSG SEVIRI would enable an extended process-oriented classification of the detected rain area. Such a classification can form the basis for an improved rainfall rate assignment. This paper presents a first investigation of the potential regarding a pro-cess classification by merging both retrieval techniques.
As mentioned above, positive 1TWV−IRform the basis for the detection of convective clouds within the ACT. Of spe-cial interest in this context are the two water vapour (W V6.2: 5.35–7.15 µm; W V7.3: 6.85–7.85 µm) and the two infrared channels (I R10.8: 9.8–11.8 µm; I R12.1: 11.0–13.0 µm) of
SEVIRI. Because of its differing spectral resolution with re-gard to MVIRI (WV: 5.7–7.1 µm; IR: 10.5–12.5 µm), it has to be examined if and how the brightness temperature differ-ence between the WV and the IR channels of SEVIRI can be used to delineate high rain clouds equal to MVIRI. A suc-cessful adaptation of this technique is the precondition for a proper transfer of the ACT to MSG SEVIRI and a combi-nation with RADS-N. The effectual transfer of the ACT to MSG SEVIRI and its combination with RADS-N enable the process-oriented classification of the identified rainfall area.
2 Introduction of the retrieval techniques
2.1 ACT
The ACT represents an extension of the ECST originally developed for Meteosat MVIRI. The use of the WV-IR-brightness temperature differences in the ECST for the delin-eation of high rain clouds is described in detail by Reuden-bach et al. (2001) and ReudenReuden-bach (2003). Generally, pos-itive brightness temperature differences between the MVIRI WV and the IR channel indicate high rain clouds. In the ECST, positive 1TWV−IR thresholds are statistically subdi-vided to distinguish between three classes of raining cloud areas: (1) active convective areas with high precipitation in-tensities, (2) decaying convective areas within Nimbostratus clouds of enhanced stratiform precipitation intensities and (3) clouds with convective-stratiform precipitation intensities in the adjacent environment of active convective areas.
The module for the detection of enhanced advective-stratiform precipitating cloud areas (4) associated to convec-tive precipitation processes in the upper parts of the cloud is based on an iterative k-means clustering algorithm (Bradley and Fayyad, 1998) that is applied to TIR, TWVand a synthetic channel representing the standard deviation of 3 by 3 pixels in the IR channel (St dvIR). It integrates the classified cloud patterns from the ECST as core raining areas. Each cluster is reallocated into single cloud entities for which the compact-ness is calculated. A cluster is classified as raining by means of a discriminant function based on the cluster centroid tem-perature, the compactness of the cloud entity, and the number of embedded, isolated convective cores (refer to Reudenbach et al., 2007).
2.2 RADS-N
The RADS-N is based on the new conceptual model that pre-cipitation is favoured by a large cloud liquid or ice water path (cwp) and the presence of ice particles in the upper part of the cloud. The technique considers information about both parameters inherent in the channel differences 1T3.9−10.8, 1T3.9−7.3, 1T8.7−10.8, and 1T10.8−12.1, to detect potentially precipitating cloud areas. All four channel differences are used to gain implicit knowledge about the cwp. 1T8.7−10.8
B. Thies et al.: First results on a process-oriented rain area classification technique 65 and 1T10.8−12.1are additionally considered to gain
informa-tion about the cloud phase. The informainforma-tion inherent in all four channel differences is merged and incorporated into the rain delineation algorithm (refer to Thies et al., 2008).
Based on the findings of several case studies, Thies et al. (2008) used radiative transfer calculations to demonstrate that implicit information about the cloud water path as well as about the cloud phase is available from the above men-tioned four channel differences. To make use of this implicit information content they calculated rainfall confidences for the combination of the four temperature differences and showed that intervals of the channel differences representa-tive of high rainfall confidences correspond with the inter-vals indicative for large cwp and ice clouds (i.e. potentially precipitating cloud areas). Based on these results, rain area delineation is realized by a minimum threshold for the cal-culated rainfall confidences for the four temperature differ-ences.
The retrieval shows an encouraging performance as well as clear improvements compared to existing optical retrieval techniques using only IR thresholds for cloud top tempera-ture. It allows not only a proper detection of mainly convec-tive precipitation by means of the commonly used connection between infrared cloud top temperature and rainfall probabil-ity, but also enables the detection of stratiform precipitation (e.g., in connection with mid-latitude frontal systems).
3 Transfer of the ACT to MSG SEVIRI
The phenomenon of positive brightness temperature differ-ences between the WV and IR channels (1TWV−IR), which enables the detection of high rain clouds and forms the basis for the ACT rainfall retrieval, has been investigated for the WV-IR channel combinations of SEVIRI.
3.1 Positive 1TWV−IR for the detection of convective clouds
The availability of positive 1TWV−IR for the different SE-VIRI WV-IR combinations was tested using the radiative transfer model Streamer (Key, 2001; Key and Schweiger, 1998). To check if positive 1TWV−IR for the four SE-VIRI WV-IR combinations enable an appropriate detection of high-level rain clouds, the 12:00 LT radiosonde profile from Essen, Germany, for the highly convective Cologne-hail storm on 4 July 1994 was utilized for the radiative trans-fer calculations (retrans-fer to Reudenbach, 2003). An optically thick cloud with a base height of 2 km and parameterised op-tical and microphysical cloud properties typical for deep con-vective Cumulonimbus clouds (Zhang and Hongbin, 2006; Schemenauer and Isaac, 1984) was used. Table 1 summa-rizes the relevant input parameters used in the calculations. The settings are applied to simulate the resulting cloud top temperatures in each SEVIRI WV and IR channel.
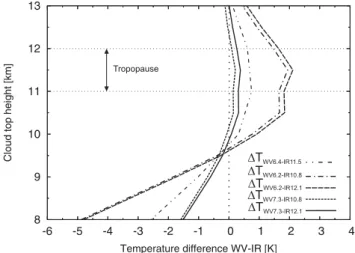
Fig. 1. Simulated 1TWV−IRfor each WV-IR channel combination
of SEVIRI and MVIRI (1TWV6.4−IR11.5) as a function of cloud
top height.
To get an idea of the development of 1TWV−IRfor a ris-ing cumulus the vertical extension of the cloud was varied between 6 and 11 km. The calculated 1TWV−IRfor different cloud top heights for each WV-IR combination of SEVIRI as well as of MVIRI is depicted in Fig. 1. As the cloud top rises, 1TWV−IRincreases and the maximum temperature dif-ference is observed when the cloud reaches the tropopause at about 11.5 km which is indicated in the radiosonde profile by an isothermal layer between 11 and 12 km. Then 1TWV−IR decreases again because the water vapour amount above the cloud top decreases with further cloud top rising. The results of the radiative transfer calculations for SEVIRI and MVIRI resemble each other and agree quite well with the findings of Schmetz et al. (1997) and Tjemkes et al. (1997) for MVIRI. Therefore, it is concluded that the approach to detect con-vective cores by means of positive temperature differences between the WV and the IR channel can be transferred to SEVIRI which also implies the option to transfer the ACT to SEVIRI.
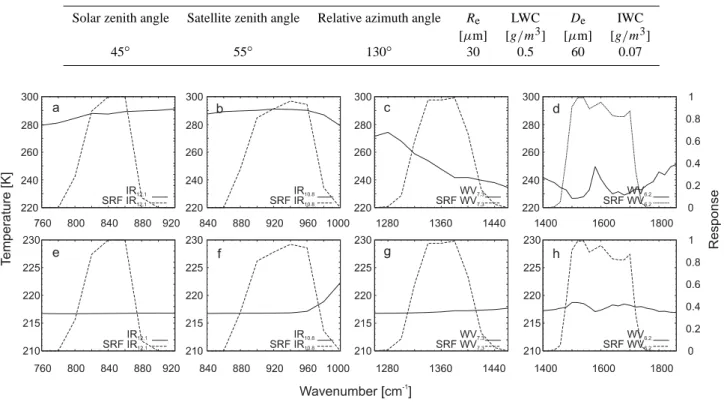
The varying amount of the calculated 1TWV−IR for each WV-IR combination can be explained by the channels spec-tral range and specspec-tral response function (SRF). For a more detailed investigation of this phenomenon, radiative trans-fer calculations were performed for each channel for both a cloud free atmosphere and a cloud reaching the tropopause with a top height at 12 km channel. The results are displayed in Fig. 2. Note that the calculated temperatures in Fig. 2 are not weighted by the SRF of the respective channel. This was done to allow a detailed analysis of the calculated tempera-tures over the complete spectral range of each channel.
In a cloud free atmosphere (Fig. 2 upper panel) the ra-diation in the infrared channels originates from the surface and the lower troposphere. Generally, the signal in the 11.0– 13.0 µm interval (I R12.1; Fig. 2a comes from slightly higher
Table 1. Input parameters for the radiative transfer calculations; Re(effective droplet radius), De(effective particle radius), LWC (liquid
water content), IWC (ice water content).
Solar zenith angle Satellite zenith angle Relative azimuth angle Re LWC De IWC
[µm] [g/m3] [µm] [g/m3] 45◦ 55◦ 130◦ 30 0.5 60 0.07
Fig. 2. Results of the radiative transfer calculations for the spectral ranges of the SEVIRI WV-IR channel combinations (solid line) together
with the SRF for each channel (dotted line). (a) to (d) results for cloud free atmosphere: (a) IR 11.0–13.0 µm (I R12.1); (b) IR 9.8–11.8 µm
(I R10.8); (c) WV 6.85–7.85 µm (W V7.3); (d) WV 5.35–7.15 µm (W V6.2). (e) to (h) results for a cloud top at 12 km: (e) IR 11.0–13.0 µm
(I R12.1); (f) IR 9.8–11.8 µm (I R10.8); (g) WV 6.85–7.85 µm (W V7.3); (h) WV 5.35–7.15 µm (W V6.2).
parts in the troposphere compared to the 9.8–11.8 µm inter-val (I R10.8; Fig. 2b, see also Schmetz et al., 2002). This is due to its higher sensitivity to water vapour absorption (Kleespies and McMillin, 1990) resulting in an emission spectrum at higher altitudes and lower temperatures. Inte-grated and weighted with the exact SRF, the brightness tem-perature in the I R12.1 channel is colder than in the I R10.8 channel.
The 5.35–7.15 µm interval (W V6.2; Fig. 2(d) covers the centre of the water vapour absorption band, whereas the 6.85–7.85 µm interval (W V7.3; Fig. 2(c) is positioned closer to its edge. Consequently, the main part of the radiation in the W V6.2channel originates from higher parts of the tropo-sphere (≈300 hPa level; see Schmetz et al., 2002) compared to the W V7.3channel where the radiation originates also from lower layers (≈500 hPa level; see Schmetz et al., 2002). In-tegrated over the spectral interval and taking into account the exact SRF, the brightness temperature in the W V6.2 channel is colder than in the W V7.3channel.
When an opaque cloud is inserted in the profile at the level of the tropopause (Fig. 2 lower panel), radiation from the troposphere is blocked from escaping into space and the
re-ceived radiation originates from cloud top and stratospheric emissions. As the temperature in the stratosphere increases with height, the emission in the I R10.8 channel results in higher temperatures than in the I R12.1channel since the ab-sorption at the edge of the I R10.8 channel increases slightly (Fig. 2f). Integrated over the spectral region and consider-ing the SRF of the infrared channels, this leads to higher temperatures in the I R10.8 as compared to the I R12.1 chan-nel. The absorption lines in the W V6.2 channel (Fig. 2h) are stronger throughout the entire spectral region compared to the W V7.3channel (Fig. 2g) resulting in higher temperatures in the W V6.2channel for the cloudy case.
In the light of the results depicted in Fig. 2 the differ-ences concerning the calculated 1TWV−IRfor each SEVIRI WV-IR combination (see Fig. 1) can be explained as fol-lows. For cloud tops below the tropopause the temperature in the W V6.2 channel is lower than in the W V7.3 channel and the temperature in the I R10.8 channel is higher than in the I R12.1channel. Thus, the minimum and maximum tem-perature differences are obtained by the W V6.2–I R10.8 and W V7.3–I R12.1combinations respectively (see Fig. 1). When the cloud top reaches the tropopause and tropospheric
radi-B. Thies et al.: First results on a process-oriented rain area classification technique 67
Table 2. Calculated validation scores for 80 spatially and temporally corresponding MVIRI and SEVIRI based ACT results between July
and August 2004.
Rain Area Rain Area Bias POD FAR CSI ETS HSS SEVIRI [%] MVIRI [%]
Whole area ACT
1TWV6.2−IR10.8 3.22 6.91 0.47 0.38 0.22 0.34 0.32 0.48 1TWV6.2−IR12.1 3.53 6.91 0.51 0.41 0.22 0.36 0.34 0.51 1TWV7.3−IR10.8 5.43 6.91 0.79 0.57 0.28 0.47 0.44 0.61 1TWV7.3−IR12.1 6.24 6.91 0.90 0.62 0.31 0.48 0.46 0.62 Advective-stratiform 1TWV6.2−IR10.8 2.14 3.15 0.68 0.19 0.73 0.12 0.11 0.20 1TWV6.2−IR12.1 2.17 3.15 0.69 0.20 0.71 0.13 0.12 0.21 1TWV7.3−IR10.8 2.75 3.15 0.87 0.27 0.68 0.16 0.15 0.26 1TWV7.3−IR12.1 2.93 3.15 0.93 0.29 0.68 0.17 0.16 0.27 Convective-stratiform 1TWV6.2−IR10.8 0.82 2.87 0.28 0.17 0.40 0.15 0.16 0.26 1TWV6.2−IR12.1 1.07 2.87 0.37 0.23 0.39 0.20 0.19 0.31 1TWV7.3−IR10.8 2.06 2.87 0.72 0.41 0.43 0.31 0.30 0.45 1TWV7.3−IR12.1 2.93 2.87 1.02 0.55 0.46 0.38 0.35 0.52
Active convective cores
1TWV6.2−IR10.8 0.14 0.70 0.19 0.05 0.74 0.04 0.04 0.08 1TWV6.2−IR12.1 0.17 0.70 0.24 0.06 0.74 0.05 0.05 0.09 1TWV7.3−IR10.8 0.35 0.70 0.49 0.11 0.78 0.08 0.07 0.13 1TWV7.3−IR12.1 0.47 0.70 0.66 0.14 0.79 0.09 0.08 0.15 Decaying convective cores
1TWV6.2−IR10.8 0.02 0.13 0.16 0.00 0.98 0.00 0.00 0.00 1TWV6.2−IR12.1 0.02 0.13 0.18 0.00 0.98 0.00 0.00 0.00 1TWV7.3−IR10.8 0.08 0.13 0.62 0.01 0.99 0.01 0.00 0.01
1TWV7.3−IR12.1 0.09 0.13 0.68 0.01 0.99 0.01 0.00 0.01
ation is blocked, the temperature in the W V6.2 channel be-comes higher than in the W V7.3 channel, whereas the tem-perature in the I R10.8 channel remains slightly higher than in the I R12.1 channel. Therefore, minimum and maximum temperature differences are calculated for the W V7.3–I R10.8 and the W V6.2–I R12.1combination respectively (see Fig. 1). 3.2 Statistical comparison of the ACT results based on
MVIRI and on SEVIRI
For a successful transfer of the ACT algorithm to SEVIRI, it has to be analysed which of the four possible WV-IR SEVIRI combinations yield the best results in reproducing the MVIRI retrieval. Therefore, the retrieved rain area by the ACT based on MVIRI data are compared to SEVIRI based ACT results. Temporally and spatially corresponding data from MVIRI and SEVIRI required for this study are available between 2004 and 2006. The current study is conducted for Cen-tral Europe and is based on 80 simultaneous MVIRI/SEVIRI scenes of July and August 2004 with sufficient precipitation intensities.
The ACT has been adapted to SEVIRI using the four pos-sible WV-IR combinations. For a proper comparison of the ACT results, MVIRI based maps were projected to the
SE-VIRI viewing geometry. The indirect validation of the dif-ferent SEVIRI WV-IR combinations with the corresponding MVIRI retrieval is conducted by applying standard valida-tion scores for dichotomous datasets: (i) bias, (ii) probability of detection (POD), (iii) false alarm ratio (FAR), (iv) criti-cal success index (CSI), (v) equitable threat score (ETS), and (vi) heidke skill score (HSS). For a detailed discussion of the verification scores see Stanski et al. (1989) or the web site of the WWRP/WGNE (2007). The statistics were cal-culated separately for each rainfall class (active convective cores, decaying convective cores, convective-stratiform, en-hanced advective-stratiform) and for the entire rain area.
The calculated validation scores used for this analysis are summarized in Table 2. In general, the 1TWV7.3−IR12.1 combination reveals the highest accordance with the MVIRI based results regardless if the entire rainfall area or one of the four individual classes is considered. The calculated val-idation scores indicate good agreement between the two sen-sors with the highest quality for the entire rain area identified by the ACT, for the classified area with enhanced advective-stratiform precipitation, and for the classified convective-stratiform precipitation area. On the other hand, the scores reflect a lower level of agreement for the detected active con-vective areas and decaying concon-vective cores. This is caused
Fig. 3. Brightness temperature [K] in the I R10.8channel (a), MVIRI-based ACT results (b), ACT results based on the SEVIRI W V7.3– I R12.1combination (c) for the 18 July 2004 1:00 UTC.
by the higher spatial resolution of the SEVIRI data (3 by 3 km at nadir) leading to smaller and more fractional areas of the detected pixels of active convection and decaying con-vection. Along with the projection of the MVIRI based ACT results (5 by 5 km at nadir) to the SEVIRI viewing geome-try this cause spatial misalignments between both data sets regarding the classified pixels. Such a projection is neces-sary because of the differing viewing geometries between both systems. The projection which is realized by a back-ward resampling with next neighbour can lead to slight spa-tial misalignments which are potenspa-tially reinforced by the lower spatial resolution of MVIRI compared to SEVIRI. Be-cause of the lower fraction of the classified rain area (see per-centage rain area in Table 2) these spatial misalignments have a strong influence on the quality of the calculated verification scores for the active convective and the decaying convective core areas. This interpretation is supported by the fact that despite the low quality of the validation results indicated by the POD, FAR, CSI, ETS, and HSS scores, the Bias and the
fraction of the classified rain area are in good accordance be-tween the MVIRI and the SEVIRI based results for the active convective and the decaying convective core areas.
Based on the results of the comparison study, the SEVIRI 1TWV7.3−IR12.1combination is identified as the appropriate channel combination to reproduce the results of the MVIRI based ACT. As a consequence, the ACT can be transferred from MVIRI to SEVIRI.
A visual inspection of the ACT results in Fig. 3b and c reveals that the spatial patterns of the identified precipita-tion areas correspond quite well between both data sets. Be-cause of the higher spatial resolution of SEVIRI, the ECST result based on the W V7.3–I R12.1combination is character-ized by a more differentiated image especially concerning the detected active convective cores. Those form smaller and less contiguous areas compared to the MVIRI results. This can be an explanation for the underestimation regarding the active convective cores indicated by the bias in Table 2.
B. Thies et al.: First results on a process-oriented rain area classification technique 69
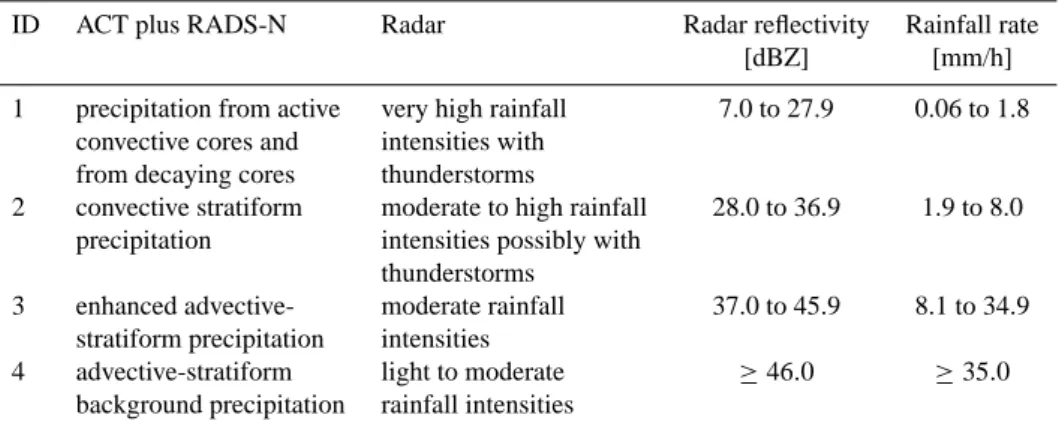
Table 3. Overview of the classified subareas (ID) within the detected rain area by the new process-oriented classification scheme (ACT plus
RADS-N) and by the radar network together with corresponding radar reflectivity and the rainfall rate.
ID ACT plus RADS-N Radar Radar reflectivity Rainfall rate [dBZ] [mm/h] 1 precipitation from active very high rainfall 7.0 to 27.9 0.06 to 1.8
convective cores and intensities with from decaying cores thunderstorms
2 convective stratiform moderate to high rainfall 28.0 to 36.9 1.9 to 8.0 precipitation intensities possibly with
thunderstorms
3 enhanced advective- moderate rainfall 37.0 to 45.9 8.1 to 34.9 stratiform precipitation intensities
4 advective-stratiform light to moderate ≥46.0 ≥35.0 background precipitation rainfall intensities
4 Process-oriented rain area classification
Following the successful transfer of the ACT to MSG SE-VIRI, the next step, a classification of the rainfall processes within the detected rain area, can be addressed.
The ACT enables a classification into (1) active convective areas with high precipitation intensities, (2) decaying con-vective areas within Nimbostratus clouds of enhanced strat-iform precipitation intensities, (3) clouds with convective-stratiform precipitation intensities in the adjacent environ-ment of active convective areas, and (4) cloud areas of en-hanced advective-stratiform precipitation intensities associ-ated to convective processes in the upper parts of the cloud. RADS-N shows significant improvements concerning the de-tection of (5) advective-stratiform background precipitation areas (refer to Houze (1993) for a detailed discussion of the respective precipitation areas with differing rainfall intensi-ties).
Therefore, a combination of the ACT and RADS-N per-mits an extended process-oriented classification of the de-tected rain area into the following five classes characterised by different rainfall intensities:
1. precipitation from active convective cores
2. precipitation from decaying convective cores within Nimbostratus clouds
3. convective-stratiform precipitation
4. enhanced advective-stratiform precipitation 5. advective-stratiform background precipitation
Within the detected rain area by RADS-N the ACT is applied to classify the above mentioned subareas of differing precip-itation processes and rainfall intensities.
5 Evaluation and case study
To gain a first impression of the performance of the new proposed process-oriented classification scheme the classi-fied subareas detected by the new technique are compared to ground based radar data by applying standard verifica-tion scores for dichotomous data. The dataset consists of 46 scenes between 30 and 31 May. During this time a cold front occlusion producing moderate to high rainfall intensi-ties together with some isolated thunderstorms passed Ger-many from the southwest to the northeast. The statistics were calculated separately for each identified area (refer to Table 3). The radar data have an original spatial resolution of 4 by 4 km2and were projected to the viewing geometry of SEVIRI with spatial resolution of 3 by 3 km2for the calcula-tion of the statistical indices. As the radar data is concerned as the reference dataset in this comparison study it has to be mentioned that precipitation estimation with radar is also connected with problems. The ground clutter problem, super refraction of the radar beam due to temperature inversions in the atmosphere and attenuation of the radar beam by pre-cipitation particles pose the greatest problems in this context (e.g. Lang, 1997; Seltmann, 1997). The calculated indices are summarized in Table 4.
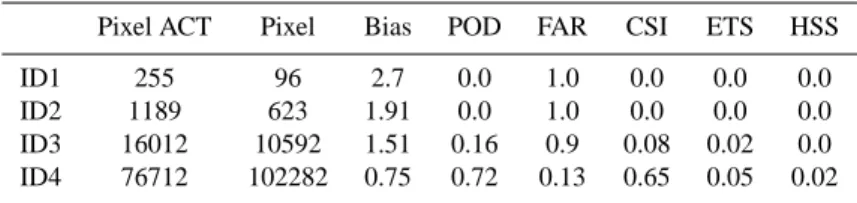
The subareas with different rainfall intensities detected by the new classification scheme (ACT plus RADS-N) and the radar network are in good accordance to each other. The bias for ID 2, ID 3 and ID 4 indicates a good agreement with the areas detected by the radar network. The bias for ID 1 points to a relatively high overestimation for this subarea by the new classification technique compared to the radar dataset. Regarding the absolute pixel amount for ID1 this high over-estimation is relativized somewhat.
The spatial misalignments between both techniques might be the result of the differing viewing geometry between the satellite scanning the cloud top and the ground based radar network scanning the cloud bottom and detecting the rainfall
Table 4. Calculated verification scores for the classified subareas (ID) by the new process-oriented classification scheme (ACT plus
RADS-N) and by the radar network for the precipitation event between 30 May 2004 19:30 UTC and 31 May 2004 23:30 UTC (altogether 46 scenes).
Pixel ACT Pixel Bias POD FAR CSI ETS HSS ID1 255 96 2.7 0.0 1.0 0.0 0.0 0.0 ID2 1189 623 1.91 0.0 1.0 0.0 0.0 0.0 ID3 16012 10592 1.51 0.16 0.9 0.08 0.02 0.0 ID4 76712 102282 0.75 0.72 0.13 0.65 0.05 0.02
intensities at the surface. The winds within the cloud and be-low the cloud bottom can displace the rain drops and cause the displayed spatial misalignments. This explanation holds also true for the higher spatial extend of the classified sub-areas, especially for ID 1 to ID 3, yielding the overestima-tion for these IDs. The high rainfall intensities detected by the new classification scheme from above might weaken be-tween the cloud top and its bottom and therefore result in lower intensities in the radar product. The cloud microstruc-ture and precipitation forming processes within the cloud to-gether with the wind field within and below the cloud can be responsible for a smaller areal extension and a decreasing rainfall intensity of the detected precipitation area below the cloud in comparison to the detected rain area by the satellite from above. Because of the indirect nature of the relationship between rainfall and IR cloud top temperature it is therefore possible that the detected rain area by means of the IR tem-perature threshold is larger than the rain area detected by the radar.
The calculated indices POD, FAR, CSI, ETS, and HSS in-dicate best results for ID 4 followed by ID 3. The low val-ues of ETS and HSS which both account for pixels correctly classified by chance compared to the CSI indicate that a rel-atively high proportion of the pixels are randomly classified as the respective ID. This phenomenon has to be analysed in more detail during extensive validation studies.
The indices for ID 1 and ID 2 indicate no skill of the new technique in comparison to the radar data. This can be explained by the potential spatial misalignments between both retrieval techniques together with the low absolute pixel amount for these subareas. Because of the lower fraction of the classified subareas these spatial misalignments have a strong influence on the quality of the calculated scores for both IDs. As the area of ID 4 is classified from the remaining pixels within the rain area that are not classified as ID 1, ID 2 or ID 3, an overestimation of the first three IDs leads to an underestimation of ID 4.
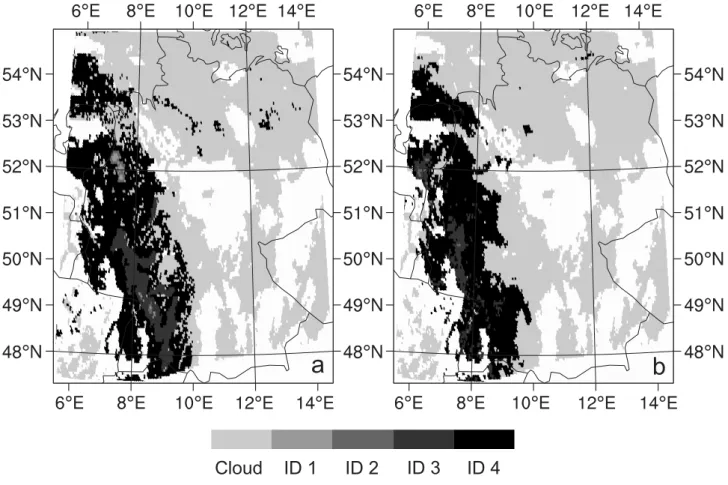
To gain a visual impression of the performance of the new proposed process-oriented classification scheme Fig. 4 illus-trates a case study for 31 May 2004 00:45 UTC. Figure 4 a shows the result of the classification scheme. The reflec-tivity classes detected by the ground based radar data from the German Weather Service (DWD, 2005) representing
dif-ferent rainfall intensities, are displayed in Fig. 4b. The cloud area displayed in Fig. 4 a and b is classified from satellite data by using the cloud mask proposed by Cermak et al. (2006). The radar were first projected to the SEVIRI viewing geom-etry.
6 Conclusions
The potential for a process-oriented rain area classification using Meteosat Second Generation SEVIRI nighttime was analysed. The proposed technique is based on a combination of the Advective Convective Technique and the Rain Area Delineation Scheme during Nighttime.
The ACT which considers positive 1TWV−IR for the de-tection of convective clouds and connected precipitating clouds has been transferred from MVIRI to SEVIRI. SE-VIRI 1TWV7.3−IR12.1combination was identified as the ap-propriate channel combination to reproduce the results of the MVIRI based ACT.
RADS-N is based on the new conceptual model that pre-cipitation is favoured by a large cloud water path and the presence of ice particles in the upper part of the cloud. The technique considers information about both parameters inherent in the channel differences 1T3.9−10.8, 1T3.9−7.3, 1T8.7−10.8, and 1T10.8−12.1, to detect potentially precipi-tating cloud areas. All four channel differences are used to gain implicit knowledge about the cwp. 1T8.7−10.8 and 1T10.8−12.1 are additionally considered to gain information about the cloud phase.
For a first appraisal, the classified rain areas by the intro-duced technique were compared with corresponding ground based radar data for a precipitation event in May 2004. The results indicate encouraging performance of the proposed technique and support the possibility of process-oriented classification of the detected rain area into subareas with dif-ferent rainfall intensities.
The presented study shows that the phenomenon of pos-itive 1TWV−IR is applicable to SEVIRI and can be used to identify convective rain clouds. The differences between the four WV-IR combinations are explained by means of radia-tive transfer calculations. Based on the obtained results it can be stated that a transfer of the ACT from MVIRI to SEVIRI
B. Thies et al.: First results on a process-oriented rain area classification technique 71
Fig. 4. Result of the new process-oriented differentiation scheme (ACT plus RADS-N) (a) in comparison to the result of the radar network (b) for 31 May 2004 00.45 UTC.
is possible even under the restriction of the differing spectral resolution between MVIRI and SEVIRI. Nevertheless, more detailed studies are needed to analyse the potential offered by the enhanced spectral resolution of SEVIRI regarding an im-provement of the ACT. Here, the presented results can help to identify potential weaknesses of the technique that can be tackled for possible improvements.
One major objective concerning a successful transfer of the ACT to SEVIRI presents the continuation beyond MVIRI in order to gain long time series of satellite-retrieved rainfall data applicable to climate change studies. Another important aspect regarding the transfer of the ACT to SEVIRI is the possibility of a process classification within the detected rain area. An improved detection of the precipitating cloud areas is the precondition for such a classification. In this context the mentioned RADS-N represents an improvement concern-ing the rain area delineation based on the enhanced spectral resolution of SEVIRI. This is especially true for precipitating cloud areas formed by widespread frontal lifting processes in connection with extra-tropical cyclones. Based on the improved rain area delineation the classification of different rainfall processes within the rain area presents an important
step regarding an improved rainfall rate assignment which forms the second step of satellite based rainfall retrievals.
In view of an improved rainfall retrieval using SEVIRI data, the present study should be considered as a first inves-tigation to analyse the potential of a possible process classi-fication within the detected rain area based on multispectral satellite data. In this context the results of the RADS-N have already demonstrated the high potential of SEVIRI concern-ing an improved rain area delineation.
The presented results show that a process classification is possible by combining a conventional IR retrieval for con-vective precipitation processes with a new and improved rain area delineation scheme based on the enhanced spectral res-olution offered by next generation weather satellites.
However, extensive and more detailed investigation is needed to further improve and refine the classification of dif-ferent precipitation processes within the rain area. In this context, special attention must be laid on the potential of-fered by the enhanced spectral resolution of SEVIRI.
Acknowledgements. The current study is funded by the German
Ministry of Research and Education (BMBF) in the framework of GLOWA-Danube project (G-D/2004/TP-10, precipitation/remote
sensing) as well as by the German Research Council DFG (BE 1780/18-1) within the SORT project.
The authors are grateful to the German weather service (DWD) for providing the radar datasets within the Eumetsat/DWD Advanced Multisensor Precipitation Experiment (AMPE).
Edited by: S. C. Michaelides
Reviewed by: two anonymous referees
References
Adler, R. F. and Negri, A. J.: A satellite technique to estimate trop-ical convective and stratiform rainfall, J. Appl. Meteorol., 27, 30–51, 1988.
Bendix, J.: Adjustment of the Convective-Stratiform Technique to estimate 1991/92 El Nino rainfall distribution in Ecuador and Peru by means of Meteosat-3 data, International Journal of Re-mote Sensing, 18, 1387–1394, 1997.
Bradley, P. S. and Fayyad, U. M.: Refining Initial Points for K-Means Clustering, In: Shavlik, J. (Edt.): Proceedings of the 15th International Conference on Machine Learning, 91–99, 1998. Cermak, J., Schneebeli, M., Nowak, D., Vuilleumier, L., and
Bendix, J.: Characterization of Low Clouds With Satellite and Ground-Based Remote Sensing Systems, Meteorologische Zeitschrift, 15, 65–72, 2006.
DWD: Weather radar network, available online at http: //www.dwd.de/en/Technik/Datengewinnung/Radarverbund/ Radarbroschuere en.pdf, last access: 11 October 2007.
Ebert, E. E., Janowiak, J. E., and Kidd, C.: Comparison of near-real-time precipitation estimates from satellite observations and numerical models, B. Am. Meteorol. Soc., 88, 47–64, 2007. Fritz, S. and Laszlo, I.: Detection of water vapor in the stratosphere
over very high clouds in the tropics, Journal of Geophysical Re-search, 98(D12), 22 959–22 967, 1993.
Fr¨uh, B., Bendix, J., Nauss, T., Paulat, M., Pfeiffer, A., Schip-per, J. W., Thies, B., and Wernli, H.: Verification of precipita-tion from regional climate simulaprecipita-tions and remote-sensing obser-vations with respect to ground-based obserobser-vations in the upper Danube catchment, Meteorologische Zeitschrift, 16, 275–293, 2007.
Houze, R. A.: Cloud Dynamics, Vol. 53 of the International Geo-physics Series, Academic Press, San Diego, 1993.
Key, J.: Streamer User’s Guide, Cooperative Institute for Meteoro-logical Satellite Studies, University of Wisconsin, 2001. Key, J. and Schweiger, A.J.: Tools for atmospheric radiative
trans-fer: Streamer and FluxNet, Computers and Geosciences, 24, 443–451, 1998.
Kleespies, T. J. and McMillin, L. M.: Retrieval of precipitable wa-ter from observations in the split window over varying surface temperatures, J. Appl. Meteorol., 29, 851–862, 1990.
Kley, D., Schmeltekopf, A., Kelly, K., Winkler, R., Thompson, T., and McFarland, M.: Transport of water vapour through the trop-ical tropopause, Geophys. Res. Lett., 9, 617–624, 1982. Kurino, T.: A satellite infrared technique for estimating
’deep/shallow’ precipitation, Advances in Space Research, 19, 511–514, 1997.
Lang, P.: Niederschlagsquantifizierung auf der Basis von Radard-aten, Promet 26, 22–32, 1997.
Levizzani, V.: Satellite rainfall estimations: new perspectives for meteorology and climate from the EURAINSAT project, Ann. Geophys., 46, 363–372, 2003,
http://www.ann-geophys.net/46/363/2003/.
Levizzani, V., Schmetz, J., Lutz, H. J., Kerkmann, J., Alberoni, P. P., and Cervino, M.: Precipitation estimations from geostationary orbit and prospects for Meteosat Second Generation, Meteorol. Appl., 8, 23–41, 2001.
Page, W.: NASA experiment on tropospheric-stratospheric water vapour transport in the intertropical convergence zone, Geophys. Res. Lett., 9, 599–624, 1982.
Reudenbach, C., Heinemann, G., Heuel, E., Bendix, J., and Winiger, M.: Investigation of summertime convective rainfall in Western Europe based on a synergy of remote sensing data and numerical models, Meteorol. Atmos. Phys., 76, 23–41, 2001. Reudenbach, C.: Konvektive Sommerniederschlge in Mitteleuropa.
Eine Kombination aus Satellitenfernerkundung und numerischer Modellierung zur automatischen Erfassung mesoskaliger Nieder-schlagsfelder, Bonner Geographische Abhandlungen, 109, 2003. Reudenbach, C., Nauss, T., and Bendix, J.: Retrieving precipitation with GOES, Meteosat and Terra/MSG at the tropics and midlat-itudes, In: Measuring precipitation form space, edited by: Lev-izzani, V., Bauer, P., and Turk, F.J., Advances in Global Change Research, 28, 2007.
Schemenauer, R. B. and Isaac, G. A.: The importance of cloud top lifetime in the description of natural cloud characteristics, J. Clim. Appl. Meteorol., 23, 267–279, 1984.
Schmetz, J., Tjemkes, S. A., Gube, M., and van de Berg, L.: Mon-itoring deep convection and convective overshooting with Me-teosat, Adv. Space Res., 19, 433–441, 1997.
Schmetz, J., Pili, P., Tjemkes, S., Just, D., Kerkmann, J., Rota, S., and Ratier, A.: An introduction to Meteosat Second Generation (MSG), B. Am. Meteorol. Soc., 83, 977–992, 2002.
Seltmann, J.: Radarforschung im DWD: Vom Scan zum Produkt., Promet 26, 32–52, 1997.
Stanski, H. R., Wilson, L., and Burrows, W.: Survey of com-mon verification methods in meteorology, World Weather Watch Technical Report No. 8, WMO, Geneva, WMO/TD No. 358, 1989.
Thies, B., Nauss, T., and Bendix, J.: Discriminating raining from non-raining cloud areas at mid-latitudes using Meteosat Second Generation SEVIRI nighttime data, Meteorol. Appl., in press, 2008.
Tjemkes, S. A., van de Berg, L., and Schmetz, J.: Warm water vapour pixels over high clouds as observed by Meteosat, Con-tributions to atmospheric physics, 70, 15–21, 1997.
World Weather Research Program/Working Group on Numer-ical Experimentation Joint Working Group on Verification (WWRP/WGNE): Forecast Verification - Issues, Methods and FAQ, available online at http://www.bom.gov.au/bmrc/wefor/ staff/eee/verif/verif web page.html, 11 October 2007.
Zhang, G., Xu, L., and Hongbin, C.: A new parameterization scheme for short-wave radiative properties of water clouds, J. Appl. Meteorol., 34, 101–106, 1995.

![Fig. 3. Brightness temperature [K] in the I R 10.8 channel (a), MVIRI-based ACT results (b), ACT results based on the SEVIRI W V 7.3 – I R 12.1 combination (c) for the 18 July 2004 1:00 UTC.](https://thumb-eu.123doks.com/thumbv2/123doknet/14785383.598554/7.892.89.810.94.625/brightness-temperature-channel-mviri-results-results-seviri-combination.webp)