Volcanic field elongation, vent distribution, and tectonic evolution
of a continental rift: The Main Ethiopian Rift example
Francesco Mazzarini
1, Nicolas Le Corvec
2, Ilaria Isola
1, and Massimiliano Favalli
11Istituto Nazionale di Geofisica e Vulcanologia, Via della Faggiola 32, 56126 Pisa, Italy
2Lunar and Planetary Institute, Universities Space Research Association, 3600 Bay Area Boulevard, Houston, Texas 77058, USA
ABSTRACT
Magmatism and faulting operate and interact in continental rifts at a vari ety of scales. The East African Rift, an example of an active magmatic conti nental rift, provides the ideal location to study the interplay between these two mechanisms. Previous work has shown that the distribution of volcanic vents and the shape of volcanic fields are linked to their tectonic environment and their magmatic system. In order to distinguish the impact of each mech anism, we analyzed four distinct volcanic fields located in the Main Ethiopian Rift; three of them (Debre Zeyit, Wonji, and Kone) are located within the rift valley, and one (Akaki) lies on the western rift shoulder. The elongation and shape of each field were analyzed based on their vent distribution using three statistical methods: the principal component analysis, the venttovent dis tance, and the twodimensional, symmetric Gaussian kernel density estima tion method. The results of these analyses show that the elongations of the fields increase from the western shoulder toward the rift axis and are inversely proportional to their angular dispersion. In addition, we observed that none of the analyzed fields have elongation that parallels either the trends of the youngest faults or the volcano alignments. Dike intrusions inferred from the alignment analysis of volcanic centers that are located within the rift axis tend to parallel the orientation of the recent active faults. This parallelism, however, decreases from the rift axis toward the rift shoulder, which has a lower strain rate and shows a larger number of preexisting fault orientations. Our results suggest that the shape of volcanic fields in the Main Ethiopian Rift is con trolled mainly by large crustal structures and/or by the lithosphereastheno sphere–boundary geometry. Diking is principally controlled by the location of the field within the rift zone; intrusions within the rift zone are controlled mostly by the state of stress and strain rate; while intrusions on the rift shoulder are controlled mostly by the presence of preexisting fractures.
This study provides a combination of statistical analyses and geological observations to study and differentiate the mechanisms involved in the forma tion of volcanic fields on Earth and, potentially, other planets.
INTRODUCTION
Magmatism and faulting operate and interact in continental rifts at a vari-ety of scales, from large lithospheric structures (e.g., mantle plumes and gra-ben) to individual faults and magmatic intrusions (e.g., Rooney et al., 2014;
LaFemina, 2015). These relationships are complex, and the competition be-tween magmatic and tectonic activity controls the overall morphology of rift zones and independent monogenetic volcanic fields. For example, dike intru-sions can localize subsidence and faulting (Rubin and Pollard, 1988; Behn et al., 2006), accommodate crustal stretching (Keir et al., 2011), and prevent slip on faults (Parsons and Thompson, 1991). Moreover, competition between tectonic stretching and unloading due to the formation of the main rift depression rules the occurrence of in-rift and off-rift volcanism (Maccaferri et al., 2014). Reveal-ing the relationship between magmatism and tectonism is, however, limited by new magmatic products, which tend to cover previous volcanic constructs and topography (i.e., fault escarpment), feeding further the debate on the rela-tionship between dikes, topography, and deformation in rifts.
Monogenetic volcanic fields are common in extensional environments (Connor and Conway, 2000; Le Corvec et al., 2013a). They are generally com-posed of small-volume, individual volcanic vents mainly basaltic in composi-tion (cinder cones, maar, tuff cones, small shield volcanoes, and lava domes; e.g., Connor and Conway, 2000; Németh and Kereszturi, 2015). Vent clustering is typical of monogenetic volcanism (Connor, 1990; Connor et al., 1992; Mazza-rini, 2007; Le Corvec et al., 2013a), and vents often form linear chains following faults (Rooney et al., 2011; Le Corvec et al., 2013a). Alignments of vents and vent elongation have been used to make inferences on the direction of local minimum compressional stress at the time of volcanic activity (e.g., Naka-mura, 1977; Tibaldi, 1995; Bosworth et al., 2003), while the overall shape of volcanic fields has been used to provide information on their feeding systems and on their regional and local tectonic structures (Spörli and Eastwood, 1997; Tadini et al., 2014).
To distinguish the role of the tectonic environment from the magma plumbing system on the shape of monogenetic volcanic fields, Le Corvec et al. (2013a) compared the shape of each studied field, defined by the major axis of the minimum-area ellipse enclosing all volcanic vents, with the trends of local and regional tectonic structures and volcanic alignments. The large numbers of vents and their clustering and preferred alignment orientations are specific to every field and often prevent an accurate reconstruction of the outline of the unique shape of a volcanic field. Therefore, in this contribution, we use different statistical methods to improve the measurement of the shape of dis-tinct volcanic fields: the principal component analysis (PCA), the vent-to-vent distance (VVD) analysis, and the Gaussian kernel density estimate methods (Connor and Connor, 2009a, 2009b; Favalli et al., 2012).
GEOSPHERE
GEOSPHERE; v. 12, no. 3 doi:10.1130/GES01193.1 7 figures; 3 tables
CORRESPONDENCE: francesco .mazzarini@ ingv.it CITATION: Mazzarini, F., Le Corvec, N., Isola, I., and Favalli, M., 2016, Volcanic field elongation, vent distribution, and tectonic evolution of a continental rift: The Main Ethiopian Rift example: Geosphere, v. 12, no. 3, p. 706–720, doi:10.1130/GES01193.1. Received 21 April 2015
Revision received 30 January 2016 Accepted 23 February 2016 Published online 7 April 2016
For permission to copy, contact Copyright Permissions, GSA, or [email protected].
The East African Rift is the prime example of an active magmatic continen-tal rift (e.g., Chorowicz, 2005; Corti, 2009) and comprises the Main Ethiopian Rift, which extends through incipient extension to continental break-up by pro-gressively increasing the amount of extension northwards, and thus allows the investigation of the rift system at various evolutionary stages (e.g., Corti, 2009; Agostini et al., 2011a).
In order to better constrain the relationship between deep magmatic pro-cesses and the crustal and/or local stress field in an extensional continental tectonic setting, we analyzed four distinct monogenetic volcanic fields that erupted in the northern and central sectors of the Main Ethiopian Rift where the tectonic and magmatic settings are well constrained (e.g., Corti, 2008, 2009; Mazzarini et al., 2013a, 2013b; Rooney et al., 2014 and references therein). The studied volcanic fields provide information on how the shape of volcanic fields and their internal structure (e.g., dikes and faults) vary across axis, from the rift shoulder (Akaki) across the marginal (border) rift zone (Debre Zeyt) to the rift axis (Wonji and Kone).
In the following sections, we first present the geological framework of the Main Ethiopian Rift and the monogenetic volcanic fields analyzed in this study. Then, we describe the different statistical methods used to quantify the shape of volcanic fields and the alignment analysis used to infer dike orientations. Next, we present the results of these analyses. Finally, we discuss the implica-tion of our findings within the context of the tectono-magmatic environment of the Main Ethiopian Rift.
GEOLOGICAL FRAMEWORK
Main Ethiopian Rift
The East African Rift System is a magmatic rift marking the boundary be-tween the Nubia and Somalia plates. The whole system records all of the different stages of rift evolution from rift initiation to break-up and embryonic oceanic spreading (e.g., Ebinger, 2005). The Main Ethiopian Rift is part of the East African Rift System and connects the Afar depression, at the Red Sea– Gulf of Aden junction, with the Turkana depression and Kenya Rift to the south. The Main Ethiopian Rift is commonly divided into three sectors: the northern, central, and southern Main Ethiopian Rift (Hayward and Ebinger, 1996; Corti, 2009; Fig. 1). Plate kinematic models constrained by GPS data and plate kine-matic indicators (i.e., seafloor spreading rates and focal mechanisms) indicate extension since at least ca. 3 Ma has been oriented N95°–100°E and occurs at an average rate of ~6 mm/yr (e.g., Chu and Gordon, 1999; Stamps et al., 2008; Kogan et al., 2012). The Main Ethiopian Rift is a Late Miocene, NE-SW (in the north) to N-S (in the south)–trending, fault-bounded basin filled by Late Mio-cene to HoloMio-cene volcanic rocks and continental sedimentary deposits. The volcano-tectonic evolution of the rift system has been divided into two main phases (e.g., Corti, 2009 and references therein). The first phase consisted of Mio-Pliocene deformation along the boundary fault systems that generated a
subsiding rift depression and asymmetric basins associated with widespread volcanic activity encompassing the whole rift depression. Starting in Late Plio-cene, the second and current phase of volcano-tectonic activity is character-ized by the transition of faulting and magmatism from the boundary faults to the rift axis, with extension occurring obliquely to the overall NE-SW trend of the Main Ethiopian Rift (Wonji fault belt; Mohr, 1967; Ebinger and Casey, 2001; Corti, 2008, 2009). The extensive magma intrusions imaged by EAGLE
39°0′0″E 39°0′0″E 38°0′0″E 38°0′0″E 9°0′0″N 9°0′0″N 8°0′0″N 8°0′0″N 7°0′0″N 7°0′0″N
SM
ER
CM
ER
NM
ER
0 25 50 100km±
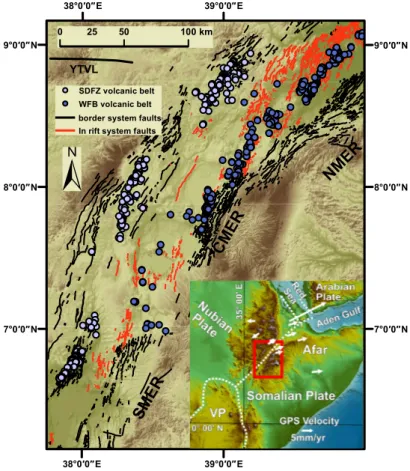
YTVL SDFZ volcanic belt WFB volcanic belt In rift system faults border system faultsFigure 1. Volcano tectonic map of the Main Ethiopian Rift (MER; after Corti, 2009). The southern Main Ethiopian Rift (SMER), central Main Ethiopian Rift (CMER), and northern Main Ethiopian Rift (NMER) segments of the Main Ethiopian Rift are shown. The two main fault systems are also displayed as well as the two main Quaternary volcanic belts in the rift. The Silti–Debre Zeyit fault zone (SDFZ) is along the western rift border, and the Wonji fault belt (WFB) is along the actual rift axis. The Yerer–Tullu Wellel volcanotectonic lineament (YTVL) is reported (after Abebe et al., 1998). Inset: Geodynamic framework of the MER; the white arrows represent the relative velocities along the East African rift system and adjoining areas in a Nubiafixed refer ence frame (after Stamps et al., 2008; Corti, 2009); the red box represents the location of the studied area shown in Figure 2A. VP—Victoria Plate.
(Ethiopia-Afar Geoscientific Lithospheric Experiment; Maguire et al., 2003) geophysical data suggest that when the deformation and the volcano-tec-tonic activity focused on the en echelon magmatic segments of the Wonji fault belt, a strong interaction between magmatic and crustal deformation processes develops. Indeed, extension within the Wonji magmatic segments is accommodated by a combination of magmatic intrusions (diking) and fault-ing (e.g., Ebfault-inger and Casey, 2001; Keranen et al., 2004; Kendall et al., 2005; Keir et al., 2006).
It is likely that the progressive thinning of the continental lithosphere under constant, prolonged oblique-rifting conditions may have controlled the migration of deformation and the resulting Quaternary volcano-tectonic seg-mentation; although the weakening related to magmatic processes and/or a
change in rift kinematics (i.e., normal to oblique extension) may have also contributed to the change in deformation style (see Corti, 2009 and references therein).
Tectonic structures within the northern and central Main Ethiopian Rift can be grouped into two distinct systems of normal faults: (1) Mid-Miocene NE-SW–trending border faults and (2) NNE-SSW–trending Quaternary–Recent in-rift faults often referred to as the Wonji fault belt, which have mostly de-veloped since ca. 2 Ma (Figs. 1 and 2A; Mohr, 1967; Morton et al., 1979; Boc-caletti et al., 1998; Chernet et al., 1998; Ebinger and Casey, 2001; Abebe et al., 2005). Prominent border fault escarpments separating the rift floor from the surrounding plateaus have lengths up to 50 km, large vertical offsets (>500 m), and spacing >1 km. By contrast, the younger Wonji faults are relatively short
! (!( ! ( ! ( ! ( ! (!(!( !( ! ( ! ( ! ( ! (!( ! (!( ! (!(!(!(!( ! ( ! ( ! (!( ! ( ! (!(!(!( ! ( ! (!( ! ( ! ( ! ( ! ( ! ( ! (!(!(!( ! ( ! ( ! ( ! (!( ! (!(!( ! ( ! ( ! ( ! ( ! ( ! ( ! ( ! ( ! (!( ! ( ! ( ! ( ! ( ! ( ! ( ! ( ! ( ! ( ! ( ! ( ! ( ! ( !( ! ( ! ( ! ( ! ( ! (!(!( ! ( ! ( ! ( ! ( ! ( ! ( ! ( ! ( ! ( ! ( ! ( ! ( ! ( ! ( ! (!( ! ( ! ( ! ( ! ( ! ( ! ( ! ( ! ( ! ( ! (!( ! ( ! (!(!( ! ( ! ( ! ( ! ( ! ( ! ( ! ( ! ( ! ( ! (!(!( ! ( ! ( ! ( !(!(!( ! (!(!( ! (!(!( ! ( ! ( ! ( ! ( ! ( ! ( ! (!(!(!( ! ( ! ( ! (!( ! (!( ! ( ! ( ! ( ! ( ! ( ! ( ! ( ! ( !( ! ( ! (!(!(!( ! ( ! ( ! ( ! ( ! ( ! ( ! ( ! (!( ! ( ! ( ! ( ! ( ! ( ! ( ! ( ! ( ! ( ! ( ! ( ! (!(!(!((!!(!(!(!( ! ( ! (!(!(!( ! ((!!(!(!((!!!((!(!(!(!(!!(!(!((!!((!(!((! ! ( ! ( ! ( ! (!( ! (((!(!!!((!!(!(!(!(!((!(!(!(!!( ! (!(!!(((!!!(!(!(( ! ( ! ( ! ( ! ( ! ( ! ( ! ( ! (!( ! (!(!(!( ! ( ! (!( ! (!(!( ! ( ! ( ! (!(!(!(!(!( ! ( ! ( ! ( ! ( ! ( ! ( ! ( ! ( ! ( ! ( ! ( ! ( ! (!( ! ( ! ( ! (!( ! ( ! ( ! (!(!( ! (!( ! ( ! (!(!(!(!( ! ( ! ( ! ( ! ( ! ( ! ( ! ( ! ( ! ( ! ( ! ( ! (!(!( ! ( ! ( ! ( ! ( ! ( ! ( ! (!(!(!(!(!( ! ( ! ( ! (!(!(!( ! ( ! (!(!( ! (!( ! ( ! (!( ! ( ! ( ! ( ! ( ! ( ! ( ! (!(!( ! ( ! (!(!( ! ( ! ( !(!(!(!(!(!( ! (!(!(!( ! ( ! (!((!(!!(!(!(!(!(!( ! ( !(!( ! ( ! ( ! ( ! ( ! ( ! (!( ! (!( ! (!( ! (!(!( ! ( ! ( !( !(
#
#
#
#
#
#
#
#
#
Kone Hertali Fentale Tullo-Moje Debre Zeyit MT. Zuqualla Bora-Bericcio Boset-Bericha 40°0′0″E 39°0′0″E 9°0′0″N 8°0′0″N 0 15 30 60km ! ( Akaki ! ( Kone ! ( Wonji ! ( Debre Zeyit lineaments#
Main Volcanoes NN Axial FaultsBorder Faults
B
NM
ER
CM
ER
A
Figure 2. (A) Structural map of the studied area with location of the volcanic vents within each field, lineaments, and main central volcanoes (after Mazzarini et al., 2013a, 2013b). Digital ele va tion model from Shuttle Radar Topography Mission (SRTM) data set (http:// www2 .jpl .nasa .gov /srtm/). (B) Rose diagrams of azimuthal distri bution of faults in the studied area. Left panel represents the frequency distribution of azimuths (radius = 160 counts); right panel represents the azimuth distribu tion weighted for the line length (radius = 3000 counts). The azimuthal ranges rela tive to the axial and border faults are also indicated. Northern Main Ethiopian Rift (NMER) and central Main Ethiopian Rift (CMER) as in Figure 1.
(typically <20 km long) and closely spaced with minor vertical throws of <100 m (Agostini et al., 2011a). Present crustal deformation is mainly localized along the Wonji fault belt (Bilham et al., 1999; Kogan et al., 2012); only minor strain concentrates along border faults (Agostini et al., 2011b).
Magmatic activity in the Main Ethiopian Rift is mostly episodic rather than continuous (e.g., WoldeGabriel et al., 1990; Corti, 2009 and references therein), and it is characterized by a bimodal composition of erupted magma (e.g., Trua et al., 1999).
The volcanic evolution of the central Main Ethiopian Rift is similar to the northern Main Ethiopian Rift, with the exception of volcanism along the west-ern and eastwest-ern rift shoulders. On the westwest-ern rift shoulder of the central Main Ethiopian Rift, large silicic volcanoes were formed in Late Pliocene (Abebe et al., 1998, 2005; Corti, 2009). On the eastern shoulder, trachytic and basaltic large central volcanoes have erupted during Pliocene times (e.g., Corti, 2009, and references therein).
A review of the magmatic evolution of the Main Ethiopian Rift is provided by Corti (2009) and can be summarized into three magmatic events—the basaltic plateau formation, the synrift volcanism, and the rift volcanism.
Basaltic Plateau Formation
The formation of the basaltic plateau results from the eruptions following the impingement of one or potentially two asthenospheric plumes at the base of the continental Main Ethiopian Rift lithosphere (Ebinger and Sleep, 1998; George et al., 1998; Pik et al., 2006; Rogers, 2006). The climax of this volcanic activity in the northern and central sectors of the Main Ethiopian Rift is dated at 31–28 Ma (e.g., Baker et al., 1996; Hoffman et al., 1997; Pik et al., 1998; Ukstins et al., 2002). This magmatic event is responsible for the 1500-m-thick plateau basalts (Trap series; Mohr and Zanettin 1988) exposed in the uplifted rift shoul-ders. During and after this peak in volcanic activity, several large shield vol-canoes developed ~30 m.y. to 10 m.y. ago on the surface of the volcanic pla-teau (e.g., Mohr and Zanettin, 1988).
Synrift Volcanism
The rift formation in the northern and central Main Ethiopian Rift started ~11 Ma ago and lasted ~7 m.y. Synrift volcanism produced widespread ignim britic deposits with intercalated minor felsic and mafic lavas dated at 6.6 Ma (WoldeGabriel et al., 1990; Wolfenden et al., 2004; Corti, 2009). On the western rift shoulder, volcanic activity gave rise to large felsic volcanoes preferentially aligned in an E-W trend along the transverse Yerer–Tullu Wellel volcano-tectonic lineament (YTVL in Fig. 1; Abebe et al., 1998; Corti, 2009). This lineament is a large lithospheric structure that formed 11 Ma ago and is believed to dissect the Moho (e.g., Keranen and Klemperer, 2008; Keranen et al., 2009).
Rift Volcanism
Volcanic activity within the rift started ~4 Ma ago and is still ongoing. In the northern Main Ethiopian Rift, basalts erupted between 3.5 and 1.6 Ma ago (Abebe et al., 2005; Corti, 2009). Between 2.5 and 1.7 Ma, pyroclastic deposits from large calderas also filled the rift valley (Chernet et al., 1998; Abebe et al., 2005; Corti, 2009). Pleistocene to present-day basalts erupted within the rift valley along with felsic eruptions from large central volcanoes and calderas, which are mainly located along the axial zone of the rift (Ebinger and Casey, 2001; Abebe et al., 2005; Corti, 2009).
In the central and northern sectors of the rift, the exposed volcanic prod-ucts consist of lava flows, ignimbrites, and pyroclastic deposits with basal-tic and rhyolibasal-tic compositions. Monogenebasal-tic activity, forming spatter cones, scoria cones, maars, and lava domes (e.g., Mazzarini et al., 1999; Abebe et al., 2005; Rooney et al., 2007; Corti, 2009), is widespread on the rift floor and the rift margins (e.g., Rooney et al., 2007). Lava domes exhibit evolved composi-tions (mainly rhyolites; 5–3 Ma), whereas cones and maars are mainly basaltic (3 Ma–Present) (e.g., Abebe et al., 2005). Basaltic activity has dominated since the Early Pleistocene (Morton et al., 1979; Chernet et al., 1998; Mazzarini et al., 1999; Abebe et al., 2005).
Monogenetic Volcanic Fields
In the Main Ethiopian Rift, due to the bimodal composition of magma-tism (e.g., Trua et al., 1999), evolved and mafic products are erupted in the same locations (cluster), with the evolved products mainly represented by large central volcanoes; while the mafic vents form within and across them, as in the case of Debre Zeyit (e.g., Mazzarini et al., 1999, 2004; Abebe et al., 2005). The isotopic signatures of erupted lavas in the volcanic fields within the Main Ethiopian Rift exhibit heterogeneities on the scale of individual vents (Mazzarini et al., 2013b). Le Corvec et al. (2013c) have shown that such hetero-geneities require different source contributions, suggesting limited interaction of the magmatic plumbing beneath adjacent monogenetic cones, and thus rul-ing out a potential connection between evolved volcanic centers and basaltic vents. Notably, magmas within a volcanic belt (see below) exhibit coherency in terms of trace-element enrichment and fractionation characteristics (Mazzarini et al., 2013b), thus suggesting the occurrence of a deep (lower- crustal) mag-matic system all along the Main Ethiopian Rift. Moreover, EAGLE data (e.g., Maguire et al., 2003; Keranen et al., 2004) clearly imaged the magmatic modi-fication of the lower crust along the Main Ethiopian Rift with major intrusions just beneath the main volcanic clusters.
In general, the definition of volcanic field is not straightforward (e.g., Canón-Tapia, 2016 and references therein)—the less restrictive definition may be that of Lockwood and Hazlet (2010): “large clusters of volcanoes with or
without a central volcano.” The spatial contiguity of volcanic constructs and
where the formation of sub-clusters is frequent (e.g., Tadini et al., 2014; Canón-Tapia, 2016).
On these grounds, the studied volcanic fields have been defined based on vent contiguity and composition of erupted products (Rooney at al., 2007; Mazza rini et al., 2013b; Rooney et al., 2014) and on their spatial association with faults (Ebinger and Casey, 2001; Mazzarini et al., 2013a).
Basaltic vents in the central Main Ethiopian Rift are located along two faulted, volcano-tectonic belts (Fig. 1) (Corti, 2009, and references therein). The Silti–Debre Zeyit fault zone belt and the Wonji fault belt are located along the western rift border and the rift axis, respectively (Mazzarini et al., 2013a, 2013b; Corti, 2009). Lineament analyses and field surveys (e.g., Williams et al., 2004; Abebe et al., 2005, 2007; Agostini et al., 2011a, 2011b; Mazzarini et al., 2013a) show two main trends that characterize fracture systems in the study area: a NE-SW trend (N40°E–55°E) that parallels the main boundary faults of the rift and a NNE-SSW trend (N15°E–36°E) that parallels the Wonji fault belt system (Fig. 2B).
In the Main Ethiopian Rift, available ages of erupted products constrain the first occurrence of volcanism in each volcanic field in the Late Pliocene–Late Pleistocene, when volcanism and deformation localized in narrow volcanic belts within the rift (Fig. 1; see Corti, 2009, and references therein). Unfortu-nately, a sparsity of available ages prevents an accurate analysis of the time- dependent evolution of the volcanic fields. The spatial distribution of volcanic vents in the Silti–Debre Zeyit fault zone and Wonji fault belt, as well as the north-ern Main Ethiopian Rift, shows clustering (Mazzarini and Isola, 2010; Mazza rini et al., 2013a, 2013b). In the axial Wonji fault belt, volcanic segments (i.e., vol-canic clusters; Mazzarini et al., 2013a, 2013b) show a right-stepping, en echelon pattern (e.g., Ebinger and Casey, 2001).
Four specific Pliocene–Quaternary volcanic clusters were analyzed in the Main Ethiopian Rift in this study: (1) the Debre Zeyit and Wonji volcanic fields, corresponding to the northernmost clusters in the Silti–Debre Zeyit fault zone and Wonji fault belt, respectively; (2) the Kone volcanic field, being the southernmost cluster along the central axis of the northern Main Ethiopian Rift (Mazza rini et al., 2013a); and (3) the Akaki volcanic field, lying on the west-ern shoulder of the rift near the Yerer–Tullu Wellel volcano-tectonic lineament (Rooney et al., 2014) (Fig. 2A).
The Akaki, Debre Zeyit, and Wonji volcanic fields are roughly aligned along a ~90-km-long, NW-SE–trending transect (Fig. 2A). The Debre Zeyit field is situ-ated on the western border within the rift valley; whereas the Wonji and Kone fields are located along the rift axis.
All the volcanic fields consist of basaltic monogenetic vents (i.e., scoria cones, maars, lava flows, and domes) and polygenetic volcano constructs (i.e., central volcanoes and calderas) (Williams et al., 2004; Abebe et al., 2005, 2007), the latter of which are not considered in this study. The Debre Zeyit, Wonji, and Kone volcanic fields comprise basaltic vents and maars that are generally younger than 2 Ma (Chernet et al., 1998; Abebe et al., 2005). In the Akaki vol-canic field, vents are 3–2 Ma old (Mazzarini et al., 1999; Abebe et al., 2005). Lava domes are characterized by evolved lavas that are Pliocene age or younger
(e.g., Abebe et al., 2005; Corti, 2009, and references therein). In the Main Ethi-opian Rift and Afar, the occurrence of basaltic volcanism is shown to predom-inate over felsic activity during periods characterized by increased extensional strain rates (Lahitte et al., 2003; Mazzarini et al., 2004).
METHODS
Vent locations were identified in Google Earth, where panchromatic SPOT images (http:// www .spotimage .com) with pixel resolutions ranging from 2.5 to 20 m allow easy detection of vents (e.g., Mazzarini and Isola, 2010).
In order to characterize the distribution of volcanic vents and shape of a particular field, we analyzed several physical and statistical parameters, in-cluding (1) vent nearest-neighbor distance; (2) average vent density; (3) azi-muthal distribution of vent alignments; (4) multivariate analysis by the prin-cipal component analysis (PCA); (5) azimuthal distribution of the segments connecting vents in the volcanic field (i.e., the vent-to-vent distribution, VVD); and (6) symmetric bivariate Gaussian kernel density. Each of these analyses is described below.
Nearest-Neighbor Distance and Vent Density
Vent nearest-neighbor distance (or vent separation, s) has been computed for the four volcanic fields. For each vent in the field, the distance to the re-spective nearest neighbor has been computed, and the basic statistic for the data set has been performed (maximum, minimum, average, and standard deviation values).
The average vent density is computed as the ratio between the number of vents in the field and the area of the convex hull, i.e., the smallest convex polygon containing all the vents.
Vent Alignments
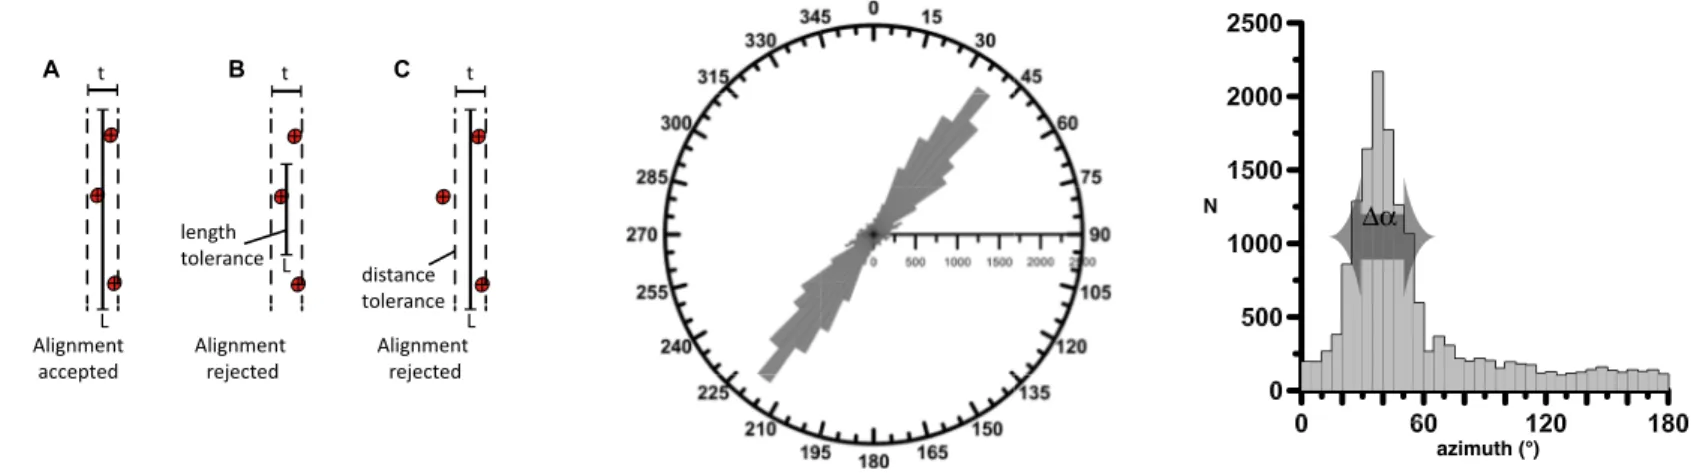
Vent alignment analyses were performed through a matrix laboratory (MATLAB) script calculating regression lines on groups of three vents (Fig. 3, left panel). To be accepted, an alignment must satisfy predetermined toler-ances (width and length in Fig. 3, left panel). A width tolerance of 50 m was used following Le Corvec et al. (2013a) and Paulsen and Wilson (2010). The length tolerance is defined on the observed spatial distribution of the volcanic vents within volcanic fields (see fig. 4 in Le Corvec et al., 2013a), where the volcanic center density for each volcanic field defined a maximal distance to generate alignments. The resulting alignments for each individual field were compared with satellite data in order to selected geologically meaningful alignments and reject artifacts. Cleft and breached cones and fissure elonga-tions were additionally used in the selection of meaningful alignments
(Muir-head et al., 2015). Alignments of volcanic vents are interpreted as a proxy for the trend of the dikes that fed the vents (e.g., Paulsen and Wilson, 2010; Rooney et al., 2011; Muirhead et al., 2015).
Principal Component Analysis
The principal component analysis (PCA) is a linear method for dimension-ality reduction, meaning that the transformed data are a linear projection of the original data set. This transformation method can also be used to explore relationships between variables (e.g., Davis, 2002; Demsar et al., 2013). Princi-pal component analysis determines the orientation of a set of orthogonal axes, or components, in an n-dimensional space, where n is the number of mea-surement parameters. The first principal component is aligned parallel to the direction of maximum variation in the data. Similarly, the second component describes the second largest source of variation within the data, and so on.
We handled vent coordinates as a pair of variables applying the PCA. The computation consists of the following steps:
1. Data scaling by translating original coordinates so that the new origin is the data barycenter (i.e., the origin of the translated data set is in the average values of the coordinate of points).
2. Computation of the covariance matrix (Q) of the N points by: Q= cov(X ,X) cov(X ,Y ) cov(X ,Y ) cov(Y ,Y ) , (1) with cov(X ,Y )= (xi− x)(yi− y) N i=1 N
∑
, (2)where N points have (xi,yi) coordinate pairs with i = 1, N, x is the mean value of
xi, and y is the mean values of yi; in our analysis, because all vent coordinates
scaled to the data set barycenter, the x and y are zero.
3. Computation of eigenvalues and eigenvectors of the matrix Q. 4. Computation of the direction (azimuth) of the largest eigenvector. The PCA analysis provides the shape (eccentricity) and direction (azimuth) parameters. Eccentricity (e) is defined from the lengths of the first (length, L) and second (width, W) eigenvectors of matrix Q as (L – W)/(L + W) and varies between 0 and 1. A value of e close to 0 is expected for a circle (L ~ W); whereas values close to 1 (L >> W) represent an elongate ellipse or, for W = 0, a line. The azimuth of the first eigenvalue of matrix Q (az – ev1), that is the direction of the first eigenvector that represents the trend of the long axis of the ellipse that fits the trend of the volcanic fields, can be used as a proxy for the field elongation.
Vent-to-Vent Distance (VVD)
The azimuth distribution of each of the N(N – 1)/2 segments connecting vent pairs has been analyzed by constructing the rose diagram and relative histograms and defining the main peak and the azimuthal dispersion (Fig. 3, central and right panels); the angular error in defining the peaks is ±3°. The angular dispersion (Da) in the histogram of the azimuth distribution of the N(N – 1)/2 segments (Fig. 3, right panel) is derived by fitting the actual azimuth
N azimuth (°)
∆α
Alignment accepted t L Alignment rejected distance tolerance t L Alignment rejected length tolerance t L B C AFigure 3. Left panel: Schematic example of the criteria used to detect alignments; any alignment consists of three points (i.e., volcanic centers). The alignment is accepted (A) if the three points are within predetermined tolerances using the length (L) and the thickness (t) of the lineament; otherwise in (B) and (C), the alignment is rejected if at least one of the points is outside the pre determined tolerances. Reworked from Le Corvec et al. (2013a). Central panel: Rose diagram of azimuths of N(N – 1)/2 segments connecting vent pairs in volcanic fields (data for Kone volcanic field). Right panel: Histogram of azimuth distribution of segments derived from the venttovent distance (VVD) analysis; the angular dispersion (Δα) parameter is also shown.
distribution with a von Mises distribution (e.g., Mardia, 1972) and evaluating the half height angular width of the curve.
The VVD works without any assumption on the time evolution of the vol-canic field. Well-aligned vents will produce a narrow well-defined peak in the azimuth distribution of segments connecting vents and small angular disper-sion. On the other hand, dispersed distribution of vents or patterned distribu-tion (e.g., en echelon vent alignments and vent clusters) will produce several peaks in the azimuth distribution of segments connecting vents with a large angular dispersion.
Error in Vent Location
The accuracy in vent location is the prime source of errors in the estimation of the parameters of the PCA, the VVD, and the nearest-neighbor analyses— namely, the azimuth of the first eigenvector (az – ev1), the eccentricity (e), the angular dispersion (Da), and the average vent separation (s).
To evaluate this error source, we introduced a random error to the original vent coordinates of each volcanic field. Then, the four parameters (az – ev1, e, Da, and s) have been computed for data sets with random error up to 100, 200, 400, 800, 1600, and 3200 m; to achieve statistical significance, 1000 runs have been performed for each error. Notably, the errors here introduced are five to more than 160 times the coarsest resolution of images used to map vents. The az – ev1 parameter varies less than 1% of the original value for every introduced error (100–3200 m) for each volcanic field. The eccentricity varies less than 2% for errors ≤1600 m and is less than 5% for errors 3200 m for the four volcanic fields.
The parameter Da varies less than 2% up to 3200 m of error for all the studied volcanic fields.
The average nearest-neighbor distance (s) for errors up to 800 m varies less than 6% for the Akaki and Debre Zeyit fields and 15%–20% for the Wonji and Kone fields.
Given the quality of images used in mapping the vents, we assume that any error induced in locating the vents appears negligible.
Symmetric Gaussian Kernel Density
The vent density distribution of each volcanic field has been computed by applying a two-dimensional, symmetric Gaussian kernel density estimate (e.g., Connor and Connor, 2009a; Kiyosugi et al., 2012):
λ(x ) =2πNh1 i 2 e −di2 2hi2 i=1 N
∑
, (3)where di is the distance between location x and the N vents, and hi is the
smoothing bandwidth for vent i. In this way, the frequency distribution of “neighbor” samples is inferred. Distance values between neighbor samples
larger than hi have a small weight in the computation of the density estimate.
A variable bandwidth value has been applied by computing the half value of the distance between each sample and its nearest sixth neighbor (Favalli et al., 2012). The vent density maps of the four volcanic fields have been created by applying Equation (3); the resulting matrix possesses cells with the appropri-ate vent density value (vent/km2).
End-Member Test
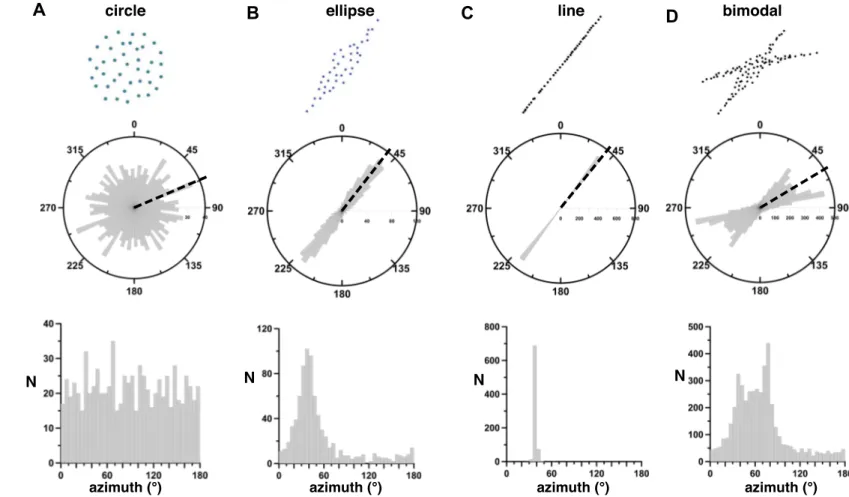
We applied the methods described above to four end-member point dis-tributions: circle, ellipse, line, and bimodal distributions. Linear and elliptical point distributions were elongate along a strike of N40° (Fig. 4). The eccentric-ity parameter recognizes the elongate pattern of the analyzed synthetic data sets, even in presence of bimodal azimuth distribution, and the angular disper-sion parameter decreases with increasing eccentricity (Table 1). The azimuth of the first eigenvector (az – ev1) calculated from the PCA matched the overall trend of the synthetic data sets.
RESULTS
Below, we present the results of the internal distribution of volcanic fields in the Main Ethiopian Rift analyzed by nearest-neighbor distance, vent align-ment analyses, and field shape from PCA and VVD analyses.
Nearest-Neighbor and Vent Alignment Analyses
The Akaki field has the largest average vent separation value (1.6 km); whereas the Debre Zeyit and Wonji fields share a similar value (~1.2 km). Nota-bly, the Kone field has an average vent separation (0.3 km) almost an order of magnitude less than the other fields (Table 2). For each studied field, we derived the respective convex hull and computed theaverage vent density. The Akaki field has the lowest vent density, and the Kone field has the highest value (Table 2).
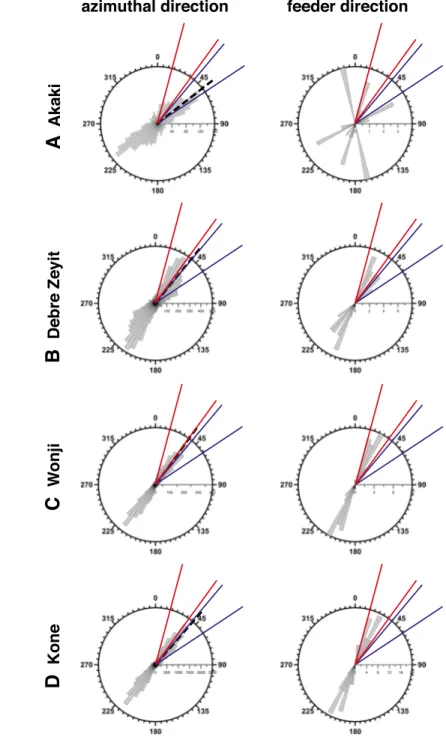
The azimuthal distribution of vent alignments, assumed as a proxy for azi-muthal distribution of dikes (e.g., Rooney et al., 2011; Di Traglia et al., 2014; Tadini et al., 2014), also varies according to the location of the fields in the rift (Fig. 5, right panels). We observe that dikes show a very large azimuthal disper-sion in the Akaki field on the western rift shoulder (Fig. 5A). On the western rift border, we observe that the dikes in Debre Zeyit field show a NNE trend similar to the youngest Wonji fault belt system (Fig. 5B); although some dikes trend parallel to the overall NE-SW trend of the rift. Dikes in the Wonji and Kone fields, located along the rift axis, are parallel to the NNE trend of the youngest Wonji fault belt system (Figs. 5C and 5D). These last results are consistent with previous studies (Ebinger and Casey, 2001; Keir et al., 2006; Corti, 2008, 2009; Rooney et al., 2011).
PCA and VVD Analyses
The volcanic field elongations (i.e., eccentricity, e) increase from the rift shoulder to the rift axis inversely proportional to their angular dispersion (Da) value (Table 3; Figs. 5 and 6). In addition, we observe that the azimuth of the first eigenvalue (az – ev1) rotates counterclockwise from N52°E in Akaki to N36°E in the Wonji volcanic field (Table 3).
Volcanic field elongations were analyzed by comparing the azimuth of the first eigenvector derived from PCA with the main peak of the VVD azi-muth distribution. As a reference, we refer to the two main structural trends in the study area as the trend of the main border fault of the rift (N40°–
circle
ellipse
line
bimodal
N
N
N
N
azimuth (°)
azimuth (°)
azimuth (°)
azimuth (°)
A
B
C
D
Figure 4. Point distributions and rose diagrams from a synthetic test for principal component analysis (PCA) and venttovent distance (VVD) methods: (A) circular point distribution (circle); (B) elliptic point distribution (ellipse); (C) linear point distribution (line); (D) bimodal point distribution. In all rose diagrams, thick black dashed line is the azimuth of first eigenvector (az – ev1) in Table 1.
TABLE 1. PARAMETERS OF PCA AND VVD ANALYSES OF END MEMBERS
Example n Trend e az – ev1 ∆α
Line 40 N40°E 0.99 39 3°
Ellipse 40 N40°E 0.64 38 40°
Circle 40 – 0.02 67 90°
Bimodal 95 N33°E–N78°E (N57°E) 0.48 59 60°
Note: Trend—direction of the elongation of the synthetic data set; the bimodal example has indicated the azimuth of the two peaks and of the bisecting line is in parentheses; e—eccentricity; az – ev1—azimuth first eigenvector; ∆α—azimuthal dispersion in the VVD histogram; n—number of points in each data set; PCA—principal component analysis; VVD—vent-to-vent distance.
55°E) and the trend of the active axial Wonji fault belt system (N15°–36°E) (Fig. 2B).
The Akaki field, located on the west rift shoulder, has the main peak of VVD azimuth distribution trending 53°E, parallel to the azimuth of the field elonga-tion (52°E), i.e., the azimuth of the first eigenvector derived from PCA (Fig. 5A, left panel). For the Akaki field, both PCA and VVD analyses indicate that the field’s elongation is parallel to the main border fault of the rift.
The Debre Zeyit field elongation (i.e., the azimuth of the first eigenvector, Table 3) trends 39°E and shows a maximum VVD azimuth distribution at 34°E (Fig. 5B, left panel). The small clockwise rotation (5°) of the field elongation with respect to the VVD azimuth distribution is larger than the error associated to the definition of the VVD azimuth (±3°). The Debre Zeyit elongation lies between the trend of the main border faults of the rift and the trend of the axial Wonji faults.
The Wonji field has similar values to Debre Zeyit with its elongation trend-ing 36°E (Table 3) and its maximum of VVD azimuth distribution at 34°E (Fig. 5C, left panel). Both values point to a field elongated parallel to the trend of the axial Wonji faults.
Finally, the Kone field has its elongation trending at 41°E (Table 3) and max-imum of VVD azimuth distribution at 34°E (Fig. D, left panel). The Kone field shows an elongation (by PCA) parallel to the trend of the main border faults of the rift, whereas the main peak of the VVD azimuth distribution parallels the trend of the axial Wonji faults.
Comparison between Dike Orientations and Field Shape
Dikes are expressed at the Earth’s surface by alignments of volcanic centers (Connor et al., 1992; Paulsen and Wilson, 2010; Rooney et al., 2011; Muirhead et al., 2015). Vent alignments in each volcanic field have been mapped and their azimuthal distributions plotted in rose diagrams (Fig. 5, right panels).
Dikes in the Akaki field show no preferred trend parallel to the azimuths of elongation from PCA and VVD analysis (Fig. 5A, left and right panels), thus showing no relationships with the two main structural trends in the rift (Fig. 5A, right panel).
Dikes in the Debre Zeyit field show N20°–25°E– and N35°–40°E–trend-ing peaks that partially align with the azimuths of elongation from PCA and
VVD analysis. In addition, some dikes align with the trend of the main border faults of the rift, and only a few dikes parallel the Wonji faults (Fig. 5B, left and right panels).
In the Wonji and Kone volcanic fields, dikes parallel the trend of the Wonji faults (N15°–30°E) and are oblique to the azimuths of elongation from PCA and VVD analyses (Figs. 5C and 5D, left and right panels).
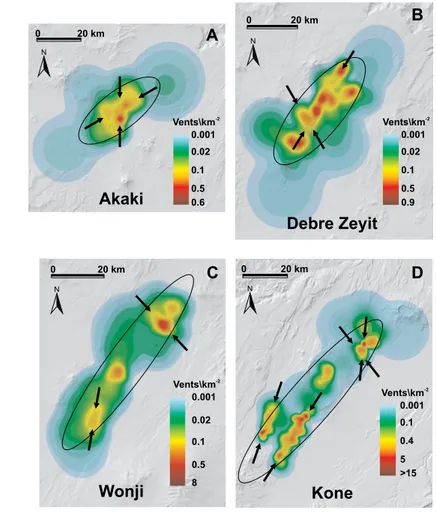
The overall elongate pattern of the volcanic fields is also apparent when comparing each vent density distribution with the ellipses derived from the PCA analysis. By applying Equation (3), we produced the vent density maps of volcanic fields (Fig. 6). The vent density maps clearly show uneven vent distribution with areas (maxima) of high vent density.
The vent densities shown in Figure 6 indicate that the Wonji (maximum: 0.8 vent/km2; 25th percentile: 0.2 vent/km2; average: 0.4 vent/km2), Debre Zeyit
(maximum: 0.9 vent/km2; 25th percentile: 0.2 vent/km2; average: 0.3 vent/km2),
and Akaki (maximum: 0.6 vent/km2; 25th percentile: 0.2 vent/km2; average:
0.4 vent/km2) fields share quite similar average density values, whereas the
Kone field (maximum: 17.4 vent/km2; 25th percentile: 0.7 vent/km2; average: 1.9
vent/km2) shows the highest density of vents.
The density maps show several maxima with preferred elongations that are variably oriented, and notably, only in very few cases, these parallel the PCA elongation (Fig. 6). In the Akaki field, vent density maxima are quite variable, exhibiting elongations trending N-S and N60°E (thick black arrows in Fig. 6A). Moving within the rift, the Debre Zeyit field, located at the western rift border, has prominent maxima elongations trending N30°E and N150°E (Fig. 6B) non-parallel to the ellipse. The Wonji field shows density maxima with an elongation trending N15°N, almost parallel to the trend of Wonji faults (e.g., Mohr, 1967), as well as a N135°E-trending elongation (Fig. 6C). In the Kone field, density maxima show elongations parallel to the trend of the Wonji faults (i.e., N20°E, N30°E directions in Fig. 6D), as well as N-S and N150°E-elongated density maxima (Fig. 6D).
DISCUSSION
The formation of volcanic fields results from the interaction between the existing crustal fracture networks, crustal stress state, and magma supply rate (e.g., Takada, 1994; Connor and Conway, 2000; Le Corvec et al., 2013a; Aco-TABLE 2. BASIC STATISTICS OF VENT DISTRIBUTION
Volcanic
field nv Vent density(km–2)
Max s (km) Min s(km) (km)s (km)σ (m)Xb (m)Yb Akaki 59 7.3 × 10⁻² 8.1 0.1 1.6 1.3 481368 976059 Debre Zeyit 101 9.6 × 10⁻² 8.3 0.2 1.2 1.5 498301 964568 Wonji 69 8.0 × 10⁻² 7.9 0.1 1.1 1.3 524687 920007 Kone 178 31.1 × 10⁻² 5.0 0.03 0.3 0.5 573090 967989
Note: nv—number of vents in the volcanic field; max s—maximum separation between vents derived from nearest neighbor analysis; min s—minimum separation between vents; s—average separation between vents; σ—standard deviation of separation; Xb and Yb—volcanic field barycenter in Universal Transverse Mercator (UTM) coordinates.
cella, 2014). Below we discuss the results derived from the spatial distribution of vents in terms of the inner structure of volcanic fields and their shape.
The spatial analysis of vents that we performed in the volcanic fields does not account for the space-time evolution of volcanism. The defined shapes and patterns are the final product of the whole field history, from the first occur-rence of volcanism to the latest eruptive events.
Inner Structure of Volcanic Fields
Moving from the rift shoulder to the rift axis, our results show that dikes in the different fields tend to become more parallel to the NNE-SSW trend of active deformation (seismicity and GPS data) and volcanism.
Volcanic alignments represent the direction of dikes that propagated into either newly formed cracks, oriented perpendicular to the direction of the least principal stress (s3) (e.g., Delaney et al., 1986), or through the exploitation or influence of preexisting faults (Connor et al., 2000; Gaffney et al., 2007; Le Cor-vec et al., 2013b; Isola et al., 2014; Athens et al., 2016; Maccaferri et al., 2015). In the latter case, the orientation of the observed volcanic alignments may not represent the contemporaneous stress field. Instead, the final dike orientation is the product of the competition between the magma overpressure, differen-tial stress, and weaknesses in the host rock (e.g., Jolly and Sanderson, 1997).
Dikes in the Akaki field exhibit multiple orientations (Fig. 5A). These vents are located on the western rift shoulder, where geodetic data reveal lower crustal strain rates than the rift axis (Kogan et al., 2012), and crustal thickness is greater than in the rift depression (Prodehl et al., 1997; Maguire et al., 2003).
The Debre Zeyit field, located on the western rift border, experienced mod-erate crustal strain (Kogan et al., 2012). Some dikes in Debre Zeyit are parallel to the trend of the actual Wonji fault belt (Fig. 5B).
azimuthal direction
feeder direction
A
A
kak
i
B
Debre Zeyi
t
C
Wo
nji
D
Kone
Figure 5. Results from principal component analysis (PCA), venttovent distance (VVD), and vent alignments analysis, respectively. In each row: left panel, rose diagrams of the azimuth distribution of the VVD analysis, the thick black dashed line is the azimuth of first eigenvector (az – ev1) derived from the PCA analysis; right panel, rose diagrams of dikes direction derived from the vent alignment analysis (Le Corvec et al., 2013a). In the rose diagrams, the azimuthal range of NWSE–trending border faults (blue lines) and the azimuthal range of the axial NNE SSW–trending Wonji fault belt (WFB) (red line) are reported. (A) Akaki field; (B) Debre Zeyit field; (C) Wonji field; and (D) Kone field.
TABLE 3. PARAMETERS OF PCA AND VVD ANALYSES OF VOLCANIC FIELDS
Akaki vf Debre Zeyit vf Wonji vf Kone vf
e 0.44 0.48 0.69 0.92
az – ev1 52° 39° 36° 41°
∆α 70° 55° 35° 38°
Note: e—eccentricity; az – ev1—azimuth first eigenvector; ∆α—azimuthal dispersion in the VVD histogram; PCA—principal component analysis; vf—volcanic field; VVD— vent-to-vent distance.
The Wonji and Kone fields, with dikes parallel to Wonji faults (Figs. 5C and 5D), are in zones where most of the actual crustal strain occur (e.g., Bilham et al., 1999; Ebinger and Casey, 2001; Kogan et al., 2012) and where volcanism is strictly associated to deformation as shown by seismic, structural, and vol-canic data (Mazzarini et al., 2013a).
Higher strains within the rift tend to control the orientation of dikes, such as in the Wonji and Kone fields. As the thickness of the crust increases, the volume of magma within the dike decreases. These dikes tend to be more
influenced by preexisting fractures as shown by Le Corvec et al. (2013b), thus showing a larger number of orientations, such as in the Akaki field. At the border of rift, the orientation of the dikes in the Debre Zeyit field cannot distin-guish between the influence of the strain and of preexisting fractures.
Shape of Volcanic Fields
In a recent review, Acocella (2014) analyzed stratovolcanoes and volcanic fields in convergent and divergent plate margins, where the shape factor of a volcanic field was defined as the ratio between the width and the length of the field. This shape factor varies between 1 (circular shape) to 0 (very elongated, linear shape). According to the analysis of Acocella (2014), volcanic fields formed in divergent tectonic settings (i.e., Main Ethiopian Rift and Afar) exhibit a systematic increase in field elongation (i.e., low values of the shape factor) with increasing extension rate and decreasing crustal thickness.
The elongations of the analyzed volcanic fields presented here are consis-tent with assertions of Acocella (2014). Indeed, the increase in crustal strain from the western rift border to the rift axis (e.g., Kogan et al., 2012) corresponds to an increase in the eccentricity of volcanic fields from Akaki on the rift shoul-der to Wonji within the rift axis (Table 3 and Fig. 5).
The elongation of the Akaki volcanic field parallels the main NE-SW rift trend (N40°E–55°E), whereas the other fields located on the border (Debre Zeyit) and within the rift (Wonji and Kone) show a 15°–20° clockwise rotation of their elongation relative to the main rift trend. In none of the volcanic fields does the elongation (first eigenvector azimuth from PCA analysis) parallel the NNE-SSW trend (N15°E–36°E) of actual faulting and volcanism in the Wonji fault belt (e.g., Mohr, 1967) or the trend of the youngest and active faulting and volcanism in the Main Ethiopian Rift (e.g., Mazzarini et al., 2013a).
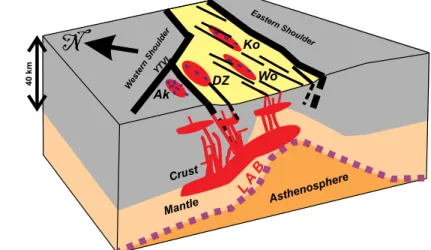
The fact that the shape of the volcanic fields does not parallel the trend of the actual faulting and volcanism (i.e., the Wonji fault belt trend), even in the fields located along the axis of the rift, may result from the combination of two main processes. (1) The oblique rift kinematics controlling the pattern of deformation and volcanism along the rift (e.g., Corti et al., 2003; Corti, 2008; Keir et al., 2015) may produce the en echelon, right-stepping pattern of vol-canic segments (Ebinger and Casey, 2001; Corti, 2008). Such pattern is also present at the scale of each volcanic field promoting the clockwise rotations of the overall elongation of the field. (2) The other contributing factor may be the control of large-scale crustal structures such as the rift border faults and/or deep mantle structures, assuming that the volcanic field shape is the footprint of deep magmatic reservoirs (e.g., Tadini et al., 2014) (Fig. 7).
The parallelism between dikes and axial faulting decreases in the Debre Zeyit field located on the rift border and completely vanishes at the Akaki vol-canic field on the rift shoulder, where dikes show a dispersed trend (Fig. 5). The Akaki field is sitting in the zone where two lithospheric fault systems inter-sect—the inherited ~E-W–trending Paleozoic shear zone (Yerer–Tullu Wellel volcano-tectonic lineament; Abebe et al., 1998) and the main NE-SW–trending
A
0 20 km Vents\km-2 0.001 0.02 0.1 0.5 0.6B
0 20 km Vents\km-2 0.001 0.02 0.1 0.5 0.9C
0 20 km Vents\km-2 0.001 0.02 0.1 0.5 8 Vents\km-2 0.001 0.1 0.4 5 >15 0 20 kmD
Wonji
Kone
Akaki
Debre Zeyit
Figure 6. Vent density distribution maps from applying Equation (3) to the analyzed vent fields; the density matrices have cells with 119 m size corresponding to an area of 14 × 10–3 km2. The black arrows indicate the preferred elongation of the vent density maxima. In all maps, the ellipse derived from the respective eigenvectors of the principal component analysis (PCA) is sketched (black ellipse). (A) Akaki field; (B) Debre Zeyit field; (C) Wonji field; and (D) Kone field.
rift border faults. The fact that dikes have dispersed trend (dikes parallel to the rift trend have not been observed) may be explained by the role of magmatic overpressure (Parsons and Thompson, 1991) in a mechanically weakened crust generated by the large amount of magmatic fluid at depth as indicated by seismological and geochemical data (e.g., Rooney et al., 2014).
Such a dichotomy between the overall shape of volcanic fields and the indi-vidual orientations of inferred dikes (Fig. 5) might suggest that different mech-anisms operated to construct the actual vent distribution (Fig. 7).
At shallow crustal levels, in the volcanic fields within the Main Ethiopian Rift (Debre Zeyit, Wonji, and Kone), dikes parallel active faulting in the zones where the actual strain is the most localized (e.g., Bilham et al., 1999; Kogan et al., 2012). Such a parallelism is particularly evident within the fields located in the rift axial zones (Wonji and Kone; Figs. 5 and 6); along the rift axis, crustal extension keeps pace with magmatic intrusion rates allowing dikes to emplace within faults and fractures oriented normal to the regional extension direction (e.g., Ebinger and Casey, 2001; Kogan et al., 2012; Maccaferri et al., 2015). Be-neath these volcanic segments, elevated wave speeds (>6.8 km/s) have been interpreted as evidence for gabbroic intrusions in the crust (Keranen et al., 2004; Mackenzie et al., 2005). In the rift axis, actual separation between the Nubia and Somalia plates occurs via dike injection, which is also observed in the Afar during the Dabbau magmatic-tectonic event in 2005 (Wright et al., 2006). Moreover, during this tectonic-magmatic event, the deformation in-duced by the dike intrusion may have promoted subsequent and successive intrusions (e.g., Hamling et al., 2010).
On the other hand, the volcanic field shapes and elongations may track the shape of deep magma reservoirs (e.g., Tadini et al., 2014), whose location and shape in continental rifts may be controlled by large crustal-scale rift bor-der faults and by lithospheric mantle geometry beneath the rift. Recent works show the importance of the preexisting geometry of the base of the lithosphere in governing melt migration beneath the rift (e.g., Bastow et al., 2005, 2008; Keir et al., 2015), and thus the shape of deep magma reservoirs. The elevated SKS-splitting delay times at the flanks of the Main Ethiopian Rift support a mechanism of enhanced melt production and melt migration along steep gra-dients at the lithosphere-asthenosphere boundary (LAB) beneath the margins of the Main Ethiopian Rift (e.g., Kendall et al., 2005; Holtzman and Kendall, 2010). Moreover, the observed highest mantle anisotropy beneath the rift bor-der faults has been interpreted as being due to the enhanced melt extraction and flow along the steep gradient at the LAB (Kendall et al., 2005).
Along the East African Rift, structural grain and state of strain in the upper crust have been proposed to control the formation of elliptical calderas in the Kenya Rift (Bosworth et al., 2003; Robertson et al., 2015) and the alignment and elongation of monogenetic vents and volcanoes in the Tanzanian Divergence (Isola et al., 2014).
We provide further examples that support these observations. In general, the analysis of the spatial distribution of monogenetic vents in extensional tectonic settings by applying statistical methods (PCA and VVD) may provide: (1) insights about the gradients of crustal strain state and/or the crustal thick-ness; and (2) clues about the occurrence or relevance of oblique extension in the evolution of rifts through the analysis of the angular variations between the azimuth of elongation of the PCA ellipse (i.e., ev1 – az) and the dikes and orientations of eruptive fissures.
These methods could be effectively performed in other rift zones such as in Afar (e.g., Mazzarini, 2007) or in Iceland (e.g., Tentler and Temperley, 2007), as well as in large volcanic provinces on other planets, such as in the Tharsis volcanic region on Mars (e.g., Platz et al., 2015).
CONCLUSIONS
The analysis of shape, orientation, and structure of monogenetic volcanic fields located in continental extensional settings may provide useful hints in the role of lithospheric- and crustal-scale magmatic and tectonic processes. Our results show that the overall elongation of volcanic fields (i.e., field elon-gation) results from the controls of: (1) large crustal-scale structures (e.g., main border faults of the rift); and/or (2) by the lithosphere-asthenosphere–bound-ary geometry (e.g., Bastow et al., 2005); and (3) particular patterns within the volcanic field (i.e., en echelon vent alignments) due to the rift kinematics (Ebin-ger and Casey, 2001; Corti, 2008).
On the other hand, dikes occur at shallower levels and, depending on the lo-cation of the field within the rift zone, may either be controlled by upper-crustal stress and strain state or the local preexisting fractures. Overall, in tectonically
N
Ak DZ Wo Ko Wes tern Shoulde r Eastern Shoulde r YTVL Asthenosph ere Mantle Crust 40 kmLA
B
Figure 7. Cartoon of the proposed relationships between volcanic field shape, dikes trend, and uppermantle and lithosphericscale structures in the central northern Main Ethiopian Rift (MER). YTVL—Yerer–Tullu Wellel volcanotectonic lineament (Abebe et al., 1998); Ak—Akaki vol canic field; DZ—Debre Zeyit volcanic field; Wo—Wonji volcanic field; Ko—Kone volcanic field; LAB—lithosphereasthenosphere boundary. Not to scale.
active rifts, the shape of volcanic fields—in particular, their elongation—may provide information about the crustal strain state and the possible role of lithospheric architecture controlling the distribution of magma reservoirs at depth. The use of statistical analyses combined with geological observation is a powerful combination to define which mechanisms control the formation of volcanic fields. Future work should focus on the integration of temporal data to account for the time-evolution of the volcanic field.
ACKNOWLEDGMENTS
We acknowledge Associate Editor Valerio Acocella and two anonymous reviewers for the con-structive and fruitful reviews of the manuscript. We thank J. Muirhead for his comments and proofreading the manuscript. This is Lunar and Planetary Institute contribution 1900. The dataset used is available by request to the authors.
REFERENCES CITED
Abebe, B., Acocella, V., Korme, T., and Ayalew, D., 2007, Quaternary faulting and volcanism in the Main Ethiopian Rift: Journal of African Earth Sciences, v. 48, p. 115–124, doi: 10 .1016 /j .jafrearsci .2006 .10 .005 .
Abebe, T., Mazzarini, F., Innocenti, F., and Manetti, P., 1998, The Yerer-Tullu Wellel volcanotectonic lineament: A transtensional structure in central Ethiopia and the associated magmatic activ-ity: Journal of African Earth Sciences, v. 26, p. 135–150, doi: 10 .1016 /S0899 -5362 (97)00141 -3 . Abebe, T., Manetti, P., Bonini, M., Corti, G., Innocenti, F., Mazzarini, F., and Pècksay, Z., 2005, Geo-logical map (scale 1:200,000) of the northern Main Ethiopian Rift and its implications for the volcano-tectonic evolution of the rift: Geological Society of America Map and Chart Series MCH094, 20 p., doi: 110 .1130 /205GMOTNMERTXT .
Acocella, V., 2014, Structural control on magmatism along divergent and convergent plate boundaries: Overview, model, problems: Earth-Science Reviews, v. 136, p. 226–288, doi: 10 .1016 /j .earscirev .2014 .05 .006 .
Agostini, A., Bonini, M., Corti, G., Sani, F., and Mazzarini, F., 2011a, Fault architecture in the Main Ethiopian Rift and comparison with experimental models: Implications for rift evolution and Nubia-Somalia kinematics: Earth and Planetary Science Letters, v. 301, p. 479–492, doi: 10 .1016 /j .epsl .2010 .11 .024 .
Agostini, A., Bonini, M., Corti, G., Sani, F., and Manetti, P., 2011b, Distribution of Quaternary deformation in the central Main Ethiopian Rift, East Africa: Tectonics, v. 30, TC4010, doi: 10 .1029 /2010TC002833 .
Athens, N.D., Glen, J.M.G., Klemperer, S.L., Egger, A.E., and Fontiveros, V.C., 2016, Hidden intra-basin extension: Evidence for dike-fault interaction from magnetic, gravity, and seismic re-flection data in Surprise Valley, northeastern California: Geosphere, v. 12, no. 1, p. 1–11, doi: 10 .1130 /GES01173 .1 .
Baker, J., Snee, L., and Menzies, M., 1996, A brief Oligocene period of flood volcanism in Yemen: Earth and Planetary Science Letters, v. 138, p. 39–55, doi: 10 .1016 /0012 -821X (95)00229 -6 . Bastow, I.D., Stuart, G.W., Kendall, J.-M., and Ebinger, C.J., 2005, Upper-mantle seismic structure
in a region of incipient continental breakup Northern Ethiopian rift: Geophysical Journal International, v. 162, p. 479–493, doi: 10 .1111 /j .1365 -246X .2005 .02666 .x .
Bastow, I.D., Nyblade, A.A., Stuart, G.W., Rooney, T.O., and Benoit, M.H., 2008, Upper mantle seis-mic structure beneath the Ethiopian hot spot: Rifting at the edge of the African low-velocity anomaly: Geochemistry Geophysics Geosystems, v. 9, Q12022, doi: 10 .1029 /2008GC002107 . Behn, M.D., Buck, W.R., and Sacks, I.S., 2006, Topographic controls on dike injection in volcanic
rift zones: Earth and Planetary Science Letters, v. 246, p. 188–196, doi: 10 .1016 /j .epsl .2006 .04 .005 .
Bilham, R., Bendick, R., Larson, K., Mohr, P., Braun, P.J., Tesfaye, S., and Asfaw, L., 1999, Secular and tidal strain across the main Ethiopian rift: Geophysical Research Letters, v. 26, p. 2789– 2792, doi: 10 .1029 /1998GL005315 .
Boccaletti, M., Bonini, M., Mazzuoli, R., Abebe, B., Piccardi, L., and Tortorici, L., 1998, Quaternary oblique extensional tectonics in the Ethiopian Rift (Horn of Africa): Tectonophysics, v. 287, p. 97–116, doi: 10 .1016 /S0040 -1951 (98)80063 -2 .
Bosworth, W., Burke, K., and Strecker, M., 2003, Effect of stress fields on magma chamber sta-bility and the formation of collapse calderas: Tectonics, v. 22, doi: 10 .1029 /2002TC001369 . Canón-Tapia, E., 2016, Reappraisal of the significance of volcanic fields: Journal of Volcanology
and Geothermal Research, v. 310, p. 26–38, doi: 10 .1016 /j .jvolgeores .2015 .11 .010 .
Chernet, T., Hart, W.K., Aronson, J.L., and Walter, R.C., 1998, New age constraints on the timing of volcanism and tectonism in the northern Main Ethiopian Rift southern Afar transition zone (Ethiopia): Journal of Volcanology and Geothermal Research, v. 80, p. 267–280, doi: 10 .1016 /S0377 -0273 (97)00035 -8 .
Chorowicz, J., 2005, The East African Rift system: Journal of African Earth Sciences, v. 43, p. 379– 410, doi: 10 .1016 /j .jafrearsci .2005 .07 .019 .
Chu, D., and Gordon, R.G., 1999, Evidence for motion between Nubia and Somalia along the Southwest Indian Ridge: Nature, v. 398, p. 64–67, doi: 10 .1038 /18014 .
Connor, C.B., 1990, Cinder Cone Clustering in the Trans Mexican Volcanic Belt: Implications for Structural and Petrologic Models: Journal of Geophysical Research, v. 95, p. 19,395–19,405, doi: 10 .1029 /JB095iB12p19395 .
Connor, C.B., and Connor, L.J., 2009, Estimating spatial density with kernel methods, in Connor, C.B., Chapman, N.A., and Connor, L.J., eds., Volcanic and Tectonic Hazard Assessment for Nuclear Facilities: Cambridge University Press, p. 346–368.
Connor, C.B., and Conway, F.M., 2000, Basaltic volcanic fields, in Sigurdsson, H., ed., Encyclo-pedia of Volcanoes: New York, Academic, p. 331–343.
Connor, C.B., Condit, C.D., Crumpler, L.S., and Aubele, J.C., 1992, Evidence of regional structural controls on vent distribution: Springerville Volcanic Field, Arizona: Journal of Geophysical Research, v. 97, p. 12,349–12,359, doi: 10 .1029 /92JB00929 .
Connor, C.B., Stamatakos, J.A., Ferrill, D.A: Hill, B.E, Ofoegbu, G.I., Conway, F.M., Sagar, B., and Trapp, J., 2000, Geologic factors controlling patterns of small-volume basaltic volcanism: Application to a volcanic hazards assessment at Yucca Mountain, Nevada: Journal of Geo-physical Research, v. 105, p. 417–432, doi: 10 .1029 /1999JB900353 .
Corti, G., 2008, Control of rift obliquity on the evolution and segmentation of the main Ethiopian rift: Nature Geoscience, v. 1, p. 258–262, doi: 10 .1038 /ngeo160 .
Corti, G., 2009, Continental rift evolution: From rift initiation to incipient break-up in the Main Ethio-pian Rift, East Africa: Earth-Science Reviews, v. 96, p. 1–53, doi: 10 .1016 /j .earscirev .2009 .06 .005 . Corti, G., Bonini, M., Conticelli, S., Innocenti, F., Manetti, P., and Sokoutis, D., 2003, Analogue
modelling of continental extension: A review focused on the relations between the patterns of deformation and the presence of magma: Earth-Science Reviews, v. 63, p. 169–247, doi: 10 .1016 /S0012 -8252 (03)00035 -7 .
Davis, J.C., 2002, Statistics and Data Analysis in Geology, Third Edition: New York, John Wiley & Sons, 638 p.
Delaney, P.T., Pollard, J.Z., and McKee, E.H., 1986, Field Relations Between Dikes and Joints: Emplacement Processes and Paleostress Analysis: Journal of Geophysical Research, v. 91, B5, p. 4920–4938, doi: 10 .1029 /JB091iB05p04920 .
Demsar, U., Harris, P., Brunsdon, S., Fotheringham, S., and McLoone, S., 2013, Principal Compo-nent Analysis on Spatial Data: An Overview: Annals of the Association of American Geogra-phers, v. 103, no. 1, p. 106–128, doi: 10 .1080 /00045608 .2012 .689236 .
Di Traglia, F., Morelli, S., Casagli, N., and Victor Hugo Garduño Monroy, V.H., 2014, Semi-auto-matic delimitation of volcanic edifice boundaries: Validation and application to the cinder cones of the Tancitaro–Nueva Italia region (Michoacán–Guanajuato Volcanic Field, Mexico): Geomorphology, v. 219, p. 152–160, doi: 10 .1016 /j .geomorph .2014 .05 .002 .
Ebinger, C., 2005, Continental breakup: The East African perspective: Astronomy and Geo physics, v. 46, p. 2.16–2.21.
Ebinger, C.J., and Sleep, N.H., 1998, Cenozoic magmatism in central and east Africa resulting from impact of one large plume: Nature, v. 395, p. 788–791, doi: 10 .1038 /27417 .
Ebinger, C.J., and Casey, M., 2001, Continental breakup in magmatic provinces: An Ethiopian ex-ample: Geology, v. 29, p. 527–530, doi: 10 .1130 /0091 -7613 (2001)029 <0527: CBIMPA>2 .0 .CO;2 . Favalli, M., Tarquini, S., Papale, P., Fornaciai, A., and Boschi, E., 2012, Lava flow hazard and risk at
Mt. Cameroon volcano: Bulletin of Volcanology, v. 74, no. 2, p. 423–439.
Gaffney, E.S., Damjanac, B., and Valentine, G.A., 2007, Localization of volcanic activity: 2. Effects of pre-existing structure: Earth and Planetary Science Letters, v. 263, no. 3, p. 323–338, doi: 10 .1016 /j .epsl .2007 .09 .002 .
George, R., Rogers, N., and Kelley, S., 1998, Earliest magmatism in Ethiopia: Evidence for two mantle plumes in one flood basalt province: Geology, v. 26, p. 923–926, doi: 10 .1130 /0091 -7613 (1998)026 <0923: EMIEEF>2 .3 .CO;2 .