by
WILLIAM KURT DEWAR
0
B.S., The Ohio State University (1977)
SUBMITTED IN PARTIAL FULFILLMENT OF THE REQUIREMENTS FOR THE DEGREE OF
MASTER OF SCIENCE
at the
MASSACHUSETTS INSTITUTE OF TECHNOLOGY January 1980
Massachusetts Institute of Technology 1980
Signature of Certified by. Accepted by.. Author
//
/
/
.,-o. ... ... . .. Department of MeteorologyA
Jan. 24 , 1980...
...
... &...
..
.
..
... ... ...
Carl Wunsch Thesis Supervisor Peter H. Stone Chairman, Departmen ommittee on Graduate StudentsU saiii'-. n
As
iTABLE OF CONTENTS
TITLE PAGE... 1
TABLE OF CONTENTS ... 2
ABSTRACT. ... ... ... 4
CHAPTER I. INTRODUCTION... 5
CHAPTER II. INTERNAL PLANE WAVES ... 11
A review of Stokes Drift in a Surface Gravity Wave...11
Fluid Motion in a Small Amplitude Internal Plane Wave...12
Fluid Motion in a Finite Amplitude Internal Plane Wave...14
Isobaric Float Motion in an Internal Plane Wave ... 15
A Simple Model of Vertical Float Response ... 19
CHAPTER III. VERTICALLY STANDING EIGENMODE INTERNAL WAVES...24
Fluid Motion in a Small Amplitude Eigenmode Internal Wave...24
Fluid Motion in a Finite Amplitude Eigenmode Internal Wave..26
Average Particle Velocity as a Function of Initial Vertical Position...29
Average Float Velocity as a Function of Initial Vertical Position ... 30
CHAPTER IV. THE RANDOM WAVE FIELD ... 36
Preliminary Discussion... ... 36
A Review of Turbulent Diffusion...38
Estimating the Lagrangian Diffusion ... 41
Long Time Float Diffusion...44
The Integral Time Scale - A Problem and A Solution ... 47
A Model of Long Time Internal Wave Diffusion ... 51
Tables of Results...53
A Simple Application to an Eddy Containing Ocean; Two Particle Analysis ... 57
CHAPTER V. CONCLUSIONS AND SUGGESTIONS...60
The Interpretation of Float Data...60
A Possible Application to Numerical Models ... 61
Suggested Research Problems...62
APPENDIX A. THE WKB WAVE ... ... 64
Motivation...64
Estimating the Induced Drift... 67
APPENDIX B. A DISCUSSION OF THE GARRETT AND MUNK SPECTRUM... 70
Preliminary Discussion...70
Manipulating the Eigenmode Solution ... 70
Determining the Energy Spectra... ... 72
ACKNOWLEDGEMENTS ... 76
THE EFFECTS OF INTERNAL WAVES ON NEUTRALLY BUOYANT FLOATS AND OTHER NEAR-LAGRANGIAN TRACERS
by
WILLIAM KURT DEWAR
Submitted to the Department of Meteorology on January , 1980 in partial fulfillment of the requirements for the Degree of Masters Of Science.
ABSTRACT
Effects of internal waves on quasi-Lagrangian floats are computed. The floats are postulated to be perfectly isobaric (an assumption
whose accuracy is supported by observation and simple models of float response) which allows their vertical position in the presence of internal waves to be approximated as constant. This quasi-Lagrangian behavior is investigated in two simple deterministic internal wave fields. The results suggest that the floats can be poor Lagrangian tracers. In the random wave case, the Garrett and Munk (1975) internal wave spectrum is used to predict the quasi-Lagrangian float spectrum
for short times through an application of Longuet-Higgins' formula for particle velocities. Taylor's results for turbulent diffusion are used to find the r.m.s. position of an average float as a function of time. Interpretation of the resulting displacements in terms of the scales of mesoscale eddies and two particle diffusion yields a time scale of 0(2-3 weeks) for which the assumption that a float is responding to the mesoscale field is valid.
Thesis Supervisor: Dr. Carl Wunsch
Classically, two different schemes have been employed for specifying fluid motions, the Eulerian and the Lagrangian. In the Eulerian scheme, the dependent quantities, such as velocity, pressure, and density, are considered as field variables. A solution to a fluid problem in this specification consists of solving for the dependent variables as functions of position and time. Conversely, in the Lagrangian formulation, one is interested in determining the evolution of individual fluid parcels. A solution of a fluid problem in this scheme is able to describe a parcel in terms of its various physical and thermodynamical properties, such as temperature, relative displacement, and density.
Depending on the situation, one of the schemes may be preferred rela-tive to the other. Problems in which one is interested in tracer dis-tributions, e.g. pollution dispersion,are more naturally answered in the Lagrangian sense. Other sample Lagrangian problems include the determina-tion of heat, momentum, and mass transport. On the other hand, various approximations to the Eulerian equations often provide solutions for the velocity field which are otherwise difficult to obtain. Also the simila-rity of the Eulerian equations to those in electricity and magnetism have allowed many useful analogies between the two sciences to be made.
Finally, useful conservation equations, such as Bernoulli's equation, and circulation theorums have been made in the Eulerian framework. It should be noted that historically, of the two, more emphasis has been placed on Eulerian fluid mechanics.
In contrast, some of the first measurements to have been carried out in oceanography were of a Lagrangian nature. For example, maps of oceanic
been published (Worthington, 1976) which provide an idea of the average Lagrangian character of the general circulation. However it has been only in the last 20 years that instruments have been developed which are capable of providing time records of near Lagrangian variables (the mea-surements are qualified as near-Lagrangian for reasons to be explained shortly) and only in the last ten years that these instruments have been used in substantial numbers in large scale experiments (The MODE Group
(1978)).
The first successful quasi-Lagrangian instrument was the Swallow float (Swallow (1955)) which became the prototype for the Sofar float (Voorhis (1971)). These floats are constructed of a material which is less compressible than sea water. The increasing pressure with depth in the ocean causes them to alter in average density as they drop, so that by a careful weighting the floats can be made neutrally buoyant at a particular pressure level. The Swallow float is tracked by a nearby ship, while a Sofar float can be located acoustically by distant shore listening stations. In MODE, Sofar floats were equipped to measure temp-erature and pressure along their path (Voorhis and Benoit (1974)).
A second type of quasi-Lagrangian device is the drogued buoy which is tracked by satellite. This instrument consists of a surface float, housing transmission equipment, that connects to a parachute drogue at depth via rope and chain. Generally the drogue cannot be deployed deeper than a few hundred meters.
A true Lagrangian measurement would describe the path of a water parti-cle which neither of these two float types can do, hence their designation as quasi-Lagrangian. For example, the drogued buoy motion represents
ocean current on the line and drogue, and mass transport induced by the surface wave field. It is a subtle problem to decide if one of these effects is dominating the buoy motion, or if all of them are contributing equally. In the case of a Sofar float, it was noted that they are designed to remain near a particular pressure level. Fluid parcels are not constrained in this manner; one of the most obvious examples to the contrary being
water mass formation (The Medoc Group (1969)). In fact, some of the Sofar floats in MODE were designed to measure vertical water velocities by rotating relative to the strength of the flow. Another source of quasi-Lagrangian behavior for these floats is that their presence in the fluid locally modifies the flow field (Voorhis (1971)).
Realizing that these floats fail to provide a measure of Lagrangian displacement, i.e. they don't measure where the water is going, one is forced to ask how to interpret the float data. When used in Gulf Stream Rings simply to provide data about migration, drogued buoys work well, their data agreeing with independent observations. In other applications however, it is difficult to decide what the drogued buoys are responding to. For the case of Sofar floats, it has been generally forwarded that their tracks are indicative of the energetic mesoscale and basin scale flows and aren't influenced by the smaller high frequency motions (Rhines (1977), Rossby, Voorhis, and Webb (1975)). For example, the Sofar float paths in MODE have been used to test quasigeostrophic dynamics.
The above assumption about the small effect of high frequency motions, e.g. internal waves, on quasi-Lagrangian floats has never been investigated although fluid transport has been demonstrated for a variety of time
was handled by Wunsch (1971). Given in addition the ubiquitous nature of the open ocean internal wave field .(Briscoe (1975), Garrett and Munk
(1979)) and that internal waves exhibit a great deal of vertical displacement, (Phillips(1977)) it would appear that an investigation of this assumption is necessary. One would like to know what effect the internal wave field has on quasi-Lagrangian floats in order to determine the accuracy of
interpreting float data in terms of mesoscale flows.
It would seem, based on previous research, that this problem can be solved. Many problems concerning the effects of random oscillations have been successfully investigated in the past. Taylor (1921) was able
to account for the diffusive capabilities of a fluid in terms of formulae involving statistical descriptions of the random velocity field. For the case of the random internal wave field, a sound statistical description has been devised in the form of a model energy spectrum (Garrett and Munk (1975)). It would then appear that the calculation of the effects of oceanic internal waves on quasi-Lagrangian floats is a natural extension of previous work and the efforts of this thesis will be directed to
this end.
The purpose of Chapters II and III is to demonstrate the non-Lagrangian nature of an isobaric float, although there is the possibility that the results may be useful in some isolated cases for interpreting float
data. In Chapter II, a constant depth approximation is suggested to model the isobaric nature of floats and some evidence is forwarded to support this approximation. Fluid motions and float motions are calculated and compared for the velocity field of an internal plane wave. The same calculations and comparisons are made in Chapter III for an internal eigenmode wave.
profile and at rest.
The detailed calculation of the oceanic internal wave field effects on quasi-Lagrangian floats is carried out in Chapter IV. In order
that the results be useful for makingquantitative statements about the interpretation of float data, the work in this chapter takes a different approach than the previous chapters and includes two different problems. In contrast to the previous two chapters, a comparison of fluid motion and float motion is not made, rather the results of this chapter are expressed in terms of the rate at which a float is diffused by the internal wave field. In the first problem of the chapter, this calculation is carried out in a fluid at rest and mention is made of the time interval for which a float has diffused a significant distance from it's initial position. The second problem discusses the implications of these results in an eddy-containing ocean by superposing them on a large scale shear flow.
Predictions are made of time scales for which the interpretation of the float as an indicator of the mesoscale motions is valid.
Chapter V includes a discussion of the results of the thesis as well as some suggestions for research topics which come from the work.
Two appendices have been included. The first deals with a complicated mathematical analysis of particle motion induced in a WKB solution internal wave. Rather than clutter the thesis with this work, the result, which was negligible, is quoted in the text and the details of the calculations relegated to an appendix.
The second appendix reviews the Garrett and Munk spectrum for the benefit of the reader who is not familiar with the model. The WKB
the parameters of the spectrum were computedis provided, and finally quantities like the mean square internal wave velocity are calculated.
CHAPTER II. INTERNAL PLANE WAVES A Review of Stokes' Drift in a Surface Gravity Wave
One may gain intuition about the mass transport problem in a wave by closely examining the Stokes-like problem of a two dimensional
deep water surface wave. By solving Laplace's equation with the
appropriate boundary conditions, one obtains the wave velocity potential: aa -kz
= qe sin(kx - at),V = u
where a is the amplitude of the wave at the surface. If one assumes that the particle velocities of the wave are small, after a time t a particle initially at x will have moved only a short distancex away. A reasonable approximation for the Lagrangian velocity of this particle at t is given by a Taylor expansion of the Eulerian velocity field
(Longuet-iHiggins (1969)). Correct to second order:
u (x ,t) = u(x ,t) + Ax-- u(x ,t) + Az u(x ,t).
S o o x o az o
To first order:
t
Ax = u(x ,t)dt; Az = f w(x ,t)dt,
0 0 o
so that a consistent expression to second order of the time averaged Lagrangian velocity (denoted by an overbar) is given by:
ul x o ,t)u(x,t)+u(x ,t)dt-u(xo ,t) + ow(x ,t)dtzu(x ,t) = u(x ,t)dt--u(x ,t) + w(x ,t)dtz-u(x ,t)
0
0
Working out the algebra one has:
2 -2kz 2 -2kz
1o 2 2
The interpretation of these two terms is as follows. The first con-tribution shows that the particle is experiencing a drift due to the horizontal velocities in the wave. As the phase velocity of the wave is greater than its particle velocities, the wave moves past the particle. In a positive velocity region of the wave, the magnitude of
the relative velocity ICp -ull of the wave and particle is less than in a negative velocity region because the wave velocity C is always positive. Therefore a particle tends to remain in a positive velocity region
longer than a negative velocity region, which results in a non-zero contribution to the averaged Lagrangian drift. Term two represents a similar process, i.e., the particle moves upward into regions of
swifter velocity, and downward into slower ones. Note for this example, the magnitudes of both effects are equal.
Fluid Motion in a Small Amplitude Internal Plane Wave
Suppose now one investigates an internal plane wave in a fluid of constant buoyancy frequency. Such a wave may be represented
mathematically as:
u(x,t) = Acos(k'x-at), (1)
where A = (A ,A ) is the velocity amplitude in the horizontal and vertical
x z
directions, k the wave number vector, and a the frequency. Requiring the wave to be a solution to the dynamical equations of motion pro-vides some constraints on Eq. (1). Incompressibility imposes:
A.k = 0, (2)
which is a statement that the wave is transverse. Now, if one assumes
that it is valid to determine particle velocities as in the Stokes
A u (X ;t) = x
1 o (A-k)
Using the incompressibility condition, Eq. (2), yields:
ul(xo,t)=0 , (3)
that is, an internal plane wave of small amplitude induces no net drift. From this analysis, one sees that the condition of incompressibility alone causes the result in Eq. (3). Interpreting this as done for the Stokes problem discussed earlier, one notes that the effect of
this condition is to move the particle up into regions of slower velocity at the same time that it is moving forward into faster regions in
such a manner as to result in no mass transport.
The constraint that the fluid be of uniform buoyancy frequency N restricts the amplitude vector A of the velocity field to be constant. In the Stokes problem it was found that vertical amplitude modulation induced a net drift (term 2). Therefore, one might here suspect that if N were not uniform, a drift would result. WKB analysis of an internal wave in a typical slowly varying open ocean buoyancy profile suggests
however that locally the amplitude vector A is nearly constant so that any drift induced by the WKB amplitude modulation, although non-zero, would be small. It then appears reasonable to assume for this Lagrangian problem that the ocean is effectively of constant N and that there is
no mass transport for an internal plane wave. A more careful analysis of the WKB problem may be found in appendix A. Indeed, the result is that the induced drift is roughly two orders of magnitude smaller than any mean velocity that one expects to see
Fluid Motion in a Finite Amplitude Internal Plane Wave
The result demonstrated in Eq. (3) need not be restricted to small amplitude waves. In fact, it is relatively simple to demonstrate that Eq. (3) applies to an arbitrarily large amplitude plane wave. This result
is interesting because such a wave is an exact finite amplitude solution to the equations of motion. One begins the exercise by formally converting
from Eulerian to Lagrangian coordinates according to the relation:
qe(,xl't) = ql(xo;t). (4)
Employing this in Eq. (1), gives: ul(xo;t) = Acos(k-xI- at). Defining x = (,n), one has:
= A cos(kE + mn - at) (5)
n = A cos(k + mu - at), (6)
where the incompressibility condition Eq. (2) still holds.
(Note that the results of the following calculations on E apply to n as well.) Using complex notation, one can write:
Re{A e-i } ; =kx l-at
Then one sees:
... . -io} -iO
= Re{-i(kg + mn - a)A x e } = Re{iaA xe } .
Differentiating again:
=- o2Re{A e-il} = -o2 x
One is left with a harmonic oscillator equation for g: (+ oa = 0
2wi/a.
7 dt = 0 (7)
which demonstates there is no net particle motion due to this wave. Note that solving the harmonic oscillator equation provides the solution for :
=
Bcos(o-at) ; = constant (8)
where 4 can be determined from the initial conditions. Comparing Eq. (8) with Eq. (5) shows that:
kE + ma = k- = 4 = constant,
which demonstates that the particle paths must lie on a line perpen-dicular to k. Again, all that was required to prove the very general result of Eq. (7) was the condition of incompressibility, Eq. (2). Isobaric Float Motion in an Internal Plane Wave
In order to calculate the path of a float in a kinematic field, one must try to isolate the peculiar aspects of a float's behavior in a mathematical sense. It was noted in the introduction that floats are nearly isobaric instruments. One expects a perturbation of the
hydro-static pressure field of less than 1% due to the passage of an internal plane wave. Therefore, assuming that floats are perfectly isobaric, one sees that to a high degree of accuracy, a float remains at a constant depth. Since a fluid particle moves at right angles to the wave vector k, regardless of the orientation of k, such a float is not a true Lagrangian tracer. One may study the effect of this isobaric nature by fixing the vertical position of the float mathematically. Of course a real float is not purely isobaric, rather it feels a vertical drag acceleration.
It will be demonstated later that recognition of this non-isobaric effect makes little difference in the results.
With
n = constant =
n
Eq. (5) becomes:p = Axcos(k + mrn - at) = Axcos(kg - at +y) ; y= constant(9) where (p ,no) is the position vector of the quasi-Lagrangian drifter. Note that the velocity field the float sees appears to be a compressible one. That is, according to the float, the divergence of the Eulerian velocity field is:
Vx -f = -Uxf f
+
Wzf= -A sin(kx-at+y) # 0 in general.Here one can solve for the float position p analytically as was done by Flierl (1980). Following his work, one writes:
X = k p - at X =
kp - a. Hence, Eq. (5) becomes
X = kA cos(x+y) - a.
X d
. d= t-t
X kA cos(X y ) - a o
0 x Solving for C yields:
P 2 -1 2 (t-t S= ta-l {tan( - (1-2) (t-t) )( - )} - y - a (10) 2 /(1-s2) where -i (1-8 2 a = tan {( ) tan(Xo+Y) (1-0) 0
and
Ak
S x = Ax/C ,
a measure of the wave steepness.
Of course in the event that 6 > 1, i.e., particle speeds exceed the wave speed, this solution is invalid. In this case:
X = 0,
and E = C t, the float moves monotonically with the phase velocity P P
of the wave. However, the likelihood of a wave with B > 1 is very slight; a more realistic value of 0 for a wave of wavelength 1000m,
frequency of one cycle per hour, and particle speeds of a few centimeters per second is:
(5 cm/sec)(2r/1000m) 1-.2 2wr/l hour
Examples of the streaklines for an isobaric float in an internal wave with about these steepness values are provided in Figure 1. Notice
the form of the motion. This motion corresponds to one of
the drifts in the Stokes problem. The floats move forward into regions of positive velocity where they remain a comparitively long time,
spending comparatively less time in regions of negative velocity. The mean Lagrangian drift velocityjof the isobaric float can
be eatimated in the.following manner. Again following Flierl (1980), note from Eq. (10) that the float velocity is periodic, i.e.:
p (t+T) = Sp(t) (11)
where T is the period. Since the motion of the float repeats itself after T:
cr
t
p
vs t;
8=o0.
FIGURE IA
kxo =
0.5
/kxo = 0
-0.5
Cp
vs
t; 8 =0.2
FIGURE IB
crt
kxo =0.5
/kxo = O0
ct
6p vs t;
P=0.3
FIGURE IC
Now using Eq. (9):
p (t+T) = Axcos(kE (t+T)- (t+T)+y)=
= A xcos(kp (t)-at+(kC (T)-kgp (0)-aT)+y).
Therefore:
k p(T)-kE (0)-aT = 2mn ; m an integer.
M can be determined by demanding that as p(t) + p (O), T - 2w/a. Hence, m = -1. A reasonable definition of Pp, the mean Lagrangian velocity of
the float, is:
S(T)-p (0) -2w a 2T (12)
5 T + k = C (1-0
P T k p aT
Inspection of Eq. (10) shows: 2T = 82
T = -(1-8 ) ; Bi<1 SO
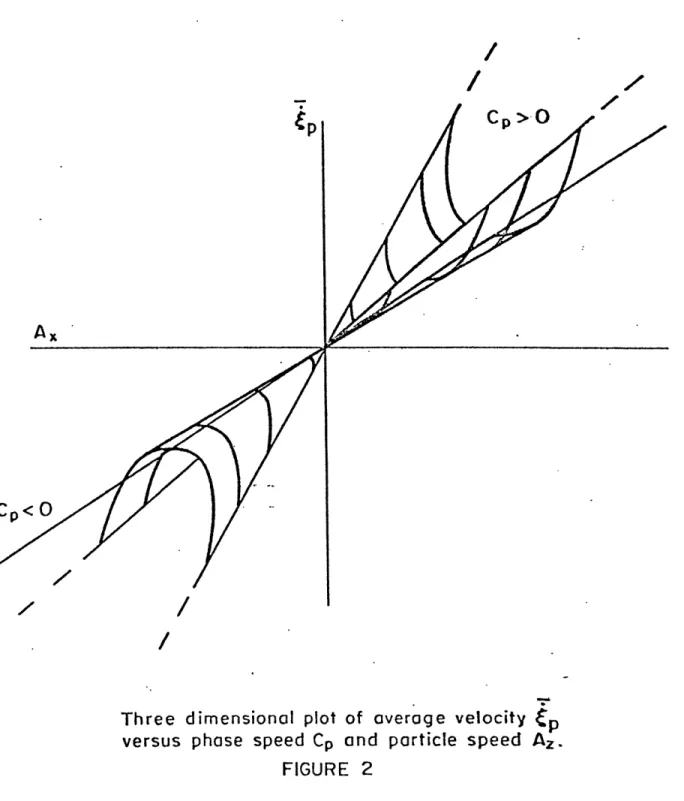
S= C (1-(1-82) (13)
Note that p is of the same sign as C p; the float drift is in the
direction of the phase speed. A graph of Eq. (13) is provided in Figure 2 which demonstrates this feature. If one supposes B E 1/3 and C = 30 cm/sec:
Ep = 2 cm/sec,
which is a significant drift velocity relative to the typical mean open ocean currents of- l-10 cm/sec.
A Simple Model of Vertical Float Response
Of course, the previous result has been found under the assumption that the floats are perfectly isobaric. It has been pointed out that this is not quite true and that there really is some vertical response of the floats. One may model the vertical response in terms of a
/
4
cl,
>O
Three dimensional plot of
average
velocity
Cp
versus phase speed Cp and particle speed Az.
FIGURE 2
C,<O
frictional drag acceleration as follows. Suppose initially the float is at its' equilibrium level in a constant N ocean and at time t = 0
forcing, in the form of a vertical velocity, is turned on. In addition, suppose the float is locked into position horizontally. The equations governing the float behavior become:
p
S= -g + -- - + Cd (w-n)
0 p0 d
o o
where ps is the surface density, s is the density gradient, p the
float density, Cd the coefficient of drag, n the vertical float position, and w the forcing velocity. The vertical equation of float motion for this case is a dynamic one, rather than a kinematic one as in Eq. (6). Several vertical forces come into play, including the buoyancy force of the displaced fluid, the viscous drag, and the gravitational force acting on the float.' Although Swallow (1955) and Voorhis
(1971, 1973, 1974) state that the floats are compressible, they are
considered of constant density here. If the potential density field is approximated as locally constant, the fact that the floats are less compres-sible than the water (Voorhis (1971)) implies that any vertical motion of
the float away from its' equilibrium position gives rise to a restoring force. In this sense the above equation represents a worst case and if the calculated magnitude of float displacement is small in the absence of this restoring force, one may feel confident in the result.
Assuming the vertical forcing velocity is that of a passing plane internal wave, w = Azcos(ko + mn - ot). Writing n as n = n(t=)+An ,
the differential equation becomes:
(An) + Cd(An) + (An) = CdAzCos(mno+ko+m(An) - t). Po
To insure that w(t=O) = 0, k5° + mn is set equal to rr/2. Supposing
initially that the total vertical response will be small, the cosine term in the previous equation can be Taylor expanded.
(A) + Cd(An) + (s - CdAzmsin(at+w/2))(An) = CdAzcos(at+n/ 2). The coefficient of drag within the internal wave frequency band is
roughly 2/hour (Voorhis (1971)) and with typical internal wave
numbers the ratio of the terms in the coefficient of An is found to be:
CdAzmp o (2/3600 sec)(l cm/sec)(10 /cm)(l gm/cm3
.7 x 10- 3
<< 1.
gs (103 cm/sec 2 )(.8 x 10- 7 gm/cm ) Therefore the equation is:
(An) + Cd(An) + s(.) = Cd A zcos(at+w/2) whose solution is:
(An) = {A2+B 2 cos(ot+7/2+phase) where:
A CdA (gs/p°-a ) B CdAzCda
A =2
(gs/po-2) +(Cd o 2 (gs/po- 2 2+(Cd) 2
The magnitude of the vertical float displacement is given roughly by:
1 CdA
lAni = {A2+B2}2
dz
gs/p -0
Defining e as the magnitude of An divided by the typical vertical particle displacement scale, Az/a, gives:
Cd a (2/3600 sec)(1/3600 sec) -2
gs/p -oz .8 x 10- sec 25 x
indicating that the vertical float displacement is very small, indeed dimensionally only 10 cm. Of course this model is much too simple
to accurately determine the magnitude of the vertical float displacement, yet the data from the floats seems to indicate that the conclusion
stated here is correct. For example, Voorhis (et al. (1974)) found that for the energy containing internal waves the value of a parameter similar to s was less than .1 and was for all internal wave frequencies less than 1/2. These results support the applicability of previous work on the perfectly isobaric float. For analytical convenience then, the assumption of perfect isobaric behavior will be retained through-out the thesis.
In this chapter it has been demonstated that given an isobaric instrument one must be careful to correctly interpret the data it
provides. In fact, for an internal plane wave, supposing that the float paths are particle paths would be a clearly wrong assumption. A fluid particle in the presence of an internal plane wave exhibits no net potion, however the float drifts along at speeds which.are of the order of
magnitude of open ocean time averaged velocities.
The reason for this result has also been established. It was demonstated that the incompressibility condition constrains the fluid tracks to remain on a line defined by:
k.x = constant.
Of course an isobaric device cannot meet this requirement as it is not free to move vertically. Since this section also demonstrated that a float could be successfully modelled as an isobaric device, it was
found that there was little comparison between the net motions of a parti-cle and a float.
CHAPTER III. VERTICALLY STANDING EIGENMODE INTERNAL WAVES Fluid Motion in a Small Amplitude Eigenmode Internal Wave
The previous section demonstrated that an isobaric device could grossly misrepresent Lagrangian motions in the kinematic field of an internal plane wave. Most observations of internal waves however appear to be of the eigenmode type, with notable exceptions occurring
in or near topography (Hotchkiss (1980)). In addition, McComas
(1977) casts some doubt upon the existence of a strong modal structure in the internal wave field because of non-linear resonant interactions. Nonetheless, a potentially more useful problem to examine is the
case of a float in a vertical standing mode internal wave. Following Appendix A, the analytical convenience of a constant N ocean is re-tained.
Solving the governing equation with the appropriate boundary
conditions then yields:
-Bnw nw
u = hk- cos(-- z)sin(kx-at)
w = Bsin(h z)cos(kx-at) , n an integer,
where u is the horizontal Eulerian velocity, w the vertical velocity with amplitude B, h the depth of the fluid, and n the mode number
of the wave. Applying the transformation 6f Eq, (4) yields the following
set of equations for the Lagrangian velocity field:
-Bn7 nr
=hk cos(- n)sin(kE-at) (14)
)
Differentiating Eq. (15) twice with respect to time and using both Eq. (14) and (15) results in:
2"' nir 2 2n 2)
n
= (B ( ) cos(-h n)- )f (16)Eq. (16) is very nearly a harmonic oscillator equation. With the assumption of small amplitude motions in the vertical, the frequency of oscillation of the particle is:
2= 2 2niT 2 2nir
1 -B (-)2cos(-- o)
which depends on no
Of interest also is the result that the frequency of motion of the float,al , is much different that the frequency of the wave, a . In fact, this difference is directly related to the mean float velocity as
demonstrated in Eq. (12). This is an example of how different the scales of a problem can be when viewed from the two different fromes of flow specification. Further informative examples of this phenomenon
can be found in Regier and Stommel (1979), although the lack of dynamics in their formulation of the kinematic field casts doubt on some of
their results.
Thus it appears that in this case a fluid parcel has a mean motion. A standing wave in the vertical can be thought of as the superposition of
two plane waves, one travelling up, the other down, each of which is alone unable to transport any mass. It might at first appear surprising
that there is a drift. The drift is a reflection of the non-linear nature of the transformation in Eq. (4). The velocity field of the superposed plane waves preduces a non zero mean motion whereas the
the individual waves cannot.
Fluid Motion in a Finite Amplitude Eigenmode Internal Wave
In a simple deterministic wave field such as the one here, a
solution independent of the small amplitude assumption can be generated. A more careful attempt at solving Eq. (16) is called for.
To do so, integrate Eq. (16) once in time. "
B naT 2nr 2
n = 2h sin(--n)- n + C 17)
where C ultimately can be determined from the initial conditions. The next step is to divide n into o++6n , where 6 is the order of magnitude of the vertical excursion and n is an order 1 quantity. Time is scaled by the wave frequency a . Two related non-dimensional terms occur in
Eq. (17): 2 E - = 2A h 2 B nT G= 2a6h
Numerical integrations of the system in Eq. (14) and (15) indicate for n'O(10),h=5000m, and B=5 cm/sec that 6 = 30 m, therefore, e = ,36 << 1 and 8 = .2<< 1. In fact, both parameters are probably bigger here than found in a typical internal wave due to the somewhat large value assigned to B and high mode number, and an expansion of Eq. (17) based upon A and 6 probably is not restrictive.
To 0(SE3 ), Eq. (17) becomes:
.. (18)
2 2
yn
where 2nr C C1 = Bsin(
n )
no -2(
2 2nr Y = (-A cosh no ) ) and 3 2nT a =A sinh n ),a second order oscillator equation with a weak quadratic non-linearity. It is known that the solution to such an equation may be obtained by postulating a two time scale behavior. Using a multiple scale
analysis, the solution for
F
becomes:fl = Gcos((y+ 1.)t)+Hsin((y )t) + 1 ;
Y Y 2
Y
where G and H are determined by the initial conditions. In Figure 3,
plots of this analytical expression for
n
and a numerical integrationfor n are compared, 'For the duration of the comparison, there is
essentially no difference. A useful result of this multiple scale approach is that the frequency of the particle motion is found:
2 2nrr
S^4 sin ( 2n.
la = 2 2n7r A h o
K = t---n)) 3 h + -- (l 2 2 2 2n 3/2 (19)(19)
Y (1-A cos(--- r)
which is different from a as suggested by the infinitesmal analysis carried out earlier, Another useful result is that a formula for f can be generated and used in Eq. (15) to solve for (.
S=C t+
A 2nr *nr
--K sin(- o)sin(Kt)+Asin(--no)cos(Kt)
1 -1 2K ho h o (20)
os A 2nn o^ A no , nr A 2nr } (20)
Asin(--2 sin-h
no)cos(Kt)+sin
o)sin(Kt)I +--- s in g-n2 2K
nu h o
If (nr/h)no = m, one must return to Eq. (14) and solve directly for
Az
o00 0770Az
0,
-12
A 0.4, MODE
#20
K
=
0.977
FIGURE
3
m+1
2 -1 (-1) A C = 2 tan{ (-l) A
(l-A 2 ) (-A2 n = constant
The strong dependence of Eq. (20) on no, the initial vertical position
of the particle,suggests that there is a wide variety of behaviors available to a fluid particle in such a wave field. To illustrate
this, Figure 4 has been included. The tracks are tile calculated particle trajectories,for a time of four wave periods, of a number of particle
initially situated on the same vertical line, The wave is a second
mode wave, and the graph is one of the entire water column. One should note from these streaklines that although a particle gets
displaced horizontally, it does not on the average move away from its' initialposition in the vertical. In fact, it is easy to show from the formula for
in
that n = 0. This reflects the demand that Eqs. (14) and (15) be velocity fields that satisfy the dynamical equations of motion which include conservation of buoyancy. (By analogy, in order to conserve po-tential vorticity, the particle paths. of an unforced Rossby wave cannot have a mean north-south displacement).Average Particle Velocity as a Function of Initial Vertical Position
With Eq. (19), the formula for the frequency of the particle motion,
one can use the method from the plane wave chapter to determine the
mean Lagrangian velocity of the fluid parcels, 5, as a function of depth.
= C (1-K)
(21)
ZD = O
FIGURE
4
Particle paths as a function of initial position for a second mode internal wave.
Figure 5 for a first mode wave with maximum particle velocities of 10 cm/sec. Note that i is slightly larger in the forward direction, a result which can be demonstated from Eq. (21). This same pattern repeats to compose a picture of ( for higher mode waves. For
example for a 20th mode wave, the pattern of Figure 5 will occur be-tween the depths of hn/20 and h(n+l)/20 for every n from 0 to 19.
While this method of solving for the particle positions in a standing internal wave mode is original, the problem itself has been investigated before. Wunsch (1971) used the standard Longuet-Higgins velocity field expansion discussed in Chapter II to determine i correct to second order in displacement, an approximation which becomes
more accurate as the displacement diminishes. Comparisons should be drawn between the results indicated by Eq. (21) and those of Wunsch, and any differences understood. Wunsch predicts
27 (22)
S cos(-h o
for a first mode wave. In the limit of small amplitude motion,
A -* 0, and Eq. (21) reduces to
2rr
S cos(-h no) (23)
which compares favorably with Eq. (22). However, one notices that the zero crossings of 5 differ slightly between Eq. (21) and (22), and
that Eq. (22) predicts equal forward and backward net drifts. These two differences can be explained by the fact that Eq. (21) is
G
38noEji
90,02 V
q.-a
of the wave which produces an effect similar to the edging drift of the float in a plane wave,
Average Float Velocity as a Function of Initial Vertical Position
Now one turns attention to the problem of a float in the wave field of Eqs. (14) and (15) in order to compare p with the results of Eq. (21). One intuitively expects the two answers to differ on the basis of
Figure 4. It is obvious that a true particle exhibits up and down motion which is kinematically important in determining the particle's
path.
To solve for the float motion one supposes n = no = constant.
Equation (14) becomes:
-Bn nw.
S hk cos(--n o)sin(kE-at)
p hk h o
an equation highly reminiscent of Eq. (9), The solution of this equation is now a familiar one with the period of the float motion given by:
T = 2w
f ^2 rn (24)
a(1-A cos(-h ))
The period of a fluid particle motion is given by:
S= 2w
S _2 o2nw "4 2 2nT a((l-A cos(2- no)) +A sin ho
h 2 h o (25)
^2 2nTo 3 / 2 (1-A cos(-- o
and one notes Eqs. (24) and (25) agree when(nu/h)no = mn, as is indicated they should from Figure 4. A most interesting feature however is
that if (nr/h)n = mr + w/2, a point of maximum negative particle trans-port, Eq. (24) indicates p = 0. If (nl/h)no = mr + w/2
purely isobaric float cannot move out of the horizontal plane while a particle can.
With Eq. (24) one can generate a plot of Ep, as is done in Figure
6, to compare with . p is always positive, and except for the points
(nr/h)no=mr, there is very little resemblance between Figures 5 and 6. A glance at Figure 6 would indicate the existence of a series of jets
in the vertical, whereas the actual fluid motion of Figure 5 is significantly different. One must be careful in the final interpretation of this
Zn=O
Az
p vs.
77
ZD=
-h
F
=
0.06
FIGURE 6
CHAPTER IV. THE RANDOM WAVE FIELD
Preliminary Discussion
In the previous two chapters, it was demonstrated that in simple wave fields an isobaric float track can be a poor representative of
true Lagrangian motion. The non-Lagrangian effect is fairly robust and care must be used in the interpretation of float data. Another result was that the waves were effective at transporting fluid relative to transport by typical large scale mean velocities. The open ocean internal wave field however is not deterministic, as both of the previous examples were, and any one realization of the field is
governed by a randomly fluctuating energy spectrum. Garrett and Munk (1972, 1975) have proposed a model spectrum to describe the average internal wave field. Although there are questions about the details, recent data seems to support the overall accuracy of their spectrum. With this powerful tool and the results of the previous chapters, one
feels motivated to attempt the problem of the determination of float motion in a random wave field.
One of the major assumptions of Garrett and Munk's work was that the internal wave field was horizontally isotropic, and it is this idea that might lead one to believe that a float would not be affected on the average by internal waves in the open ocean. In fact, the practice has been to suppose that the internal wave field induces relatively little
drift on a float and that the resulting paths are indicative of the fluid tracks of the more energetic mesoscale and large scale motions. Of course this assumption is unproven until a calculation has been
made about the effect of the internal wave field and the aim of this chapter is to address this calculation. The approach will be a little different than those of the previous sections as follows.
The emphasis in this chapter will be on how effectively a float is moved about in the internal wave medium, rather than how a float
track differs from the tracks of fluid particles, because one is
interested in determining whether the float tracks are due solely to the mesoscale. In addition, one cannot really discuss individual float
tracks in a random field, rather one must recognize initially that the only meaningful statement is a statistical one. Such a statement is usually made in terms of the diffusing power of the random field.
Since the Garrett and Munk model of the internal wave spectrum is essential to this chapter, a thorough understanding of their work is necessary. The reader who is not familiar with the spectrum may want to turn to Appendix B for reference or explanation of any of the subtler points used in the analysis.
Fortunately a literature has developed concerning problems -similar to the one here. The theory of homogenous turbulence in particular deals with the diffusion caused by a turbulent velocity field which is described statistically by a stationary Eulerian
energy spectrum. Although, there are differences between the homogenous turbulence problem and the internal wave problem, much insight may be gained by reviewing the basic concepts of turbulent diffusion.
A Review of Turbulent Diffusion
The first problem of a random nature to be successfully investi-gated was the "drunkard's walk." In particular, one assumes that there is no correlation between the individual steps that the drunk takes, although each step is of equal length, d, and occurs at equal
intervals of time T. Although the mean position of the drunk never changes; i.e., <x> = 0 where the < > indicate an averaging process, it is found (Taylor (1921)) that the root mean square position of the drunk is given by:
d
2
2^ (26)
<x > = -z--t = u
It
where t is the time for which this random process has been operating, and u = d/T the average velocity of the drunk during a step. Such an
analysis has proved fruitful when applied to a variety of discrete or near discrete phenomena. For example in low pressure gas dynamics, diffusion at a molecular level was explained in this manner, where d was interpreted as the mean free path of a molecule of the gas
between collisions. T was interpreted as a decorrelation time because each collision of the molecule, occurring at intervals of time T, resulted in an incoherent change in the particles' direction.
In the case of a continuous random velocity field, such as that
of a turbulent fluid, one expects that the successive collisions of a fluid parcel are not going to be uncorrelated, that is to say the velocity
of a fluid parcel prior to collision will significantly affect the velocity of the fluid parcel after collision. Taylor (1921)
random case allowed the problem of diffusion in turbulent fluids to be interpreted in view of the random walk. Following Taylor, the formula for the Lagrangian position, xl, of a marked particle at time t which was initially located at x = 0 is:
x1(0;t) =
u
l(O;t)dtIf the fluid is turbulent,
<Xl(0;t)> = <ul(0;t)>dt 0 (27)
where the braces now indicate an ensemble average. Eq. (27) indicates that the mean position of the marked particles is constant in time. Note however that:
<x1(0;t)xl(o;t)> = < ul(O;t)dt Ul(0;s)ds> = = b <u1 (0;t)u (0;s)>dtds =
= 2<u2>YR (T)dTds
(28)
where r = t-s. The quantity R u() is the Lagrangian auto-covariance uu
of the random field and a knowledge of it is sufficient to determine the variance of the distribution of marked particles, <x12(o;t)>1/ 2
Of course as time grows large, one expects the particle to lose coherence with its initial state,so that after some time T the
Lagrangian velocity of the particle bears essentially no resemblance to its velocity at t = 0. This is equivalent to saying that the integral
fR (T)dT o uu
converges and for t > T the Lagrangian auto-covariance makes no further contribution to the integral:
R (T)dT = fR (T)dT = I (29)
o uu o uu
Eq. (28) may be rewritten as:
<x2 (0;t)> = 2<u2>(t-)Ruu(T)dT ,
Assuming that R Ik~T)dC converges, in the limit of large time one sees:
<x2 (0;t)> = 2<u >It-2<u >TR (T)dT . (30)
1 o uu
The form of the first term compares with that in Eq. (26) if one identifies I, the integral in Eq. (29), with the decorrelation time A. One sees that the large time diffusion process in a fluid is analogous to
the random walk problem and the integral time scale in the continuous case, given by Eq. (29),is a measure of the persistence of the fluid velocity. One may interpret the continuous large time diffusion
process as random stepping over a distance <u 2 I.
The essential difference between discontinuous and continuous diffusion occurs for small time. In the discontinuous case, one is generally not concerned with determining the behavior of the marked particles for times smaller than T because interest lies chiefly in determining the long time, i.e. several T intervals, diffusion.
for small times is given by: 2 1t
<X (t) (31)
Here small times are those for which the covariance R uu(T) has notuu
significantly decreased from unity. For turbulent fluid motions one is often interested in the diffusive behavior for these times.
Estimating the Lagrangian Auto-Covariance
One sees from Eqs. (28) and (29) that many useful statements about the diffusive effect of the turbulent velocity field can be made if the Lagrangian autocovariance R (T) is known. Generally however,uu due to the inherent difficulties of either directly measuring for or solving for Ruu( ),one -is supplied only with Eulerian statistics of the field, as in the case of internal waves. Fortunately -a branch
of homogenous turbulence theory, in which much progress has been made, has developed which deals with deriving expressions for the
Lagrangian auto-covariance from Eulerian statistics. For example, in different regimes of a parameter which described the non-linear character of a turbulent field characterized by Eulerian statistics, Liu and Thompson (1976) found simple approximations to the Lagrangian auto-covariance which were surprisingly accurate. Also Roberts (1961) has developed a non-linear integral equation relating Ruu(T) to the Eulerian space-time covariance Reuu(r, ) defined by
Re <u (x+r,t+E)ue (x,t)> uu (r, ) = 2
uu ~ <u 2(x,t)>
In both of the techniques just mentioned, the Eulerian statistic of interest in the covariance which is the Fourier transform of the
Eulerian energy spectrum. Under the assumption of stationarity one may speak of a Lagrangian energy spectrum which would be the Fourier
transform of the Lagrangian auto-covariance. A third method of obtaining the Lagrangian auto-covariance then consists of estimating
the Lagrangian energy spectrum directly from the Eulerian statistics. This is essentially the approach that will be used here for the problem of float diffusion in the random internal wave field. Of course one must recognize at the outset that there is no a priori justification
for the stationarity assumption and that one must test the derived Lagrangian energy spectrum for this property.
One begins by writing the linear Garrett and Munk like statement:
u(x,y,z,t) =f f f A(a.,a2,w)U(a,w,z)ei(alx+a2y+t)dada2d a 1 2
One transforms this particle velocity to a float velocity by fixing z as a constant. Using the Longuet-Higgins formula for the Lagrangian particle velocity:
t t t
ul(O;t) u(0,t)+/udtxu(o,t ) + fvdt u(0,t) + fwdt-,-u(O,t)
the expansion for the Lagrangian auto-covariance, correct to second order in displacement, becomes:
ul(t+T)u l(t) = u(0,t)u(0,t+T) +
+ u(O,t)f/ A(al,aw)A (al,a2,w)U(a,w,zU((-a,-w,z)( +V(a, w)U(-a,-a , z) 33
{eiW(t+1)-l}e-i(t+T)d3d3 + u(0,t+T)f fA(al,a2 ,W)A (al,'2,m) (32)
33
Sf/ = f f f f = f f f
where d3 = da da dw, d3 = daoda 2dw 2 and l 2 If one assumes the amplitudes A(cl,c2,w) are drawn from a Gaussian distribution, the triple products of A(al,a2,w) in the second and third
terms of Eq. (32) vanish when ensemble averaged. Hence, correct to second order:
<u >Ruu () = <u (t)u (t+T)> = <u(0,t)u(o,t+T)> =
=f fE(a,w)U2 (w,z)eiwTdad . (33)
Woa
To this order, the Lagrangian statistics are stationary; it is therefore consistent to estimate the Lagrangian energy spectrum as: I fE(a,w)U2(w,z)da wi<w<n
E1() = < a
(34)
0 W<wi;w>n
Using Eq. (33) in Eq. (28) implies:
t 2 iWT
2(t)> = 2<u2 >Ref(t-T)f fE(a,w)U2 (w,z)daei dwdr =
o mi t n 2 2 = 2<u2>Ref(t-T)fE -- - 1 2 e drdw = (35) S 2 2 n 2 S2<u2 n 21 1 d- dwcos(wt)d2 7r 5 2 2 wc /W -W.. i - 1W
where xl is the nondimensional float position. (In the formulae to
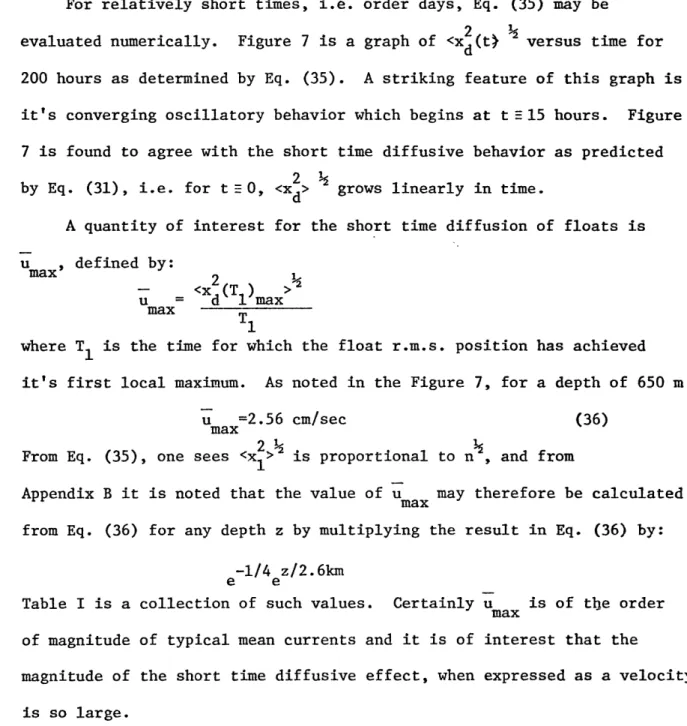
For relatively short times, i.e. order days, Eq. (35) may be
2
evaluated numerically. Figure 7 is a graph of <xd(t) versus time for 200 hours as determined by Eq. (35). A striking feature of this graph is it's converging oscillatory behavior which begins at t H15 hours. Figure 7 is found to agree with the short time diffusive behavior as predicted
2
by Eq. (31), i.e. for t E0, <Xd> grows linearly in time.
A quantity of interest for the short time diffusion of floats is u , defined by:
max 2 a>
u <xd(T)>
u = <Xd (T1 max max
where T1 is the time for which the float r.m.s. position has achieved
it's first local maximum. As noted in the Figure 7, for a depth of 650 m
u =2.56 cm/sec (36)
max
From Eq. (35), one sees <xI> is proportional to n , and from
Appendix B it is noted that the value of u may therefore be calculated
max
from Eq. (36) for any depth z by multiplying the result in Eq. (36) by:
-1/4 z/2.6km e e
Table I is a collection of such values. Certainly u is of the order max
of magnitude of typical mean currents and it is of interest that the
magnitude of the short time diffusive effect, when expressed as a velocity, is so large.
Long Time Float Diffusion
Calculating the diffusive effect of internal waves in the limit of large times is also of interest. Unfortunately, one may not econo-mically evaluate Eq. (35) on a computer for times much
I km Max. displacement 1.38 km at 15 hours. max = 2.56 cm sec
100
Figure
7
2
( x) vs. time for 200 hrs.200 hours
TABLE I. depth in meters 300 500 1000 1500 2000 2500 3000 3500 4000 4500 5000 u in cm/sec max 2.93 2.71 2.24 1.85 1.52 1.24 1.04 .859 .704 .581 .479
The short time diffusion due to the internal wave field as a function of depth.
longer than a few days without losing numerical stability. On the other hand, equation (30) is an analytical prediction of <xd> at large times which depends on the existence of a Lagrangian auto-covariance; therefore one may use Eqs. (33) and (30) to calculate
2
<xd> for t*.
Under the assumption that the integrals exist, the formula for <xd> becomes:
2 2 2 O
<x >=2<u >It-2<u >fTR (T)d-r (37)
d o uu 2
d <x > where Eq. (29) has been used. The rate of diffusion, d
is then seen to become:
2 2
d <xd >=2<u >I (38)
dt
hence determining the value of the integral in Eq. (29) and the value 2
of <u > is central to completing. the description of float behavior at large times. With the assumption of stationarity of the Lagrangian statistics, Eq. (4) can be used to demonstrate:
2 2 <u >=<u >
e
the mean square Lagrangian velocity is equal to the mean square Eulerian velocity. From Appendix B, then:
2 2
<u >= (6.6 cm/sec) n
The Integral Time Scale - A Problem and a Solution
A formula for the integral time scale may be generated by using the expression for R of Eq. (33) in Eq. (29) and employing the fact
uu
2 tiWT 1 tJ.T
<u2>I = Lim /E (w)e dd = Lim fE (w)fe dTd =
t-o ow t-)*o W -t
= E1 (0) (39)
One sees that the Lagrangian spectrum, Eq. (34), then predicts
I = 0,
which in Eq. (38) indicates that:
d 2 (40)
dt <xd> = 0. (40)
The result in Eq. (40) suggests that the r.m.s. float position as determined by the internal wave field eventually becomes a constant. Indeed, with: 2w.n 2 2 1 En 38
E
2- inI
+mi ( 1
En 38
E-- n -!- f 2 2)dw = 2 < T i - i W i 64an application of the Riemann-Lesbesques Lemma assures one that the 2nd integral in Eq. (35) vanishes in the limit of t + Co. The steady state value of <x (t)> is then given by
L 2 0 = 76<u2> 1 <x )>
96 2
Wi or dimensionally at 650 m as:2
<X2(c)> .90 Ki. (41)A similar scaling to that used on u will provide values of <x2 ( )>
max d
for all depths.
The result I=0 implies that the internal wave field eventually quits diffusing, however, a strong physical case against this result about I
may be built. For instance, the Lagrangian energy spectrum EL
()
was generated by an application of Longuet-Higgins' formula, which is an approximation. Any errors thus induced would most likely accrue in time, so that after some long interval, Eq. (34) could have
significant errors which respect to the true Lagrangian energy spectrum. A result such as that in Eq. (39) depends crucially on having an
accurate representation of EL(w) for all time. In addition, it was demonstrated in Chapter III that the superposition of two deterministic internal plane waves to form an eigenmode wave produced a net
Stokes drift. The Garrett and Munk spectrum superposes such modes in a random manner and it seems likely that mass transport would be generated in the resulting wave field.
On the other hand, one might feel that the result that I vanishes could be strongly indicative of the magnitude of the integral time scale. For example, the Longuet-Higgins expansion remains consistent
for particle displacements which are small with respect to the field spatial scales. In a random field, composed of many oscillations, it is not a trivial problem to state what is the relevant length. Still, for the case of the oceanic internal wave field, the inertial oscillations are associated with the longest scales. As these motions are clearly the most energetic of the Garrett and Munk spectrum, their scales must in some sense represent the dominant length. Observations of inertial scales of -- 0(5 km) have been reported in the literature (Knauss (1962))
2
and one sees from Figure 7 that the value of <xd> remains much less than 5 km. This demonstrates that the errors in EL(w) should be small.
In addition, narrow, but finite, band spectra of the form:
E (w) = e o o >> a generate covariances of the form:
R u(t) = e cos(Wt) (42)
The shape of this covariance crudely resembles that found from Eq. (33) for the internal wave field, although a satisfactory value of A to use in Eq. (42) to model the Lagrangian covariance apparently cannot be determined. The important point to note is that the integral time scale of Eq. (42) is:
t2 / 2 2
I = constfeo cos(Wot)dt = const2a e o
which is small, but non-zero.
The point of the last few paragraphs has been to suggest that the result in Eq. (40), i.e. I = 0, is invalid, but that it is reasonable
to suppose that Eq. (40) represents a statement that I is a small quantity. The thesis will proceed with this supposition. Clearly, from Eq. (40),
this assumption implies that the internal wave field is capable-of inducing float diffusion for all time. Recognizing the inadequacy of Eq. (33) to provide a value of I (or hence for 7TR ()d), one can
o uu
proceed with the problem of determining the large time float
diffusion in an internal wave field as follows. At times sufficiently large to insure both integrals have converged, one may rewrite Eq. (37)
as: 2 2 2 <x2> = 2<u2 >It-x 2 d 0 (43) where x2 = fTR (T)dT o uu 0
The graph of Figure 7 indicates that for times of the scale of a 2 1/2
week, the value of <Xd> oscillates about a value of,9 km. If one assumes that Eq. (43) is valid at a time, to, for which the graph
in Figure 7 is also valid, one may solve approximately for the quantity 2 x : o S= 2<u2>It-(.9 Km.) 2 o o (44) 2
At this point, <Xd> is determined for all time as a function of the integral time scale, I, and to. The value of <xd(t)> however appears to
be relatively insensitive to to,the time zhosen to fit Eq. (43) to Figure 7, as long as to is large with respect to I. Numerical verification of
this insensitivity will be provided shortly.
2
With4xd>determined by Eq. (43), it is possible to give a statistical interpretation to the problem of float diffusion for long times-by
using a convenient analogy.
A Model of Long Time Internal Wave Diffusion
One may assume for large times that the internal wave float diffusion process is adequately modelled by the Fickian diffusion equation:
a a -(45)
at at
where f is a probability distribution function of floats and P(t) is a time dependent coefficient of diffusion. Defining a new independent variable t by
t = fi(t)dt (46) Eq. (45) becomes:
a a2
t -~-X f (47)
a diffusion equation of constant unit diffusivity. The solutions of Eq. (46) are Gaussian distribution functions:
const -x /2t f=--- e
/2wt
2 1/2
where the variance of the distribution is t. Equating t with <x. (t)> then d
allows one to evaluate the results of large time diffusion for the internal wave field in terms of a diffusion coefficient. By Eq. (46) one sees:
d d 2
--t xd (t)> =
Using Eq. (38) and a value for I of 3 hours, the value of the internal wave diffusion coefficient at 650 m is given by:
2 6 2
P = 2<u >I = 1.15 x 10 cm /sec
a somewhat large value, which indicates that the internal wave diffusivity could create noticeable effects.
It is possible to quantize the internal wave diffusion more
clearly given the Gaussian form of f in Eq. (47). Using the fact that the float distribution function must be circularly symmetric, one
2 1/2
knows that a circle of radius R = 2 <Xd(t)>1/2 about the float's initial position represents a region in the ocean in which one expects to find any individual float with a 95% confidence level. Conversely, a
similar circle about the float is a region in which the float's initial position is contained 95% of the time. With this interpretation in mind and a choice for I,one may find the radius R for this 95% confidence region of the ocean as a function of time.
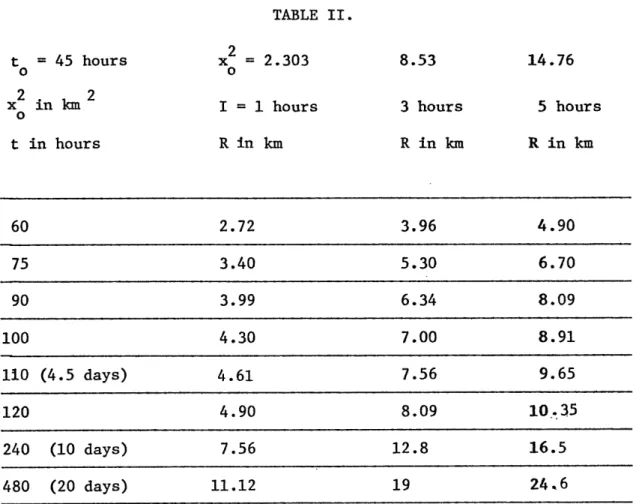
Tables of Results
Tables II and III have been included which provide values of R vs. time for two sets of values for I. Table II uses I=1,3, and 5 hours while Table III contains values of R for 1=10, 15, and 30 hours. By the
previous discussion on the magnitude of I, Table II would appear to contain more applicable results, and for convenience specific mention of results in Table II will be quoted from the I = 3 column.
Some interesting features of Table II are that the value of R grows to a significant ( 1 10 km) size in times of -0(weeks) and that this order of magnitude time scale estimate appears relatively independent of the assumption for the value of I.
2
The earlier statement that <x > is only weakly dependent on to,
d 0
the time at which one supposes the long time diffusion mechanisms take over,is supported in Table IV which contains values of <xd> at 60 hours
with I = 3 hours. Note that although to is varied by some 25 hours, the value of <x2> changes by less than 1 km, which is roughly the uncertainty
with which a float is located. (Jim Price, personal communication).
The results presented in Table IV suggest that the float diffusion problem is relatively insensitive to the assumptions made about the parameters of the model.
A further example of this robustness is presented in Table V which
TABLE II. t = 45 hours o0 2 2 x in km O t in hours 60 75 90 100 110 (4.5 days) 120 240 (10 days) 480 (20 days) x = 2.303 o I = 1 hours R in km 2.72 3.40 3.99 4.30 4.61 4.90 7.56 11.12 TABLE III. 2 t = 60 hours x = 40.70 61.45 123.7 o o t in hours I = 10 15 30 75 6.70 8.09 2.076 90 9.30 11.31 11.3 100 10.7 13.02 15.9 110 11.9 14.5 18.3 115 12.5 15.2 21.5 120 13.0 15.9 22.40
R vs. t for various values of the Integral time scale and x2 0 8.53 3 hours R in km 3.96 5.30 6.34 7.00 7.56 8.09 12.8 19 14.76 5 hours R in km
4.90
6.70
8.09
8.91
9.65
10.35
16.5
24.6
TABLE IV. 2 <Xd> 3.19 3.02 2.84 2.65 2.45 2.23 2
A test of the sensitivity of <xd(t)> to t.
d 0
15
20
25
30
35
40
TABLE V. I in hours .2 .5 1 2 3 4 5 6 7 8 10 15 T in hours 1895 hours = 745 hours = 395 hours = 215 hours = 162 hours = 133 hours = 115 hours = 103 hours = 95 hours = 89 hours = 80 hours = 68 hours = 79 days 31 days 16 days 9 days 7 days 5-1/2 days 5 days 4-1/2 days 4 days 3-1/2 days 3-1/3 days 2-3/4 days