HAL Id: hal-00122775
https://hal.archives-ouvertes.fr/hal-00122775
Submitted on 4 Jan 2007HAL is a multi-disciplinary open access archive for the deposit and dissemination of sci-entific research documents, whether they are pub-lished or not. The documents may come from
L’archive ouverte pluridisciplinaire HAL, est destinée au dépôt et à la diffusion de documents scientifiques de niveau recherche, publiés ou non, émanant des établissements d’enseignement et de
Towards a link between the energetic heterogeneities of
the edge faces of smectites and their stability in a
context of metallic corrosion
Murielle Perronnet, Frédéric Villiéras, Michel Jullien, Angelina
Razafitianamaharavo, Joël Raynal, Dominique Bonnin
To cite this version:
Murielle Perronnet, Frédéric Villiéras, Michel Jullien, Angelina Razafitianamaharavo, Joël Raynal, et al.. Towards a link between the energetic heterogeneities of the edge faces of smectites and their stability in a context of metallic corrosion. Geochimica et Cosmochimica Acta, Elsevier, 2006, -, �10.1016/j.gca.2006.12.011�. �hal-00122775�
Towards a link between the energetic heterogeneities of the edge faces of smectites 1
and their stability in the context of metallic corrosion 2
3
Revision 1 - 12/6/2006 4
5
Murielle Perronnet 1, 2*+, Frédéric Villiéras 1*, Michel Jullien 2, Angelina 6
Razafitianamaharavo 1,Joël Raynal 2, Dominique Bonnin 3 7
8 9
1 Laboratoire Environnement et Minéralurgie, UMR 7569 Nancy-Université - CNRS, Ecole
10
Nationale Supérieure de Géologie, BP 40, 54501 Vandoeuvre les Nancy Cedex, France 11
2 Laboratoire de Modélisation des Transferts dans l’Environnement, Commissariat à
12
l’Energie Atomique, Centre de Cadarache, Bâtiment 307, 13108 Saint Paul les Durance, 13
France 14
3 Laboratoire de Physique Quantique, Ecole Nationale Supérieure de Physique Chimie
15
Industrielle de Paris, 10 rue Vauquelin, 75231 Paris Cedex 05, France 16 17 18 * Corresponding authors: 19 murielle.c.perronnet@nasa.gov 20 Frederic.Villieras@ensg.inpl-nancy.fr 21 22
+ Present address: Lyndon B. NASA Johnson Space Center, KT, 2101 Nasa Road One,
23
Building 31 Room 236, Houston, TX 77058-3696, USA 24
26
1. ABSTRACT 27
28
In the context of the potential confinement of high-level radioactive wastes (HLW) within the 29
clay Engineered Barrier System (EBS) in deep geological formations, the evolution of the 30
retention properties of smectite when interacting with Fe(0) needs to be assessed. If some 31
potential natural analogues describing iron-clay reactivity are easily found, metallic iron-clay 32
interactions are poorly described in studies regarding the Earth. Therefore experimental 33
investigations are needed. Several parameters influence Fe(0)-clay interactions, such as 34
temperature, the interlayer composition of swelling clays, and the presence of octahedral 35
Fe3+… From a geometrical point of view, it is thought that clay destabilization is mainly
36
controlled by phenomena starting at the edge faces of the particles. 37
In the present work, the rates of the smectite-Fe(0) reaction at 80°C was assessed by XRD, 38
Mössbauer and CEC analyses for three smectites. The investigations show marked 39
differences in the degree of stability, which can not be explained by the crystal-chemistry 40
rules established in previous studies. Therefore, the Fe(0)-smectite interactions were studied 41
in view of textural and energetic surface quantitative analyses. The studied smectites have 42
equivalent nitrogen BET specific surface areas, equivalent argon edge surface areas and 43
slightly different basal surface areas. This similarity in particle shape indicates that the edge 44
surface area can not be accounted for when explaining the observed differences in reactivity. 45
However, a correlation is obtained between smectite reactivity and the energetic 46
heterogeneity of its edge faces. This is interpreted in terms of a multiplication of the number 47
of sites on the edge faces, where the electron transfer between Fe(0) and the smectite 48
structure can occur. 49
50
2. INTRODUCTION 51
52
Iron-clay reactions are of great importance in soils and in sedimentary and diagenetic 53
processes. In soils, the evolution of clay minerals is mainly controlled by oxidation-reduction 54
reactions. Kaolinite is very reactive in media under varying redox conditions, but Fe-rich 55
TOT clay minerals are even more reactive, and great changes in their properties may occur 56
(e.g. Favre et al. 2002). Low temperature, iron-rich, clayey environments are also described 57
in sedimentary verdine facies (Bailey 1988; Odin 1988; Odin 1990), in diagenetic oolitic 58
ironstones (Bhattacharyya 1983; Bhattacharyya 1986) and in sandstones (Hornibrook and 59
Longstaffe 1996; Aagaard et al. 2000; Hillier and Velde 1992; Hillier 1994). In these natural 60
systems, iron is present as iron oxides and/ or hydroxides (e.g. Odin 1988; Buatier et al. 1989; 61
Walker and Thompson 1990; Hornibrook and Longstaffe 1996), although metallic iron, 62
Fe(0), has only been identified in contact with clay in extraterrestrial materials, such as CM 63
carbonaceous chondrites. In this case, when heating of the asteroid induces fusion of accreted 64
ice, cronstedtite, a Fe-rich 7Å mineral, is formed by interaction between olivine and FeNi 65
metal (Zolensky and McSween 1988; Brearley 1997; Zega and Buseck. 2003). However, 66
recently the clay-Fe(0) interactions in terrestrial environments are in question. Indeed, clay 67
minerals may be used to confine the metallic canisters of high-level radioactive wastes 68
(HLW) in deep geological formations. 69
70
Because of the lack of information concerning the Fe(0)-clay interactions on Earth, 71
experiments have to be carried out to test clay stability when in contact with metallic iron for 72
different temperatures, saturation states and redox conditions. 73
In a previous study, Perronnet (2004) demonstrated that it is mostly the smectite fraction of 74
the clay material which reacts with Fe(0). At temperatures up to 200°C (Habert, 2000; 75
Lantenois, 2003; Perronnet, 2004), smectite minerals are altered into Si-Al-Fe gels which 76
mature into Fe-rich 7 Å minerals. At 300°C, Guillaume (2002) and Guillaume et al. (2003) 77
indicated that smectites are converted into Fe-rich 14 Å chlorites. Lantenois (2003) and 78
Lantenois et al. (2005) carried out experiments with different smectites in order to evidence 79
the cristallo-chemical features which influence smectite/Fe(0) interactions. Results are 80
described by the Lantenois’ rules: at 80°C, the oxidation of metallic iron by smectites i) 81
occurs only for dioctahedral smectites and for pH>7; ii) is favored by the interlayer spacing 82
(the proportion of altered smectite increases from K-, to Ca- to Na-saturated samples) and by 83
the presence of Fe3+ in octahedral sheets even in very low amounts; iii) for a given Fe3+
84
content, the quantity of altered smectite is more important for beidellite (tetrahedral deficit) 85
than for montmorillonite (octahedral deficit). 86
In the case of a composite clay material (FoCa7 bentonite), Perronnet (2004) indicated that in 87
the presence of Fe(0) at 80°C, montmorillonites are more altered than beidellites. But the 88
structural formulas of FoCa7 smectites (Gin et al., 2001) show that FoCa7 beidellites have a 89
tetrahedral charge, a higher Ca2+ interlayer content and a higher Fe3+ octahedral content than 90
FoCa7 montmorillonites. Therefore, the observations of Perronnet (2004) contradict 91
Lantenois’ rules and give evidence that other parameter(s) influence(s) the reaction rate of the 92
smectite-Fe(0) interaction. 93
94
Other possible controlling parameters, which were not analyzed in Lantenois' work, are those 95
describing the surface properties. Indeed, phyllosilicate surfaces have strong differential 96
reactivity because of the extreme anisotropy of their structure (Cases et al., 1986; Bickmore 97
presence of defects (Metz et al., 2005). For example, concerning the alkaline dissolution of 99
smectites (Sato et al. 2003), it has been confirmed that the reaction rate increases with pH 100
and, using in-situ observations, that the dissolution is congruent and dominated by the 101
reactivity of the edge faces of the mineral. 102
At present, two main techniques based on low pressure adsorption and Atomic Force 103
Microscopy (AFM) are proposed to determine the geometrical heterogeneities of flat solids. 104
Low pressure adsorption techniques have been used for a long time to assess surface 105
morphology and heterogeneity of phyllosilicates (Cases et al., 1986, 2000; Villiéras et al., 106
1992, 1997, 2002). Using low pressure adsorption microcalorimetry (Cases et al., 1986, 107
2000) or low pressure quasi-equilibrium adsorption manometry (Cases et al., 2000, Michot et 108
al., 1990, 1994, Sayed-Hassan, 2005, 2006, Villiéras et al., 1992, 1997), it was established 109
that the adsorption of argon on basal and edge faces of non polar phyllosilicates (talc, 110
kaolinite) can be detected. Consistent basal and edge specific surface areas of charged, non-111
swelling and swelling lamellar minerals such as illite (Villiéras et al., 2002, Bardot, 1998, 112
Bardot et al., 1998), lamellar silicas (Eypert-Blaison et al, 2002), saponites (Michot & 113
Villiéras, 2002) and montmorillonite (Tournassat et al., 2003) were obtained from low 114
pressure argon adsorption experiments. 115
Atomic Force Microscopy (AFM) is used to study crystal morphology and structure, 116
microtopography, surface heterogeneities down to molecular scales and the distribution of 117
surface areas (Blum, 1994; Nagy, 1994; Nagy and Blum, 1994; Hochella, 1995; Hochella et 118
al., 1998; Brady et al., 1996; Nagy et al., 1999; Sutheimer et al., 1999; Bosbach et al., 2000; 119
Bickmore et al., 2002; Tournassat et al., 2003; Metz et al., 2005). Atomic Force Microscopy 120
presents the advantage of providing surface area data selectively for individual crystal faces 121
and, when using this technique in-situ, it is possible to characterize the surfaces while the 122
clay particles are exposed to an aqueous solution under defined conditions. The reactivity of 123
smectite surfaces has already been investigated using AFM techniques (e.g., Metz et al. 124
2005). It was shown that basal plane dissolution may contribute to phyllosilicate bulk 125
dissolution rates (Blum, 1994; Huertas et al., 1999; Cama et al., 2002; Brandt et al., 2003; 126
Ganor et al., 2003), but the dissolution process is dominated by the chemical attack on edge 127
sites (Metz et al. 2005). 128
In a recent study, Tournassat et al (2003) showed that comparable morphological parameters 129
of montmorillonite clay platelets can be obtained using AFM and low pressure argon 130
adsorption. Particularly, it is useful for the determination of edge surface area and the 131
perimeter to basal area ratio, which can be considered to be independent of the stacking 132
conditions of the clay layers, as long as the stacking does not change the accessibility of 133
argon to the lateral surfaces of the particles. Thus, each technique can be used depending on 134
its availability and the required accuracy. Atomic force microscopes are more popular and 135
accessible than low pressure argon adsorption setups. The main difficulty with AFM is the 136
requirement of an important running time in order to analyze enough particles to get accurate 137
statistical values (Sayed-Hassan et al., 2006). Moreover, sample preparation can be tricky 138
(Bickmore et al., 1999; Metz et al., 2005). Low-pressure argon adsorption seems more 139
advantageous to derive mean values for samples having broad particle size distributions 140
because of the huge amount of particles taken into account in the adsorption system (Sayed 141
Hassan et al., 2006). 142
143
In this context, our objective is to analyze the possible links between the reaction rate of 144
smectite/Fe(0) and the geometric and energetic characteristics of the basal and edge surfaces 145
of different dioctahedral smectites. The reactions between three different smectites and Fe(0) 146
were studied by short-term tests (3 months) at 80°C and the initial geometric and energetic 147
properties of these smectites were analyzed by classical nitrogen adsorption/desorption at 77 148
K and low pressure argon adsorption at 77 K. 149
150
3. MATERIALS AND METHODS 151 152 3.1. Reagents 153 154 3.1.1. Smectites 155 156
Lantenois’ rules (Introduction) indicate that smectites react with Fe(0) if they are 157
dioctahedral. The reaction rate is influenced by the octahedral Fe3+ content as well as the 158
interlayer spacing. For these reasons, three dioctahedral smectites having varied Fe3+ content 159
were selected. They were also chosen because of the low content (in accessory minerals) of 160
the bentonite from which they are extracted, and because they have equivalent surface 161
characteristics (specific surface area, edge surface area). Montmorillonite OrduArtikli was 162
extracted in the Ordu area of the Eastern Pontides in Turkey and was provided by the Société 163
Française des Bentonites et Dérivés (SFBD). Beidellite “Nontronite” is a Fe3+-rich beidellite 164
which is abusively called nontronite. It was provided by Ward’s. Montmorillonite Prassa was 165
extracted in the quarry of the Kimolos Islands in Greece and was provided by the SFBD. 166
The argillaceous nodules were separated from the bulk bentonite for OrduArtikli and Prassa. 167
Then, the smectite fraction of the 3 samples was extracted by successive sieving-separations 168
to remove coarse particles. The structural formula of OrduArtikli 169
(Si3.92Al0.08)(Al1.29Fe3+0.14Fe2+0.04Mg0.53)Ca0.2Na0.12Mg0.06K0.01 (Habert et al., 2006)
170
Nontronite (Si3.64Al0.36)(Al1.0Fe3+0.93)Ca0.29, and Prassa
171
(Si3.92Al0.08)(Al1.54Fe3+0.10Mg0.44)Ca0.08Na0.06K0.05 (Christidis, 1998) per O10(OH)2 were
172
established by EDS-TEM microchemical analyses. 173
The purified smectites were Ca-exchanged in order to avoid the influence of interlayer 174
cations during the smectite-Fe(0) test. 175
176
3.1.2. Evian natural mineral water
177 178
Evian mineral water (France) was chosen because its chemical composition is stable and 179
similar to the pore water chemistry of argillaceous or calcareous formations. It is mainly 180
bicarbonate and magnesia rich water (Table 1). 181
182
3.1.3. Metallic iron
183 184
Metallic powder was used to simulate the iron fluxes released by the metallic part of a 185
radioactive waste disposal. Metallic iron was purchased from Merck and is a 99.9778 wt% 186
pure Fe(0) powder containing N, Cl, S, Pb, Cu, Mn, Zn and As as trace elements. Its small 187
diameter, 10 µm, insures high reactive surface area and, therefore, enhances the reaction-rate. 188
189
3.2. Smectite purification 190
191
Samples used in this study were previously purified in order to control chemical and physical 192
properties of the reacting clay. The purification procedure (Kohler 2001) is based on powder 193
dispersion in purified water for 24 hours (100 g clay, 1 L water). Purified water was then 194
added drop by drop to the agitated clay-suspension and wet sieved using a set of vibrating 195
sieves (200 μm and 20 μm). 196
The <20 μm clay fraction was then diluted in purified water and centrifuged (10000 rounds 197
per minute) for 30 minutes. The solid was freeze-dried and hand-ground into a mortar. 198
To control interlayer composition, purified smectites were dispersed in deionized water with 199
clay content lower than 50 g.L-1 and exposed to 0.1 M CaCl2 (for smectites used in the tests
200
with Fe(0)) or 1 M NaCl (for smectites used in gas adsorption analyses), as it was 201
demonstrated that the exchangeable cations used should be lithium or sodium, to derive an 202
accurate argon specific surface area and aspect ratio (Bardot, 1998; Bardot et al., 1998; 203
Villiéras et al., 2002; Sayed-Hassan et al. 2005). The solutions were left in dialysis 204
membranes for a duration of 24 hours. Three exchanges followed using several washings in 205
purified water, in order to remove excess ions. After the last wash step, the clay fraction was 206
extracted from the dialysis pocket, centrifuged (10000 rounds per minute) for 30 minutes, 207
freeze-dried, gently ground into a mortar and homogenized. 208
As observed by Christidis (1998), the purified Prassa sample contains opal-CT as an 209
accessory contaminant. From a mineralogical point of view, the comparison between the 210
measured CEC (74 meq/100g) and the CEC calculated from half the unit cell (75 meq/100g ) 211
suggests that the amount of opal-CT is around 2% in the purified sample. Opal is known to 212
dissolve in slightly to moderately alkaline solutions. Its specific surface area ranges between 213
7 and 15 m2/g (Bustillo et al. 1993). Taking into account the low amount of this mineral in 214
the studied sample, it can be assumed that its influence is negligible on measured specific 215 surface areas. 216 217 3.3. Experimental media 218 219
To perform Fe(0)/clay reaction tests, purified Ca-exchanged smectites, metallic iron and 220
ratios (I/C) of 0 and 1/3 and clay/solution mass ratios of 1/16.7 were used. The duration of 222
the experiment was fixed to 3 months. The experimental temperature of 80 °C was obtained 223
by heating the test tubes in a thermostatic oven. After the time was complete, samples were 224
quenched and centrifuged at 7300 rpm for 150 minutes. Sealed test tubes were then 225
introduced into a glove box in order to measure the pH of the supernatant and to separate 226
solutions from solid phases. The solid phases were then freeze-dried, gently ground into a 227
mortar, homogenized and stored in hermetically closed and vacuumed boxes. 228 229 3.4. Analytical methods 230 231 3.4.1. pH measurements 232 233
The pH measurements of the supernatant were carried out at room temperature using a 234
Denver Instrument 215 pH-meter. 235
236
3.4.2. Cation Exchange Capacity
237 238
The Cation Exchange Capacity (CEC) of the samples were measured using the Cu-239
ethylenediamine (Cu-En2) method (Mantin, 1969), suitable for solutions with pH > 6. Thirty
240
milliliters of Cu-En2 and 0.5 g of clay were mixed and shaken in a Turbula for two hours. The
241
mixture was centrifuged at 7300 rpm for 30 minutes and the extracted solution was filtered at 242
0.22 μm. The residual Cu-En2 concentration was then determined by measuring the
243
absorbance at 548 nm with a Beckman DU-7000 spectrophotometer. 244
3.4.3. 57Fe Mössbauer Spectroscopy
246 247
57Fe Mössbauer spectroscopy was used to estimate the respective amounts of iron in the clay
248
structures as well as in oxyhydroxides and magnetic phases. This method also gives the 249
respective amounts and coordination nuber of Fe2+ and Fe3+ in the clay fraction. 250
One millimeter thick samples were obtained from pellets of homogenized powder, coated 251
with Epoxy resin, dried under a vacuum box at 25 °C and polished. 252
Spectra were recorded on a Mössbauer spectrometer with a 15 mCi source of 57Co in 253
rhodium. They were taken in constant triangular acceleration mode in 512 channels. The 254
spectrometer was calibrated at room temperature (RT) with a 25 µm foil of α-Fe, the isomer 255
shifts are given with respect to α-Fe. A limited number of components (sextet and doublet) 256
were used to fit the spectra using the MOSS program written by Bonnin (ESPCI Paris). In 257
this program, magnetic hyperfine-field distributions of the components, which are common in 258
soil Fe-oxides, are treated according to the model developed by Bocquet et al. (1992). Spectra 259
obtained at low (15 K) and room temperatures differed only in the smaller distribution width 260
of the magnetic lines of ternary oxides in the low temperature spectra. As this distribution 261
width had no influence on our analysis of ternary oxide content, we obtained all reported 262
spectra at room temperature. 263
264
3.4.4. X-Ray Diffraction
265 266
X-Ray Diffraction (XRD) patterns were recorded on non oriented samples to obtain 267
qualitative mineral analysis of the samples. A D8 Bruker diffractometer (45 kV, 40 mA), 268
with CuKα radiation equipped with a graphite monochromator and a NaI scintillation 269
detector was used. 270
271
3.4.5. Step by step nitrogen adsorption and high-resolution argon adsorption
272 273
Nitrogen adsorption–desorption isotherms at 77 K were recorded on a step-by-step automatic 274
home-built setup described in Neaman et al. (2003) and Marrocchi et al. (2005). Pressures 275
were measured using 0–1000 Pa and 0–100,000 Pa Baratron-type pressure sensors provided 276
by Edwards. The nitrogen saturation pressure was recorded in situ using an independent 0-277
100,000 Pa Baratron-type pressure sensor provided by Edwards. 278
Specific surfaces areas (SSA) were determined from adsorption data by applying the 279
Brunauer–Emmet–Teller (BET) equation (Brunauer et al., 1938) and using 16.3 Å2 for the 280
cross-sectional area of nitrogen (Gregg and Sing, 1982) In the present study, the error in the 281
determination of the SSA was estimated as ±4 m2/g. Micropore volumes and nonmicroporous
282
surface areas were obtained using the t-plot method proposed by de Boer et al. (1966). Pore 283
size distributions and mesopore volumes were calculated according to the BJH method 284
(Barrett et al., 1951; Olivier, 1996). 285
Approximately 250 mg of purified Na-exchanged smectites were out gassed overnight at 286
110°C and under a residual pressure of 0.01 Pa. Nitrogen N55 (purity >99.9995%) used for 287
experiments was provided by Alphagaz (France). 288
The experimental procedure for high-resolution and low-pressure argon adsorption has been 289
discussed by Rouquerol et al. (1988), Michot et al. (1990) and Marrocchi et al. (2005). The 290
quasi-equilibrium manometric technique proposed by Grillet et al. (1977) and Rouquerol et 291
al. (1988) was used to enhance the resolution of the adsorption isotherms in the low-pressure 292
range, when the first layer of gas is adsorbed on the surface. Using pressure sensors that work 293
at low pressures, this method allows the study of surface heterogeneity of solids under 294
appropriate conditions. In the case of phyllosilicates, it has been demonstrated that such 295
adsorption experiments, coupled with a careful analysis of experimental adsorption 296
isotherms, enable a derivation of a shape factor, i.e., lateral and basal surface areas (Bardot et 297
al., 1998; Cases et al., 1986, 2000; Michot et al., 1994, 2002; Sayed-Hassan et al., 2005, 298
2006, Villiéras et al., 1992, 1997a, 1997b, 2002). 299
The quasi-equilibrium technique is based on adsorbate introduction with a slow, constant and 300
continuous flow rate through a micro leak (Rouquerol et al., 1988, Michot et al., 1990). The 301
flow rate was kept constant, at least up to the BET domain, and was controlled by the 302
pressure imposed before the leak. If the introduction rate is low enough, measured pressures 303
can be considered quasi-equilibrium pressures. Then, from the recording of quasi-equilibrium 304
pressures (in the range of 10-3 to 3 104 Pa) as a function of time, the adsorption isotherm was
305
derived. The set-up used has been described in Villiéras et al. (1997b) and Marrocchi et al. 306
(2005). For argon adsorption, 77 K sample temperature is insured by a dynamic and accurate 307
constant level of liquid nitrogen which was itself controlled by a home-made electronic 308
device. Three high accuracy MKS differential pressure transducers were used for pressure 309
measurements: (1) 0-1.3 Pa, (2) 0-1.3 102 Pa and (3) 0-1.3 105 Pa (698 type Baratron pressure 310
transducers). The minimal sensitivities were 1.3 10-4, 1.3 10-2 and 1.3 Pa for gauges (1) to (3) 311
respectively. Pressure accuracy was 0.05% of read pressure. A dynamic pressure, lower than 312
10-3 Pa, was ensured on the reference side by the use of a turbomolecular vacuum pump. The 313
frequency of the pressure recording was adjusted after each measurement to record 100-200 314
experimental points per unit log of relative pressure. Thus, 2000 to 3000 experimental points 315
were collected per experiment for relative pressure lower than 0.15 (Villiéras et al. 1992, 316
1997b). 317
The experimental information was analyzed using the Derivative Isotherm Summation (DIS) 318
procedure designed by Villiéras et al. (1992, 1997a, 1997b), to examine the surface energetic 319
heterogeneity of the samples. Due to the large number of experimental data points acquired 320
by the quasi-equilibrium technique, the experimental derivative of the adsorbed quantity as a 321
function of the logarithm of relative pressure could be calculated accurately. In the present 322
case, samples were considered as not microporous for argon (see results section) and 323
multilayer adsorption could be mathematically removed from experimental adsorption 324
isotherms. The derivatives then corresponded to the first layer free energy adsorption 325
distribution and could be regarded as fingerprints of interactions between given solid/probe 326
couples. 327
The total derivative adsorption isotherm on a heterogeneous surface was modeled by 328
considering two scales of heterogeneity: in the case of crystalline minerals, the surface can be 329
divided into i different crystal faces (patchwise distribution), each face having its own 330
heterogeneity continuously distributed around a mean value (random distribution). The 331
adsorption isotherm on such a heterogeneous surface can be written as: 332 ε ε χ ε θ θ θt X X i i d i i it i i
∑
∫
( ). ( ).∑
Ω = = 333where θ is the total adsorption isotherm, θit the adsorption isotherms on the different energetic
334
domains of the surface, Xi is its contribution to θit, ε is the adsorption energy, Ω is the
335
physical domain of ε, θi(ε) a “local” theoretical adsorption isotherm and χi(ε) is the dispersion
336
of ε on the ith domain. The experimental curve can then be fitted with theoretical local 337
isotherms derived from the Langmuir (with Bragg-William-Tempkin improvement to take 338
into account lateral interaction), BET (with Hill improvement to take into account lateral 339
interactions) and Dubinin-Astakhov formalisms (Villiéras et al., 1992, 1997a, 1997b). 340
In the present work, experimental derivatives were modeled after mathematical elimination of 341
multilayer adsorption contribution in the low energy region (right hand side of the curves) 342
(Villiéras et al., 1997a; Manleev et al., 2002). DIS fitting procedure was then applied to the 343
first layer free energy adsorption distribution using the Bragg-William-Tempkin model as a 344
local adsorption isotherm (Villiéras et al., 1992, 1997a, 1997b). Each local isotherm is 345
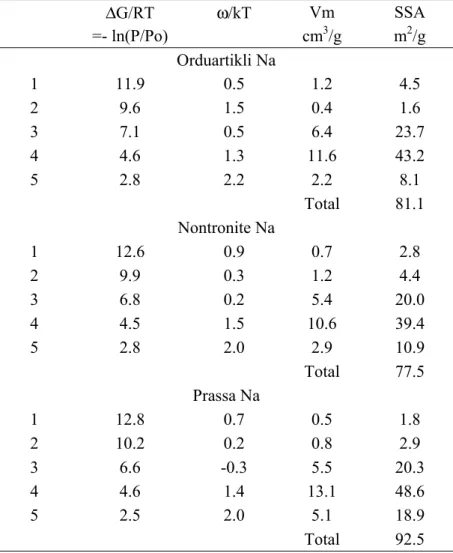
characterized by three parameters. The first one is the peak position, ln(P/P0), proportional to
346
the free adsorption energy ΔG (ΔG = - RT.ln(P/P0)), linked to CBET constant, i.e. the normal
347
interaction between the surface and an adsorbed molecule. The second one is the lateral 348
interactions, ω, between two neighboring adsorbed molecules. Lateral interactions are easily 349
detected through the shapes (half-height width) of the local derived isotherm. In fact, the 350
intensity of lateral interactions must be considered as a best-fit parameter, disclosing further 351
information about the heterogeneity of the considered adsorption domain (Bardot, 1998, 352
Bersillon et al., 2001; Mamleev et al., 2002; Villiéras et al., 1997b): generally, ω ranges 353
between 2.5 and 0 for argon, and lower values (even negative values) are obtained when the 354
spreading (variance) of the adsorption energy distribution increases. The last consideration is 355
the monolayer capacity, Vm, of the local isotherm, derived from the comparison between the
356
experimental height of the peak and the theoretical height of the local model. Monolayer 357
capacities can be converted to surface areas by taking into account the cross-sectional area of 358
adsorbed argon, 13.8 A² (McClellan and Harnsberger, 1967). 359
In our study, about 0.6 g of purified Na-exchanged smectites were out gassed at 0.001 Pa at a 360
temperature of 120°C. Argon N56 (purity>99.9996) was supplied by Alphagaz (France). 361
362
4. RESULTS 363
364
4.1. Smectite reactivity in the context of metallic corrosion 365
4.1.1. pH measurements
367 368
pH was systematically measured to control the basic character of Fe(0)/Clay interactions. In 369
each case, the pH was over 7 (Table 2). 370
When comparing the pH of the solution with I/C=1/3 and without iron (I/C=0), it was 371
observed that the presence of Fe(0) had no effect on pH for the test using OrduArtikli, 372
whereas increases in pH of 0.7 and 2.6 were recorded for the tests with Nontronite and Prassa 373
samples respectively. 374
375
4.1.2. Cation Exchange Capacity
376 377
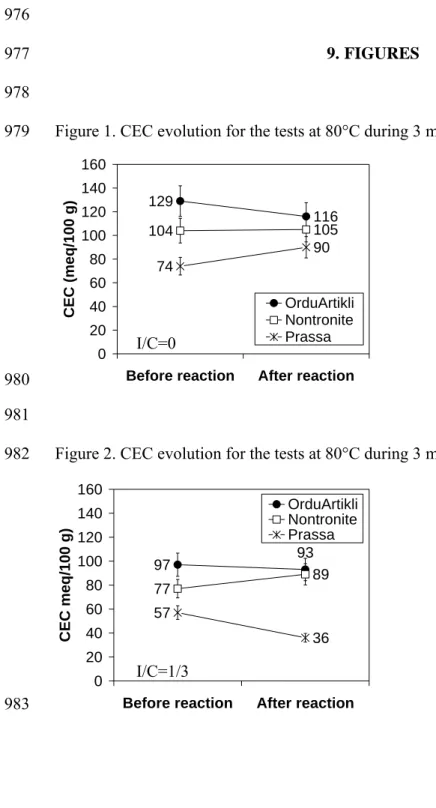
The Cation Exchange Capacity (CEC) of each sample was measured before and after the 378
reaction (Figure 1 and Figure 2) to verify the stability of smectite during reaction tests. Due 379
to the precision of CEC measurements, only variations greater than 10 % were considered 380
significant. 381
The CEC values for unreacted samples decreased with respect to Fe(0) supply, in agreement 382
with the dilution effect caused by the addition of metallic iron to the experimental 383
suspension. 384
When heating at 80°C for 3 months without iron (Figure 1), the CEC variations are -10 %, -1 385
% and +22 % for Orduartikli, Nontronite and Prassa samples respectively. These variations 386
were only significant for the Prassa sample. 387
With Fe(0) in the reaction mixture (Figure 2), the CEC variations are -4 %, +16 % and -37 % 388
for Orduartikli, Nontronite and Prassa samples, respectively. Only the CEC variations for 389
Nontronite and Prassa samples could be considered significant. 390
In conclusion, Fe(0) supply influences the CEC of Nontronite and Prassa clays, but not that 391 of OrduArtikli clay. 392 393 4.1.3. 57Fe Mössbauer spectroscopy 394 395
57Fe Mössbauer spectroscopy was used to quantitatively determine the modifications in the
396
distribution of iron species. Since there is no modification of the XRD (see next §) and CEC 397
value after interaction between OrduArtikli and Fe(0), this sample is considered poorly 398
reactive. Mössbauer spectra were only acquired for Nontronite and Prassa. 399
Before the reaction, the distributions of iron species in Nontronite-Fe(0) and in Prassa-Fe(0) 400
mixtures were different (Figure 3 and Figure 4). Nontronite is a beidellite which contains 401
Fe(III) whereas in the Prassa-Fe(0) mixture, the initial iron mainly comes from the Fe(0) 402
supply. After reaction, the distribution of iron species was quite unchanged for Nontronite-403
Fe(0) mixture, unlike the Prassa-Fe(0) mixture (Figure 3 and Figure 4). There was only a 404
slight consumption of Fe(0) for Nontronite (-3%, 1.79 10-2 mol before reaction and 1.74 10-2 405
mol after reaction), which is balanced by the formation of Fe(III) (+6%, 7.06 10-3 mol before 406
reaction and 7.5 10-3 mol after reaction). For Prassa, the consumption of metallic iron is high 407
(-64%, 1.79 10-2 mol before reaction and 6.45 10-3 mol after reaction.) and is balanced by the 408
formation of Fe(III)-species (+2087%, 4.08 10-4 mol before reaction and 8.92 10-3 mol after 409
reaction), Fe(II) species (+552%, 4.08 10-4 mol before reaction and 2.66 10-3 mol after 410
reaction) and iron oxides (+278%, 2.51 10-4 mol before reaction and 9.49 10-4 mol after 411
reaction). Magnetic spectra for these iron oxides correspond to a spinel structure, so these 412
oxides may be magnetite. Mössbauer parameters for Fe(III) and Fe(II) are consistent with 413
their presence in amorphous phases, such as gel phases, and/or phyllosilicate octahedral 414
416
4.1.4. X-Ray Diffraction (XRD)
417 418
The X-Ray Diffraction was used to estimate the qualitative evolution of the smectite-Fe(0) 419
mixtures at 80°C over 3 months. In order to take into account the dilution effect created by 420
metallic iron supply, the X-Ray diffractograms of “I/C=1/3 mixtures” were compared before 421
and after reaction. 422
The X-Ray diffractogram of the reacted OrduArtikli-Fe(0) mixture did not show any 423
significant variation (Figure 5). The 15.14 Å, 4.48 Å, 3.04 Å, 2.57 Å and 1.50 Å peaks of 424
smectite did not change either in position or in intensity. The 2.02 Å peak of Fe(0) was also 425
unaffected. 426
The same conclusions were made for the Nontronite-Fe(0) mixture (Figure 6). On the XRD 427
pattern, the peaks of smectite are unchanged (14.93 Å, 4.53 Å, 3.03 Å, 2.58 Å and 1.51 Å). 428
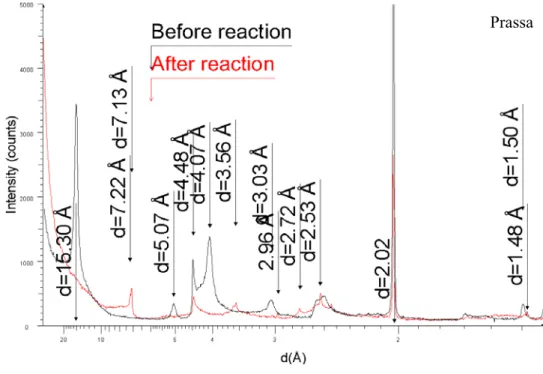
Unlike OrduArtikli or Nontronite, the diffractogram of the reacted Prassa-Fe(0) mixture is 429
very different from the unreacted one (Figure 7). The peaks attributed to smectite (15.3 Å, 430
5.07 Å, 4.48 Å, 3.03 Å and 1.50 Å) are hardly visible. The intensity of the Fe(0) peak is also 431
much lower. In addition, new peaks can be seen at 7.22 Å, 7.13 Å, 3.56 Å, 2.96 Å, 2.72 Å 432
and 2.53 Å. The 7.13 Å, 3.56 Å and 2.53 Å peaks may be related to the formation of Fe-rich 433
7 Å minerals such as berthierine (JCPDS 31-618). As observed by Lantenois et al. (2005), 434
2.96 Å, 2.53 Å and 1.48 Å peaks are assigned to the formation of magnetite (JCPDS 19-629). 435
On the XRD spectra (peaks at 4.07 Å and 2.48 Å), opal-CT is visibly present in the Prassa-436
Fe(0) unreacted mixture, whereas it is not visible in the reacted mixture. It is known that 437
silica is soluble in water from pH=9. When Prassa is altered without Fe(0) at 80°C for 3 438
months, the pH equals 8 and opal-CT remains present in the reacted mixture (Perronnet, 439
2004). The same result was obtained for I/C=1/20 (pH=8) and I/C=1/10 (pH=8) (Perronnet, 440
2004), whereas opal-CT disappeared from I/C=1/3 when the pH reached 10.6. 441
442
4.2. Geometric and energetic surface properties 443
444
4.2.1. Nitrogen adsorption/desorption at 77 K
445 446
Nitrogen adsorption/desorption experiments were carried out to obtain main information on 447
the textural properties of the studied samples: specific surface areas and pore size 448
distribution. Adsorption/desorption curves are shown in Figure 8. First of all, it should be 449
pointed out that adsorption/desorption isotherms present the classical features observed for 450
swelling clays (Michot & Villiéras, 2002, Neaman et al., 2003, Marrocchi et al., 2005) with 451
both microporosity and mesoporosity. In the low pressure region (<0.4), corresponding to the 452
filling of micropores and the completion of the first monolayer on external particle faces, 453
adsorption isotherms are superimposed, showing that the total specific surface areas of the 454
three samples are within the same range. This is confirmed when the different numerical 455
analyses are applied to experimental data (Table 3). Indeed, BET, t-plot and mesoporosity 456
calculations yield specific surface areas ranging between 101 and 115 m2/g. BET specific 457
surface area is slightly lower than those derived from t-plot and mesoporosity calculations, 458
which is in agreement with the fact that the samples appear slightly microporous. 459
Microporosity is less important for Prassa than for Nontronite and Orduartikli and external 460
surface area (without micropores) of particles increases from Orduartikli to Nontronite and 461
Prassa. For the three samples, microporosity is not quantitatively important (compared to 462
zeoliths or activated carbons, for instance) and errors on the determination of micropore 463
be pointed out that the assessment of microporosity for charged clay minerals is rather tricky, 465
as it was demonstrated that specific interactions between nitrogen and surface cations (Bardot 466
et al., 1998, Michot and Villiéras, 2002) can occur in such a way that the total amount of 467
adsorbed nitrogen molecules on the surface would appear higher than the amount required for 468
monolayer completion (Michot et Villiéras, 2002). The corresponding additional adsorbed 469
amount would be attributed to microporosity, as determined from t-plot procedure. This 470
phenomenon probably occurs in the present case, as nitrogen external surface areas derived 471
from the t-plot (+/- 20%) agree fairly with total argon surface areas derived from low 472
pressure adsorption experiments (see next section and SAr in Table 3), as pointed out by
473
Michot and Villiéras (2002) for different saponites. 474
In the high relative pressure region (> 0.45), corresponding to multilayer adsorption and the 475
filling of the mesoporosity, great differences are observed (Figure 8). Orduartikli appears 476
slightly mesoporous with a vertical closure of the hysteresis loop around 0.44 in P/Po, as is 477
generally observed for such materials and is typical of closed mesoporosity inside clay 478
aggregates (Neaman et al., 2003). The same features are observed for the Nontronite sample, 479
which is more mesoporous than Orduartikli. For Prassa, which is the most mesoporous 480
sample, the shape of the adsorption/desorption loop is different, suggesting a more open 481
intra-aggregate mesoporosity. The total calculated mesoporosities agree with present 482
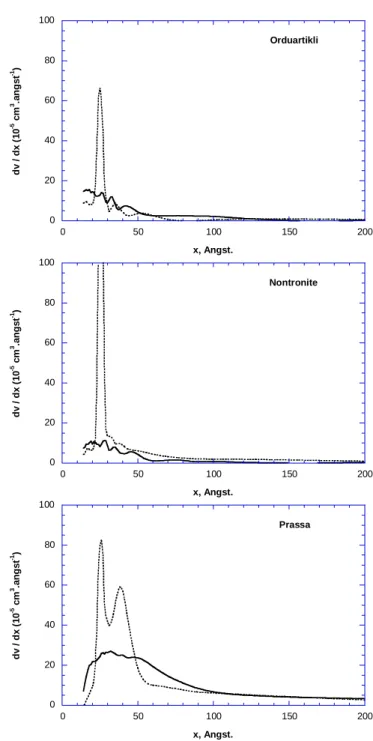
observations (Table 3). Calculated pore size distributions (Figure 9) from the adsorption 483
branch and the desorption branch, which correspond to true Pore Size Distribution (PSD) and 484
access PSD, respectively (Neaman et al., 2003), show that pore access corresponds mainly to 485
pores smaller than 2.5 nm. This is not seen in the Prassa sample, which presents an additional 486
access size around 3.8 nm. The differences in mesoporosity observed for the studied samples 487
can not yet be fully explained. Indeed, particle arrangement and pore size distribution of 488
swelling clay minerals differ considerably in the same sample, depending on dehydration 489
conditions, apparent density, exchangeable cations, etc. (Neaman et al., 2003, Michot and 490
Villiéras, 2006, Bihannic, 1998). In the case of the Prassa sample, PSD may also be 491
influenced by the presence of small opal-CT particles in clay aggregates. Mesopore size 492
distribution, however, is not considered a key parameter for the present study, as particles and 493
aggregate organizations will be different in suspension, i.e. under smectite/Fe(0) interaction 494
conditions. 495
496
4.2.2. Low pressure argon adsorption at 77 K
497 498
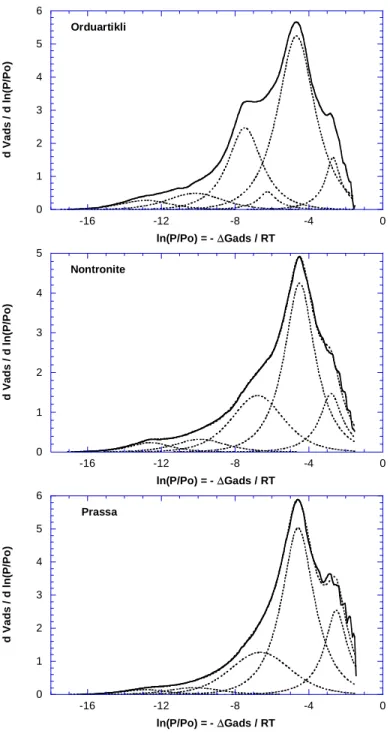
Low pressure argon adsorption at 77 K was carried out in order to derive information on the 499
surfaces of smectite particles and to analyze it from the point of view of variability in 500
geometric (lamellarity) and energetic (surface chemistry) characteristics. The experimental 501
curves obtained in the region corresponding to the adsorption of the first monolayer (P/Po=0 502
to 0.175, BET region) are displayed in Figure 10 as a function of the logarithm of the relative 503
pressure. On this figure, it can be observed that the features are similar and adsorbed amounts 504
are within the same range in all samples, as previously observed with nitrogen. 505
506
The present curves were further analyzed using the derivative adsorption isotherm instead of 507
the adsorption isotherms, as these curves are much more sensitive to the influence of surface 508
heterogeneities. The obtained derivative curves are displayed in Figure 11 along with their fit, 509
using the DIS procedure designed by Villiéras et al. (1992, 1997). Adsorption energy 510
distributions reveal the classical features observed for phyllosilicates, with a mean peak 511
located around -5, corresponding to the adsorption on basal surfaces, while the shoulder at 512
higher energy, centered around -7, corresponds to the adsorption on edge faces. 513
Using the DIS procedure and the Brag-William-Temkin equation, the three derivatives are 514
modeled with 5 local isotherms. As is usually obtained with argon, the 3 high energy peaks 515
(N° 1 to 3 in Table 4) can be assigned to the adsorption on edge faces, and the two low 516
energy peaks (N° 4 and 5 in Table 4) to the adsorption on basal faces. 517
It can be observed that the peak positions corresponding to basal faces (domain 4) are the 518
same for the 3 samples, around -4.5. In the same way, the corresponding lateral interaction 519
parameter ω can be considered as identical, 1.4 ± 0.1, for the three samples. 520
The situation is totally different for edge faces, as it can be observed that adsorption energies 521
for the less important domains 1 and 2 (inverse of peak positions) increases as follows: 522
Orduartikli < Nontronite < Prassa. From a chemical standpoint, these high energy adsorption 523
sites could be attributed to chemical variability or non-uniform morphology such as local 524
defects, corners or ridges of particle surfaces. The peak positions of domain 3, which 525
correspond to the most important part of the lateral surfaces, behave in the reverse order, 526
Prassa < Nontronite < Orduartikli. However, it is interesting to notice that the lateral 527
interaction parameter (ω/kT) also increases from Prassa to Nontronite and to Orduartikli 528
samples. This result indicates that i) edge surfaces of the Orduartikli sample can be 529
considered the most homogeneous (less variability in gas/surface site interactions), in 530
agreement with the fact that adsorption energies of domain 1 and 2 are the lowest of the 531
sample set; ii) edge surfaces of the Prassa sample can be considered to be the less 532
homogeneous, in agreement with the fact that adsorption energies of domain 1 and 2 are the 533
highest of the sample set; iii) homogeneity of the edge surfaces of nontronite is intermediary. 534
It can also be pointed out that peaks of domains 1 and 2 are often considered as residual and 535
their positions are generally not accurate. In the present case, the fact that the positions of 536
these peaks behave in the same way as the lateral interaction of the major peak (domain 3) 537
suggest that their evolutions within the samples are relevant. 538
From a quantitative point of view, the amount of high energy adsorption sites on edge faces 539
(domain 1 and 2) correspond to 20, 26 and 19% of the total edge surface area for Orduartikli, 540
Nontronite and Prassa, respectively, without correlation to the energy classifications 541
discussed above. Total basal and lateral surface areas are reported on Table 5. Edge surface 542
areas are in the same range for Orduartikli and Nontronite, while for Prassa, basal surface 543
area is higher and edge surface area is lower than that of the two other samples. As proposed 544
in Tournassat et al. (2003), mean characteristic length (l) and thickness (t) of the particles can 545
be evaluated from basal and lateral surface areas by considering a simple square base: 546
l = 4 /ρ·Sl and t = 2 / ρ·Sb
547
where ρ is the density (2.7) and Sl and Sb, the lateral and basal surface areas, respectively. 548
The length of the particle increases from Orduartikli to Nontronite to Prassa (Table 5). This 549
increase in length is probably at least partly responsible for the increase in mesoporosity as 550
derived from nitrogen adsorption/desorption experiments. Taking into account the theoretical 551
thickness of one dry smectite unit layer (taken to be equal to 9.5 Å), the average number of 552
2:1 layers per stack is around 15 for Orduartikli and Nontronite and 11 for Prassa. 553
554
5. DISCUSSION 555
556
The analyses of the reaction products show that smectites do not react equally with Fe(0). For 557
OrduArtikli, the modifications in the pH, CEC and XRD diffractogram are negligible at the 558
end of the “80°C-3 months-I/C=1/3” test. Concerning Nontronite, a slight increase in pH 559
(+0.7), a slight consumption of Fe(0) (-3%) and formation of Fe(III) (+6%) and an increase in 560
CEC (+16%) are observed while the intensity of the whole XRD spectrum is unchanged. On 561
the contrary, for Prassa, the pH of the solution increases significantly (+2.6), the consumption 562
incorporation of Fe(II) and Fe(III) in gel phases or in clay octahedral sheets. The decrease in 564
CEC (-37%) is important and on the XRD pattern, the signal of smectite is hardly 565
recognizable, while peaks for 7 Å clays and magnetite appear. 566
Lantenois et al. (2005) demonstrated that the percentage of altered smectites can either be 567
estimated by using XRD analyses in transmission geometry with an internal standard 568
(corundum) or by CEC measurements. These two methods gave the same results (fig 4a in 569
Lantenois et al. 2005) with the same precision (±10 %). In the present study, XRD and CEC 570
appear to be complementary techniques for sorting the samples with respect to their initial 571
reactivity. It is thus necessary to understand the meaning of the increase in CEC for 572
Nontronite and its decrease for Prassa. For this purpose, CEC results will first be analyzed in 573
the framework of bibliographic information on the destabilization mechanism of smectite 574
minerals. Finally, the reaction rates of the smectite-Fe(0) reactions will be put in parallel with 575
the geometric and energetic characteristics of the smectite surfaces. 576
577
5.1. Destabilization mechanisms and relative reactivity of the studied smectites 578
579
The reaction between smectites and Fe(0) can be described by three individual mechanisms: 580
1. The reduction of structural Fe3+ when smectite is in contact with Fe(0) or, more likely, 581
with Fe2+ resulting from the oxidation of Fe(0) (Lantenois et al., 2005, Wilson et al., 582
2006). In reductive conditions, as is the case when clay minerals interact with Fe(0), 583
Fe3+ in smectites is reduced to Fe2+ with an increase of the layer charge, i.e. of the 584
CEC, which needs to be balanced by the uptake of H+ or other cations in the interlayer
585
space (Stucki et al., 1984; Manceau et al., 2000; Favre et al., 2002,). The uptake in H+
586
from solution causes the pH to increase. 587
2. The alkaline destabilization of smectite into Si-Al-Fe gels or disordered regions 588
(Wilson et al., 2006). This mechanism occurs by edge dislocation, fragmentation in 589
the [ab] plane, which makes the CEC increase, and by local loss of tetrahedral layers. 590
3. The incorporation of Fe2+, derived from Fe(0) oxidation (Guillaume et al., 2004; 591
Lantenois et al.; 2005, Wilson et al., 2006), into altered smectites (gel-like phases). 592
These phases maturate into Fe-rich 7 or 14 Å non swelling minerals. That results in a 593
decrease of the CEC of the reaction product (Guillaume et al, 2004; Perronnet, 2004; 594
Lantenois et al., 2005; Wilson et al., 2006). 595
In the present study, it can be concluded from the stability of both the CEC values and the 596
XRD pattern of OrduArtikli, that the reaction between this smectite and Fe(0) is not initiated. 597
On the contrary, the significant decrease in CEC (-37 %) measured for Prassa samples in the 598
presence of Fe(0), and the analysis of its run products by XRD and the formation of Fe-rich 7 599
Å clays, show that the reaction between smectite and Fe(0) is already advanced. The potential 600
high reactivity of this sample is also suggested by its CEC increase (+22 %) at 80°C in the 601
absence of iron supply, which may be attributed to some particle dissolution or/and 602
fragmentation in high temperature water. In addition, it was observed that for intermediary 603
I/C (1/20 and 1/10), the CEC of the reaction products increased in the same way while pH 604
was stable at 8 (Perronnet 2004). When the supply in Fe(0) is important enough (I/C≥1/3), 605
the oxidation of Fe(0) by smectites makes pH increase, in agreement with the smectitic 606
corrosion mechanism proposed by Habert et al., 2006. It can also be noticed from XRD 607
analysis that for I/Cs ranging from 0 to 1/10 opal did not react, showing that the dissolution 608
of this phase may account for the increase in pH following the Fe(0)/smectite reaction. 609
In the case of Nontronite, the comparison of CEC results for the tests with and without Fe(0) 610
at 80°C shows that, in both cases, the heating has no effect on this parameter. Therefore, the 611
interaction of smectites with metal. This increase in CEC, without any significant structural 613
transformations observed in the XRD patterns, may correspond with the intake in cations 614
from the solution in order to balance the charge deficit due to the reduction of structural Fe3+ 615
by Fe(0) (stage 1). But, as the Mössbauer results indicate that this reduction did not happen 616
(Fe(III) +6%), fragmentation in the [ab] plane may be a more appropriate explanation for the 617
increase in CEC. 618
619
The destabilization rate of smectite when interacting with Fe(0) increases from OrduArtikli to 620
Nontronite and to Prassa samples. These smectites can be ranked with respect to the 621
tetrahedral layer charge (0.36 Nontronite > 0.08 OrduArtikli = 0.08 Prassa), the Ca2+
622
interlayer content (0.29 Nontronite > 0.2 OrduArtikli > 0.08 Prassa), and the Fe3+ octahedral
623
content (0.93 Nontronite > 0.14 OrduArtikli > 0.10 Prassa) per O10(OH)2. According to
624
Lantenois’ rules (2005), Nontronite should be more reactive than OrduArtikli, which also 625
should be more reactive than Prassa, which is in contradiction with our results. But, 626
Lantenois et al (2005) stressed that even if the reactivity of dioctahedral smectite is mainly 627
enhanced by increasing contents in octahedral Fe3+, other parameters should be found in 628
order to fully understand the evolution of smectite-Fe(0) systems. 629
630
5.2. Surface control of smectite reactivity towards Fe(0) 631
632
As mentioned in the introduction, numerous studies demonstrated that transformations of 633
smectite minerals at the solid-liquid interface are mainly centripetal processes starting at the 634
edges of the layers. The determination of the mean textural features of the samples, based on 635
N2 and Ar adsorption at 77K, allows us to compare particle shape, and particularly the
636
amounts of lateral surface area, with Fe(0)-smectite reactivity. 637
First of all, one can rapidly eliminate the dry particle shape as pertinent information; because, 638
when immersed in water, smectites will expand with interlayer cation hydration, and the total 639
number of clay layers per tactoïd is reduced. In addition, such parameters would lead to the 640
conclusion that the finest particles in volume (Orduartikli) are the least reactive ones. 641
Edge surface areas are roughly equivalent for the three samples, but a fine analysis of the 642
results shows that reaction rates increase when edge surface area decreases (Table 5). This is 643
contradictory with the statement that the quantity of edge surfaces controls the reactivity. The 644
definite differences in reactivity of the studied samples imply that edge surface area is not the 645
main textural controlling parameter. 646
Basal surface area is equivalent for Orduartikli and Nontronite and is higher for Prassa. 647
Considering the highest reactivity of the latter, it could indicate that basal faces of the clay 648
layers control the iron-smectite reactivity, but such basal-control is not likely to be the most 649
important mechanism, as it is contradictory to the admitted centripetal destabilization 650
mechanism, and the total basal area should be roughly the same for the three samples in their 651
hydrated state. Therefore something other than geometrical parameters should be found to 652
explain the surface reactivity of smectites in the presence of Fe(0). 653
654
Other accessible parameters concern the energetic properties of argon/surface interactions. 655
For the basal faces, the DIS peak positions and the apparent lateral interaction (ω) parameters 656
of domain 4 (Table 4) are equivalent, and no significant conclusion can be drawn as to the 657
influence of energetic surface properties of these faces on smectite reactivity. On the 658
contrary, the edge faces show marked differences, particularly when looking at peak positions 659
and apparent lateral interactions (ω). Indeed, these two parameters show that smectite 660
reactivity increases with surface heterogeneity and the surface energy of their edge faces. 661
663
6. CONCLUSIONS 664
665
It seems that the destabilization rates of the smectite-Fe(0) systems can be at least partially 666
explained by the energetic properties of the edge faces of the smectite. As stressed by 667
Bickmore (1999) and Bickmore et al. (2001), the high reactivity of the edge surfaces is 668
expected, because these surfaces are characterized by broken bonds and a well-known 669
tendency to form inner-sphere complexes with protons and other cations (e.g., White and 670
Zelazny, 1988; Zachara and McKinley, 1993; Charlet et al., 1993; Schlegel et al., 1999). 671
Metz et al., (2005) stressed that the relationship between BET surface area and the reactive 672
surface area is not trivial in minerals such as smectites, in which dissolution is controlled by 673
chemical attack on the edge surfaces. These authors suggest using AFM measurements of the 674
specific edge surface area as an alternative proxy for the reactive surface area of smectite. But 675
they insist on the fact that their results do not prove that this proxy is proportional to reactive 676
surface area. Indeed, it was observed that the dissolution kinetics of edge faces of smectites is 677
much faster for broken edge faces than for euhedral faces (Bickmore 1999). The absence of a 678
correlation with the edge surface area is confirmed by the fact that for our 3 smectites, the 679
reaction rate for their alteration increases with respect to decreasing edge surface area. On the 680
contrary, a positive correlation exists between the reaction rate for alteration and the variety 681
in the energetics of gas adsorption onto the edge faces (energetic “heterogeneity of edge 682
faces”). This variety illustrates the presence of i) crystallographic defects; ii) morphological 683
heterogeneities, such as nanoroughness, or iii) chemical heterogeneities, such as clusters, 684
substitutions and charge distributions as indicated by Bickmore (1999) and Bickmore et al. 685
(2001). Such a variety of situations is obviously enhanced if lateral surfaces are broken edge 686
faces rather than euhedral faces (Bickmore 1999). 687
Thus, the increase in the “energetic heterogeneity of edge faces” can be interpreted as an 688
increase in the probability for Fe(0) to find unstable sites on the smectite edges to transfer 689
electrons and initiate smectite destabilization. The rate controlling steps in the reaction seem 690
to be the reactions which occur on the sites of the edge faces. Both the fragmentation (with 691
and without Fe(0)) and the reduction, consecutive to electron transfer from Fe(0), of smectite 692
particles are enhanced when the heterogeneity of the edge faces is high. The ω parameter of 693
edge faces derived form argon adsorption can be considered as an exploration guide aiding 694
the prediction of the behavior of smectites in the context of alkaline dissolution and/or 695
metallic corrosion. It is also likely that the observed result reflects more the initiation 696
conditions for reactions, which are different than the final equilibrium state of the reacting 697
system. 698
The next step will be to confirm the validity of the present guide by determining the influence 699
of crystal-chemistry on ω parameter for a large set of samples, including non-swelling 700
minerals. 701
702
Acknowledgments. The authors would like to thank Jean-Claude Pétronin (LMTE) who made
703
the CEC measurements and Philippe Lambert (LEM) who took part in the XRD study. Many 704
thanks also to Claudine Pozo and Eric Kohler (LMTE) for their support of the experimental 705
and analytical work. This work was carried out with the support of Catherine Santucci 706
(LMTE) and Jacques Yvon (LEM), who welcomed Murielle Perronnet in their laboratories. 707
We thank Javier Huertas, Barry R. Bickmore and Ian C. Bourg for their high quality 708
reviewing process. The authors do appreciate the suggestions of the reviewers, which served 709
to improve the manuscript, as well as the hypotheses they offered and which were revealed to 710
be pertinent to strengthen the reaction mechanisms. A great thanks also goes to the Associate 711
Editor, Pr Sposito. 712
713
7. REFERENCES 714
715
Aagaard P., Jahren J. S., Harstad A. O., Nilsen O., Ramm, M. (2000) Formation of grain 716
coating chlorite in sandstones. Laboratory synthesized vs. natural occurrences. Clay 717
Miner. 35, 261-269.
718
Bailey S. W. (1988) Odinite, a new dioctahedral-trioctahedral Fe3+-rich 1:1 clay mineral. 719
Clay Miner. 23, 237-247.
720
Bardot F. (1998) Les minéraux argileux et leur hétérogénéité superficielle: Influence de la 721
nature des cations compensateurs de l’illite sur les mécanismes d’adsorption de gaz. Ph. 722
D. thesis, Institut National Polytechnique de Lorraine, Nancy, discipline Géosciences. 723
Bardot F., Villiéras F., Michot L. J., François M., Gerard G., Cases J. M. (1998) High 724
resolution gas adsorption study on illites permuted with various cations: Assessment of 725
surface energetic properties. J. Dispersion Sci. Technol. 19, 739-760. 726
Barrett E. P., Joyner L. G., Halenda P. H. (1951) The Determination of Pore Volume and 727
Area Distributions in Porous Substances. I: Computations from Nitrogen Isotherms. J. 728
Am. Chem. Soc., 73, 373-380.
729
Bhattacharrya D. P. (1983) Origin of berthierine in ironstones. Clays Clay Miner. 31, 3, 173-730
182. 731
Bhattacharrya D. P. (1986) Geochemistry of the phanerozoic oolitic ironstones-genetic 732
implication. Am. Assoc. Petr. Geo. B. 70, 5, 565. 733
Bersillon J. L., Villiéras F., Bardot F., Gorner T., Cases J. M. (2001) Use of the gaussian 734
distribution function as a tool to estimate continuous heterogeneity in adsorbing 735
systems. J. Colloids Interface Sci, 240, 400-411. 736
Bickmore B. R. (1999) Atomic Force Microscopy study of clays mineral dissolution. Ph. D. 737
thesis, Virginia Polytechnic Institute, speciality Phylosophy in Geological Sciences, 738
117 pp. 739
Bickmore B. R., Bosbach D., Hochella M. F. Jr., Charlet L., Rufe E. (2001) In situ atomic 740
microscopy study of hectorite and nontronite dissolution: Implications for phyllosilicate 741
edge surface structures and dissolution mechanisms. Am. Mineral. 86, 411-413. 742
Bickmore B. R., Nagy K. L., Sandlin P. E., Crater T. S. (2002) Quantifying surface area of 743
clays by atomic force microscopy. Am. Mineral. 87, 780-783. 744
Blum A. E. (1994) Determination of illite/smectite particle morphology using scanning force 745
microscopy. In Scanning probe microscopy of clay minerals (eds. Nagy K. L., Blum A. 746
E.). Clay Minerals Society. pp. 172-203. 747
Bocquet, S., Pollard, R. J., Cashion, J. D. (1992). Dynamic magnetic phenomena in fine 748
particle goethite. Phys. Rev. B: Condens. Matter, 46, 11657–11664. 749
Brady P. V., Cygan R. T., Nagy K. L. (1996) Molecular controls on kaolinite surface charge. 750
J. Colloid Interface Sci. 183, 356-364.
751
Brandt F., Bosbach D., Krawczyk-Barsch E., Arnold T., Bernhard G. (2003) Chlorite 752
dissolution in the acid pH-range: A combined microscopic and macroscopic approach. 753
Geochim. Cosmochim. Acta 67, 1451-1461.
754
Brearley A. J. (1997) Phyllosilicates in the matrix of the unique carbonaceous chondrite 755
Lewis Cliff 85332 and possible implications for the aqueous alteration of CI chondrites. 756
Meteorit. Planet. Sci. 32, 377-388.
757
Brunauer S., Emmet P. H., and Teller E. (1938) Adsorption of gases in multimolecular layers. 758
J. Am. Chem. Soc. 60, 309–319.
759
Buatier M., Honnorez J., Ehret G. (1989) Fe-Smectite-Glauconite transition in hydrothermal 760
green clays from the Galapagos spreading center. Clays Clay Miner. 37, 6, 532-541. 761
Bustillo, M. A., Fort, R, Bustillo, M. (1993) Specific surface area and ultramicroporosity in 762
polymorphs of silica. Eur. J. Mineral. 5, 1195-1204. 763
Cama J., Metz V., Ganor J. (2002) the effect of pH and temperature on kaolinite dissolution 764
rate under acidic conditions. Geochim. Cosmochim. Acta 66, 3913-3926. 765
Cases J. M., Cunin P., Grillet Y., Poinsignon C., Yvon J. (1986) Methods of analyzing 766
morphology of kaolinites: Relations between crystallographic and morphological 767
properties. Clay Miner. 21, 55-68. 768
Cases J. M., Villiéras F., Michot L. J. (2000) Les phénomènes d'adsorption, d'échange ou de 769
rétention à l'interface solide-solution aqueuse: 1. Connaissance des propriétés 770
structurales, texturales et superficielles des solides. Compte Rendu de l’Académie des 771
Sciences, Série II, 331, 763-773.
772
Charlet L., Schindler P. W., Spadini L., Furrer G., Zysset M. (1993) Cation adsorption on 773
oxides and clays – the aluminium case. Aquat. Sci. 55, 291-303. 774
Christidis G. E. (1998) Physical and chemical properties of some bentonite deposits of 775
Kimolos Island, Greece. Appl. Clay Sci. 13, 79-98. 776
De Boer J. H., Lippens B. C., Linsen B. G., Brokhoff J. C. P., Van der Heuvel A., Osinga T. 777
J. (1966) The t-curve of multimolecular N2 adsorption. J. Colloid Interf. Sci. 23, 577– 778
599. 779
Eypert-Blaison C., Villiéras F., Michot L. J., Pelletier M., Humbert B., Ghanbaja J., Yvon J. 780
(2002) Surface heterogeneity of kanemite, magadiite and kenyaite: a high resolution 781
gas adsorption study, Clay Minerals 37, 531-542. 782
Eslinger E., Pevear D. (1988) Clay minerals for petroleum geologists and engineers. Society 783
of Economic Paleontologists and Mineralogists. 784
Favre F., Tessier D., Abdelmoula, M., Génin, J. M., Gates W. P., Boivin P. (2002) Iron 785
reduction and changes in cation exchange capacity in intermittently waterlogged soil. 786
Eur. Journ. Soil Sci. 55, 175-184.
787
Ganor J., Cama J., Metz, V. (2003) Surface protonation data of kaolinite-reevaluation based 788
on dissolution experiments. J. Colloid Interface Sci. 264, 67-75. 789
Gin S., Jollivet P., Mestre J. P., Jullien M., Pozo C. (2001) French SON 68 nuclear glass 790
alteration mechanisms on contact with clay media. Appl. Geochem.16, 861-881. 791
Gregg S. J. and Sing K. S. W. (1982) Adsorption, Surface Area and Porosity (ed. 2nd ed 792
Academic Press, London. 793
Guillaume D. (2002) Etude expérimentale du système fer-smectite en présence de solution à 794
80 °C et 300 °C. Ph. D. thesis, Université Henri Poincaré, Nancy I, spécialité Sciences 795
de l’Univers, 209 p. 796
Guillaume D., Neaman A., Cathelineau M., Mosser-Ruck R., Peiffert C., Abdelmoula M., 797
Dubessy J., Villiéras F., Baronnet A., Michau N. (2003) Experimental synthesis of 798
chlorite from smectite at 300 °C in the presence of metallic Fe. Clay Miner. 38, 281-799
302. 800
Grillet Y., Rouquerol F., Rouquerol J. (1977) Etude de l’adsorption physique des gaz par une 801
procédure continue. I. Application à la détermination des surfaces spécifiques 802
d’adsorbants non poreux et mésoporeux. J. Chem. Phys. 74, 179-182. 803
Habert B. (2000) Réactivité du fer dans les gels et les smectites. Ph. D. thesis, Université 804
Paris 6, spécialité Sciences des matériaux, 227 p. 805
Habert B., Jullien M., Kohler E., Bonnin D. (2006) Redox of iron in smectites. Clay Science 806
(in press). 807
Hillier S. and Velde B. (1992) Chlorite interstratified with a 7 Å mineral: an example from 808
offshore Norway and possible implications for the interpretations of the composition of 809
diagenetic chlorites. Clay Miner. 27, 475-486. 810
Hillier S. (1994) Pore-lining chlorites in siliciclastic reservoir sandstones: electron 811
microprobe SEM and XRD data, and implications for their origin. Clay Miner. 29, 665-812
679. 813
Hochella M. F. Jr. (1995) Mineral surfaces: Their characterization and their chemical, 814
physical and reactive nature. In Mineral surfaces (eds. Vaughan D.J., Pattrick R.A.D.). 815
Chapman and Hall, London. pp. 17-60. 816
Hochella M. F. Jr., Rakovan J., Rosso K., Bickmore B., Rufe E. (1998) New directions in 817
mineral surface geochemical research using scanning probe microscopy. In Mineral-818
water interfacial reactions: Kinetics and mechanisms (eds. Sparks D.L., Grundl T.J.).
819
ACS Symposium Series vol. 715, American Chemical Society, Washington, D.C. pp. 820
37-56. 821
Hornibrook, E. R. C. and Longstaffe, L. J. (1996) Berthierine from the lower cretaceous 822
Clearwater formation, Alberta, Canada. Clays Clay Miner. 44, 1, 1-21. 823
Huertas J. F., Chou L., Wollast R. (1999) Mechanism of kaolinite dissolution at room 824
temperature and pressure. Part II: Kinetic study. Geochim. Cosmochim. Acta 63, 3261-825
3275. 826
Kohler E. (2001) Réactivité des mélanges synthétiques smectite/kaolinite et 827
smectite/aluminium gel en présence d’un excès de fer métal. DRT report, Université 828
d’Evry Val d’Essonne, Evry, 101 p. 829
Lantenois S., Lanson B., Muller F., Bauer A., Jullien M. and Plançon A. (2005) Experimental 830
study of smectite interaction with metal iron at low temperature: 1. Smectite 831