Strategies of reducing input sample volume for extracting
circulating cell-free nuclear DNA and mitochondrial
DNA in plasma
Weijie Chen, Fengfeng Cai, Bei Zhang
and Xiao Yan Zhong *
Laboratory for Gynecological Oncology , Department of
Biomedicine, University Women ’ s Hospital, University of
Basel, Basel , Switzerland
Abstract
Background: Circulating cell-free (ccf) DNA in blood has
been suggested as a potential biomarker in many conditions
regarding early diagnosis and prognosis. However,
misdiag-nosis can result due to the limited DNA resources in Biobank ’ s
plasma samples or insuffi cient DNA targets from a
predomi-nant DNA background in genetic tests. This study explored
several strategies for an effi cient DNA extraction to increase
DNA amount from limited plasma input.
Methods: Ccf plasma DNA was extracted with three different
methods, a phenol-chloroform-isoamylalcohol (PCI) method, a
High Pure PCR Template Preparation Kit method and a method
used for single cell PCR in this group. Subsequently, the total
DNA was measured by Nanodrop and the genome equivalents
(GE) of the GAPDH housekeeping gene and MTATP 8 gene
were measured using a multiplex real-time quantitative PCR
for the quantitative assessment of nDNA and mtDNA.
Results: Instead of 400 – 800
μ L (routine input in the
labora-tory), 50
μ Lof plasma input enabled the extraction of ccf DNA
suffi cient for quantitative analysis. Using the PCI method and
the kit method, both nDNA and mtDNA could be successfully
detected in plasma samples, but nDNA extracted using
proto-col for single cell PCR was not detectable in 25 % of plasma
samples. In comparison to the other two methods, the PCI
method showed lower DNA purity, but higher concentrations
and more GE of nDNA and mtDNA.
Conclusions: The PCI method was more effi cient than the
other two methods in the extraction of ccf DNA in plasma.
Limited plasma is available for ccf DNA analysis.
Keywords: circulating cell-free DNA; mitochondrial DNA;
nuclear DNA.
Introduction
Circulating cell-free (ccf) DNA in blood has been
sug-gested as a potential biomarker for many conditions (1, 2) .
Quantitative and qualitative assessments of ccf DNA in
plasma are gaining increasing importance as tools for
blood-based diagnosis and monitoring varieties of diseases (3 – 5) .
The quantitative changes, such as nuclear DNA (nDNA) and
mitochondrial DNA (mtDNA) and qualitative changes, such
as tumor-specifi c methylated DNA, viral DNA, microsatellite
alterations and oncogene mutations were observed in plasma
and serums of various conditions. Ccf DNA assessments offer
a high diagnostic specifi city in cancer, pathological
pregnan-cies, infl ammatory diseases, trauma and transplant graft
rejec-tion (6 – 11) . This might become a valuable prognostic marker
providing the possibility of examining diseases from genetic
materials in the circulation. Thus, the quantitative and
quali-tative assessments of ccf DNA are important tools for
diag-nosing and tracking the diseases and their progressions.
However, there were many problems faced in extracting ccf
DNA from plasma. Firstly, there are no commercially
avail-able extraction kits intended for ccf DNA and especially the
special genes in plasma; therefore, the extraction kits for whole
blood DNA were often used instead. Furthermore, the
con-centrations of ccf DNA reportedly vary from 6 to 650 ng/mL
approximately in the plasma of healthy men (12, 13) . The
wide range and low concentrations suggest that the currently
performed DNA extraction method is not ideal for analysis of
ccf DNA. Since a standard method for extracting ccf DNA in
the plasma does not exist, further studies and clinical
applica-tions of ccf DNA were limited.
Another problem encountered was the limited DNA
resources and the minute amounts of DNA targets which
hindered the detection of target genes at suffi cient amounts.
Since the levels of ccf DNA in plasma varies depending on
diseases, the more quantitative and qualitative assessments of
ccf DNA investigated the better the analysis of relating ccf DNA
to specifi c diseases. Therefore, more DNA targets and more
plasma were needed for genetic tests. However, valuable plasma
or serum samples from Biobank are normally limited and orders
are in quantities insuffi cient for DNA extraction. Moreover, this
led to inaccuracies when conducting qualitative assessments
of ccf DNA which can easily lead to misdiagnosis, especially
when very low concentrations of DNA targets are observed
in the case of tumor DNA, fetal DNA and oncogene mutations.
The aim of this study was to explore an effi cient method of
extracting ccf DNA for further analysis of ccf DNA. We
com-pared the quantifi cation of total DNA, nDNA and mtDNA
*Corresponding author: Xiao Yan Zhong, Laboratory for Gynecological Oncology, Department of Biomedicine, University Women ’ s Hospital, University of Basel, Hebelstr, 20, 4031 Basel, Switzerland
Phone: + 41 612 659 248, Fax: + 41 612 659 399, E-mail: [email protected]
Received July 7, 2011; accepted October 3, 2011; previously published online October 31, 2011
extracted in plasma by three different methods: the column
kit method, the phenol-chloroform-isoamylalcohol (PCI)
method and the method used for single cell PCR successfully
to amplify genes from single cell. The three methods were
used to select an optimal ccf DNA extraction for reducing
input sample volume while increasing the extracted DNA
concentration necessary for ccf DNA analysis. The
concen-tration of ccf DNA was measured by Nanodrop and the GE
of the GAPDH housekeeping gene and MTATP 8 gene were
measured using a multiplex real-time quantitative PCR for
the quantifi cation of nDNA and mtDNA, which was
success-fully developed in our laboratory (14) .
Materials and methods
Sample collectionThe plasma samples used in this study were obtained from the Biobank of Basel University Hospital. Blood samples were collect-ed into tubes containing EDTA-K 3 as anticoagulant and processed within 2 h after vein-puncture. Subsequently, they were processed immediately by centrifugation at 1600 × g for 10 min. The plasma layer was transferred to a new Eppendorf tube and centrifuged again at maximum speed (16,000 × g ) for 10 min. Plasma samples were divided into aliquots of 400 μ L each and stored at – 80 ° C. The study was approved by the Local Ethic Committees.
DNA extraction
The extractions of ccf DNA in 20 plasma samples were conducted using three protocols: the PCI method, High Pure PCR Template Preparation Kit (Roche) method and the method used for single cell PCR. The PCI method is an organic solvent extraction-based DNA preparation (15) ; 50 μ L plasma was diluted into 550 μ L water and an equal volume of PCI (25:24:1) was added. The mixture was centri-fuged at top speed for 1 – 2 min to separate the phases. Subsequently, the aqueous phase was moved to a new tube with two volumes of ice-cold 100 % ethanol to precipitate the DNA. After 1 min full speed centrifugation, the supernatant was removed and DNA dissolved in 12.5 μ L tris-EDTA buffer. The ccf DNA of the second aliquot was extracted using a High Pure PCR Template Preparation Kit, which was a silica-based column DNA preparation and performed accord-ing to the kit instrument. The extracted DNA from 200 μ L plasma was dissolved in 50 μ L tris-EDTA buffer. For the third aliquot, the protocol for single cell PCR was used (16) . Ccf DNA was extracted, amplifi ed and quantifi ed in the same tube; 5 μ L plasma was added to a PCR tube containing 7.5 μ L of 400 ng/ μ L Proteinase K and 17 μ mol/L sodium dodecyl sulfate. The solution was incubated at 50 ° C for 1 h, followed by 99 ° C for 30 min to extract DNA, degrade protein and use for quantitative analysis.
Total DNA quantitative determinations
The concentrations of different DNA dilutions were detected by a Nanodrop 1000 spectrophotometer (Thermo Scientifi c) fi rstly. Because the composition and quality of ccf DNA were unidenti-fi ed, the multiplex real-time PCR was conducted subsequently. The ccf DNA extracted by protocol for single cell PCR was mixed by proteins and amplifi ed by real-time PCR directly; therefore, its con-centration was not measured.
Amplifi cation and quantifi cation of nDNA and mtDNA in plasma samples
Real-time PCR assays are widely used for quantitative assessment of DNA in plasma or serum because it is shown to be simple and robust with a detection limit of about 1 ng/mL and high inter-assay reliabil-ity (17) , but the spectrophotometric measurements were not suitable for such minute quantities of DNA in plasma (5) . Therefore, the GE of nDNA and mtDNA were assessed with the multiplex real-time PCR. This process could perform two assays in a single tube at the same time and be an effi cient and accurate method for quantifying the ccf nDNA and mtDNA (14) .
A total of 5 μ L of DNA dilution was used as a template for the TaqMan real-time PCR analysis by an ABI PRISM 7000 Sequence Detection System (Applied Biosystems, ABI). The amount of nDNA was quantifi ed using the following primer pairs and VIC-labeled TaqMan MGB-probe for the GAPDH housekeeping gene. The prim-ers were 5-CCC CAC ACA CAT GCA CTT ACC-3 (forward primer) and 5-CCT AGT CCC AGG GCT TTG ATT-3 (reverse primer) and the probe was 5-(MGB) TAG GAA GGA CAG GCA AC (VIC)-3. For determining mtDNA, a sequence of the MTATP 8 gene starting at locus 8446 was amplifi ed and quantifi ed. The primers were 5-AAT ATT AAA CAC AAA CTA CCA CCT ACC-3 (forward primer) and 5-TGG TTC TCA GGG TTT GTT ATA-3 (reverse primer) and the probe was 5-(FAM) CCT CAC CAA AGC CCA TA (MGB)-3. The multiplex real-time PCR was performed in a total reaction volume of 25 μ L, containing 5 μ L of DNA, 12.5 μ L of TaqMan Universal PCR Master Mix, four primers and two probes. Our standard TaqMan PCR conditions have been described in our previous publication (14) , which involved a 2 min incubation at 50 ° C, followed by an initial denaturation step at 95 ° C for 10 min and 40 cycles of 1 min at 60 ° C and 15 s at 95 ° C.
A standard curve of a diluted DNA, one negative control and one calibrator DNA, were included in each run. The concentrations of ccf nDNA were estimated according to the standard curves and drawn using the known concentration of human genomic DNA. The con-centrations of ccf nDNA were expressed as GE per mL of plasma (18) . Relative quantities of ccf mtDNA could be estimated using fold change of GE nDNA and also expressed as GE per mL of plasma.
Statistical analysis
In all cases, experiments were replicated in triplicate and data was presented as median, range and fold change and analyzed with the SPSS software. The Wilcoxon, Mann-Whitney and Kruskal-Wallis tests were used to compare the amounts of ccf DNA in different groups categorized by PCI method, kit method and protocol for single cell PCR. A p-value below 0.05 was considered statistically signifi cant.
Results
Total DNA quantitative determinations
The purity and concentration of DNA dilution extracted by
two different protocols were different. The ratio of 260/280
of DNA dilution extracted by kit was higher than that by PCI
method (1.65
± 0.15 vs. 1.06 ± 0.21). However, the
concentra-tion was less than that by PCI method (23.91
± 8.82 ng/mL
vs. 407.32
± 239.36 ng/mL). Because the DNA extracted by
protocol for single cell PCR was amplifi ed directly, the
con-centration and purity of DNA were not investigated.
Amplifi cation and quantifi cation of nDNA and mtDNA in plasma samples
Ccf DNA extracted by three different methods was amplifi ed,
quantifi ed and subsequently compared for the differences in the
quantifi cation of nDNA and mtDNA. Using the PCI method
and kit method for DNA extraction, both nDNA and mtDNA
were successfully detected in plasma samples; mtDNA was also
successfully detectable with the protocol for single cell PCR,
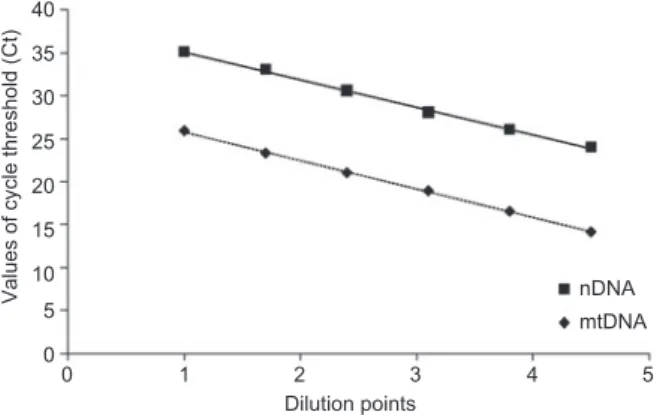
while nDNA was not in 25 % of plasma samples. The standard
curves using a known concentration of human genomic DNA
containing six concentration points for both mtDNA and nDNA
are shown in Figure 1 . The average slope of standard curve
of mtDNA or nDNA was approximately – 3.3 (nearly 100 %
effi ciency) in multiplex real-time PCR.
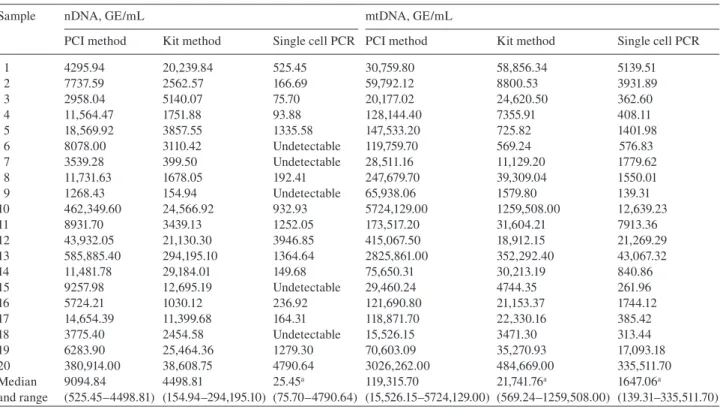
The ccf DNA equivalents in the paired plasma samples were
determined by multiplex real-time PCR, calculated according
to the standard dilution curves, expressed as GE/mL, and shown
in Table 1
. The GE of nDNA and mtDNA extracted by PCI
were greater than that by kit, respectively, (9094.84 GE/mL vs.
4498.81 GE/mL, 119315.70 GE/mL vs. 21741.76 GE/mL), in
the plasma, although a lower volume of plasma was used (50
μ L
vs. 200
μ L). The GE of mt DNA extracted by PCI method was
approximately 5.5-fold and the GE of nDNA was approximately
2-fold of the kit method. By the protocol of single cell PCR, the
mtDNA could be detectable in all samples (1647.06 GE/mL),
with the nNDA in 75 % of the samples (525.45 GE/mL). The
examples of amplifi cation curves of mtDNA extracted by three
methods were shown in Supplementary Figure 1 . The cycle
threshold (Ct) value of mtDNA extracted by the PCI method
was less than that by the kit method.
Discussion
In this study, we aimed to explore an effi cient method to
extract the ccf DNA in limited plasma samples. Three methods
for extracting DNA were involved. Although the PCI method
40 35 30 25 20
Values of cycle threshold (Ct)
15 10 5 0 0 1 2 3 4 5 nDNA mtDNA Dilution points
Figure 1 Multiplex real-time PCR kinetics for amplifying mtDNA and nDNA on serial dilutions.
The fi gure shows reproducible standard dilution curves for identifi -cation of the mtDNA and nDNA. The standard curves with average slopes was approximately – 3.3 (nearly 100 % effi ciency) in multiplex real-time PCR.
provided less purity, the concentration of ccf DNA measured
by Nanodrop was more than that by the kit method. The
260/280 ratio of ccf DNA extracted by the PCI method was
less than that by the kit method. This indicated that there might
be contamination of residual ethanol, protein and others in the
dilution extracted by PCI method. It might be easier to get
contamination with the PCI method while removing the
aque-ous phase containing the DNA to a new tube. However, the kit
could bind nucleic acids with column and remove
contamina-ting components in a series of rapid “ wash and spin ” steps.
Therefore, it had a better purity but might lose some unbound
DNA. Considering the contamination in the DNA dilutions,
the result that the concentration of ccf DNA extracted by PCI
method was more than that by kit method might not prove
convincing. Thus, the genome equivalents, the quantifi cation
of nDNA and mtDNA were conducted subsequently.
The results of quantifying nDNA and mtDNA showed that
the GE of ccf mtDNA extracted by PCI method were greater
in number and that the mtDNA: nDNA ratio determined of the
PCI method group was also higher than that of the kit group,
although there was not any statistical differences between
the two methods when comparing their GE of nDNA. These
results indicated that the column isolation by kit might reduce
total ccf DNA in ways that wasted more mtDNA than nDNA.
This could cause the under-estimation of the GE of mtDNA.
Most column DNA extraction kits rely on high concentrations
of chaotropic salts and low pH to extract DNA because the
negatively-charged DNA phosphate backbones could bind to
positively-charged silica gel beads. However, the salt
concen-trations, pH, fat and wash buffer ethanol contents could infl
u-ence DNA binding in a size-dependent manner (15, 19) . The
column kits were optimized for the isolation of DNA fragments
by more than 50 Kb (20) . Moreover, the RNAase contained in
the column kits could minimize the quantity of mtDNA (15) .
Thus, the column kits seemed unsuitable for mtDNA quantifi
-cation but did not affect nDNA quantifi -cation. This also might
be the reason for the wide range of quantitative assessments
discussed in the previous papers, i.e., the mean ccf DNA
con-centrations of 6 – 20 ng/mL or 650 ng/mL were measured in
the plasma of healthy men by different methods (2) .
The PCI method could provide a high ccf DNA capture
effi ciency, though more time-consuming and subject to
vari-able technical prowess. It was less dependent on DNA size
and enabled more accurate assessment of small size DNA,
like mtDNA. Since ccf DNA consists of fractions of
differ-ent sizes (21) , using isolation methods that capture all of the
DNA fractions is of the utmost importance for the reliability
of all downstream experiments and their comparability (22) .
Therefore, the PCI method seems to be preferable in
captur-ing and isolatcaptur-ing of mtDNA. Although that insuffi cient phenol
could cause oxidation and contaminants of residual ethanol,
proteins and divalent cations might inhibit PCR, the amplifi
-cation effi ciency of nDNA and mtDNA were nearly 100 % and
the GE of ccf DNA extracted by PCI was still higher in the
study. Moreover, the DNA extracted by the PCI method could
be concentrated by decreasing the volume of dissolved buffer
while the test kit method does not allow all of the DNA
Table 1 Circulating cell-free mtDNA and nDNA extracted by three different methods.
Sample nDNA, GE/mL mtDNA, GE/mL
PCI method Kit method Single cell PCR PCI method Kit method Single cell PCR 1 4295.94 20,239.84 525.45 30,759.80 58,856.34 5139.51 2 7737.59 2562.57 166.69 59,792.12 8800.53 3931.89 3 2958.04 5140.07 75.70 20,177.02 24,620.50 362.60 4 11,564.47 1751.88 93.88 128,144.40 7355.91 408.11 5 18,569.92 3857.55 1335.58 147,533.20 725.82 1401.98 6 8078.00 3110.42 Undetectable 119,759.70 569.24 576.83 7 3539.28 399.50 Undetectable 28,511.16 11,129.20 1779.62 8 11,731.63 1678.05 192.41 247,679.70 39,309.04 1550.01 9 1268.43 154.94 Undetectable 65,938.06 1579.80 139.31 10 462,349.60 24,566.92 932.93 5724,129.00 1259,508.00 12,639.23 11 8931.70 3439.13 1252.05 173,517.20 31,604.21 7913.36 12 43,932.05 21,130.30 3946.85 415,067.50 18,912.15 21,269.29 13 585,885.40 294,195.10 1364.64 2825,861.00 352,292.40 43,067.32 14 11,481.78 29,184.01 149.68 75,650.31 30,213.19 840.86 15 9257.98 12,695.19 Undetectable 29,460.24 4744.35 261.96 16 5724.21 1030.12 236.92 121,690.80 21,153.37 1744.12 17 14,654.39 11,399.68 164.31 118,871.70 22,330.16 385.42 18 3775.40 2454.58 Undetectable 15,526.15 3471.30 313.44 19 6283.90 25,464.36 1279.30 70,603.09 35,270.93 17,093.18 20 380,914.00 38,608.75 4790.64 3026,262.00 484,669.00 335,511.70 Median and range 9094.84 (525.45 – 4498.81) 4498.81 (154.94 – 294,195.10) 25.45 a (75.70 – 4790.64) 119,315.70 (15,526.15 – 5724,129.00) 21,741.76 a (569.24 – 1259,508.00) 1647.06 a (139.31 – 335,511.70)
a Statistical signifi cances between the method and PCI method (p < 0.05); mtDNA, mitochondrial DNA; nDNA, nuclear DNA; PCI method,
phenol-chloroform-isoamylalcohol method; kit method, High Pure PCR Template Preparation Kit (Roche) method.
binding to columns to be washed down with fewer
volumes of dissolved buffers.
The single cell PCR was a very sensitive method, but
little contamination could verify the results (16) . By using
only 5
μ L volume of plasma, the mtDNA was detectable, but
the concentration of mtDNA was less than that of the PCI
method. This indicated that the DNA in the action tube might
be combined or broken down by the contaminants, because all
the salts and proteins in the plasma were put in the detection
system. Moreover, because the nDNA was less than mtDNA,
it can be detectable only in 75 % of samples. Also, the input
volume of plasma was limited by the size of tube, therefore,
the improvement of detection sensitivity of nDNA by
increas-ing input of plasma might not be feasible.
Increased clinical importance of ccf DNA was found not
only for the diagnosis, prediction and prognosis of varied
dis-eases but also for monitoring patients in disease surveillance
and during treatment. As result, effi cient isolation procedures
of ccf DNA and sensitive determination procedures were
demanded. The PCI method demonstrated higher effi ciency in
extracting of ccf DNA and can be an important procedure for
detecting the quantitative and qualitative change of ccf DNA
in limited DNA resource and targets. The PCI method needed
only 50
μ L plasma and could gain more concentration and
genome equivalents of DNA dilution by column kit method
which used 200
μ L plasma. Although the protocol for single
cell PCR uses even less plasma, it was not as sensitive as
the PCI method due to the inhibition of protein or salt. Thus,
the PCI method might be considered a suitable approach for
extracting ccf DNA in plasma.
Acknowledgments
This work was supported by China Scholarship Council. We are grateful to Matt Ji for proofreading the manuscript. We thank Vivian Kiefer, Corina Kohler, Zeinab Barekati and Hongbo Chen for their kind assistance.
Confl ict of interest statement
Authors ’ confl ict of interest disclosure: The authors stated that there are no confl icts of interest regarding the publication of this article. Research support played no role in the study design; in the collection, analysis and interpretation of data; in the writing of the report; or in the decision to submit the report for publication. Research funding: None declared.
Employment or leadership: None declared. Honorarium: None declared.
References
1. Sozzi G, Conte D, Leon M, Ciricione R, Roz L, Ratcliffe C, et al. Quantifi cation of free circulating DNA as a diagnostic marker in lung cancer. J Clin Oncol 2003;21:3902 – 8.
2. Jung K, Fleischhacker M, Rabien A. Cell-free DNA in the blood as a solid tumor biomarker – a critical appraisal of the literature. Clin Chim Acta 2010;411:1611 – 24.
3. Catarino R, Ferreira MM, Rodrigues H, Coelho A, Nogal A, Sousa A, et al. Quantifi cation of free circulating tumor DNA as a diag-nostic marker for breast cancer. DNA Cell Biol 2008;27:415 – 21. 4. Ye L, Ma GH, Chen L, Li M, Liu JL, Yang K, et al.
Quantifi cation of circulating cell-free DNA in the serum of patients with obstructive sleep apnea-hypopnea syndrome. Lung 2010;188:469 – 74.
5. Swarup V, Rajeswari MR. Circulating (cell-free) nucleic acids – a promising, non-invasive tool for early detection of several human diseases. FEBS Lett 2007;581:795 – 9.
6. Lo YM, Tein MS, Lau TK, Haines CJ, Leung TN, Poon PM, et al. Quantitative analysis of fetal DNA in maternal plasma and serum: implications for noninvasive prenatal diagnosis. Am J Hum Genet 1998;62:768 – 75.
7. Konorova IL, Veiko NN, Ershova ES, Antelava AL, Chechetkin AO. Haemodynamic role of blood-plasma circulating cell-free DNA and contained therein high-molecular-weight CpG-rich fraction in pathogenesis of arterial hypertension and athero-sclerosis obliterans of carotid arteries. Angiol Sosud Khir 2009; 15:19 – 28.
8. Allen D, Butt A, Cahill D, Wheeler M, Popert R, Swaminathan R. Role of cell-free plasma DNA as a diagnostic marker for pros-tate cancer. Ann NY Acad Sci 2004;1022:76 – 80.
9. Lam NY, Rainer TH, Chiu RW, Joynt GM, Lo YM. Plasma mitochondrial DNA concentrations after trauma. Clin Chem 2004;50:213 – 6.
10. Zhong XY, von Muhlenen I, Li Y, Kang A, Gupta AK, Tyndall A, et al. Increased concentrations of antibody-bound circulatory cell-free DNA in rheumatoid arthritis. Clin Chem 2007;53:1609 – 14. 11. Lo YM, Tein MS, Pang CC, Yeung CK, Tong KL, Hjelm NM.
Presence of donor-specifi c DNA in plasma of kidney and liver-transplant recipients. Lancet 1998;351:1329 – 30.
12. Altimari A, Grigioni AD, Benedettini E, Gabusi E, Schiavina R, Martinelli A, et al. Diagnostic role of circulating free plasma DNA detection in patients with localized prostate cancer. Am J Clin Pathol 2008;129:756 – 62.
13. Chun FK, Muller I, Lange I, Friedrich MG, Erbersdobler A, Karakiewicz PI, et al. Circulating tumour-associated plasma DNA represents an independent and informative predictor of prostate cancer. Br J Urol Int 2006;98:544 – 8.
14. Xia P, Radpour R, Zachariah R, Fan AX, Kohler C, Hahn S, et al. Simultaneous quantitative assessment of circulating cell-free mitochondrial and nuclear DNA by multiplex real-time PCR. Genet Mol Biol [online] 2009;32:20 – 4.
15. Guo W, Jiang L, Bhasin S, Khan SM, Swerdlow RH. DNA extrac-tion procedures meaningfully infl uence qPCR-based mtDNA copy number determination. Mitochondrion 2009;9:261 – 5. 16. Troeger C, Zhong XY, Burgemeister R, Minderer S, Tercanli S,
Holzgreve W, et al. Approximately half of the erythroblasts in maternal blood are of fetal origin. Mol Hum Reprod 1999;5: 1162 – 5.
17. Szpechcinski A, Struniawska R, Zaleska J, Chabowski M, Orlowski T, Roszkowski K, et al. Evaluation of fl uorescence-based methods for total vs. amplifi able DNA quantifi ca-tion in plasma of lung cancer patients. J Physiol Pharmacol 2008;59(Suppl 6):675 – 81.
18. Zhong XY, Hahn S, Kiefer V, Holzgreve W. Is the quantity of circulatory cell-free DNA in human plasma and serum samples associated with gender, age and frequency of blood donations ? Ann Hematol 2007;86:139 – 43.
19. Aplenc R, Orudjev E, Swoyer J, Manke B, Rebbeck T. Differential bone marrow aspirate DNA yields from commercial extraction kits. Leukemia 2002;16:1865 – 6.
20. Carter MJ, Milton ID. An inexpensive and simple method for DNA purifi cations on silica particles. Nucleic Acids Res 1993;21:1044.
21. Liu KJ, Brock MV, Shih Ie M, Wang TH. Decoding circulating nucleic acids in human serum using microfl uidic single molecule spectroscopy. J Am Chem Soc 2010;132:5793 – 8.
22. Wang M, Block TM, Steel L, Brenner DE, Su YH. Preferential isolation of fragmented DNA enhances the detection of circulat-ing mutated k-ras DNA. Clin Chem 2004;50:211 – 3.