Quantitative Three-Dimensional Wall Motion Analysis Predicts Ischemic
Region Size and Location
S
USANL. H
ERZ,
1T
AKUYAH
ASEGAWA,
2A
MGADN. M
AKARYUS,
3K
ATHERINEM. P
ARKER,
4S
HUNICHIH
OMMA,
2J
IEW
ANG,
2and J
EFFREYW. H
OLMES51
Department of Biomedical Engineering, Columbia University, New York, NY, USA;2Department of Medicine, Columbia University, New York, NY, USA;3Department of Medicine, North Shore University Hospital, Manhasset, NY, USA; 4
Department of Biomedical Engineering, University of Virginia, Charlottesville, VA, USA; and5Departments of Biomedical Engineering and Medicine and Robert M. Berne Cardiovascular Research Center, University of Virginia, Charlottesville,
VA, USA
(Received 26 October 2009; accepted 16 December 2009; published online 13 January 2010)
Associate Editor Eric M. Darling oversaw the review of this article.
Abstract—Stress echocardiography is an important screening test for coronary artery disease. Currently, cardiologists rely on visual analysis of left ventricular (LV) wall motion abnormalities, which is subjective and qualitative. We previously used finite-element models of the regionally ischemic left ventricle to develop a wall motion measure, 3DFS, for predicting ischemic region size and location from real-time 3D echocardiography (RT3DE). The purpose of this study was to validate these methods against regional blood flow measurements during regional ischemia and to compare the accuracy of our methods to the current state of the art, visual scoring by trained cardiologists. We acquired RT3DE images during 20 brief (<2 min) coronary occlu-sions in dogs and determined ischemic region size and location by microsphere-based measurement of regional perfusion. We identified regions of abnormal wall motion using 3DFS and by blinded visual scoring. 3DFS predicted ischemic region size well (correlation r2
= 0.64 against microspheres, p < 0.0001), reducing error by more than half compared to visual scoring (8 ± 9% vs. 19 ± 14%, p < 0.05), while localizing the ischemic region with equal accuracy. We conclude that 3DFS is an objective, quantita-tive measure of wall motion that localizes acutely ischemic regions as accurately as wall motion scoring while providing superior quantification of ischemic region size.
Keywords—Cardiac mechanics, Coronary artery disease, Echocardiography, Ischemia, Regional blood flow.
INTRODUCTION
Analysis of left ventricular regional wall motion during stress echocardiography has proved to be a useful predictor of coronary artery disease2,22,26,27and clinical prognosis.3,9,17,19,33 Visual analysis provides little quantitative information, is dependent on the level of experience of the observer,23,29and is subject to high inter-observer variability.8 Quantitative analysis of cardiac images provides a more objective and accurate approach to diagnosis16; unfortunately, quantitative analysis of left ventricular wall motion has been limited by technical issues, particularly the well-known problem of centroid definition.21,31
Real-time three-dimensional echocardiography (RT3DE) is well suited for quantification of LV vol-ume, mass, and function,5–7,10,14,15,20,25,28,32 and for identifying regional wall motion abnormalities during exercise or pharmacological stress that indicate the presence of coronary artery disease.1,18,24,30,34RT3DE can be obtained quickly during the critical time period after exercise before the heart rate drops, yet provides complete LV visualization. The wealth of information contained in such fully four-dimensional (3D plus time) cardiac images will not benefit clinical practice, however, until clinically useful quantitative informa-tion can be extracted from the datasets and presented in a simple and straightforward way within a few minutes. We previously utilized finite-element models of the regionally ischemic left ventricle to develop methods for quantifying and displaying LV wall motion and for estimating the size and location of an ischemic region based on changes in wall motion from baseline.11 The purpose of this study was to validate Address correspondence to Jeffrey W. Holmes, Departments
of Biomedical Engineering and Medicine and Robert M. Berne Cardiovascular Research Center, University of Virginia, Health System, Box 800759, Charlottesville, VA 22908, USA. Electronic mail: holmes@virginia.edu
DOI: 10.1007/s10439-009-9880-1
0090-6964/10/0400-1367/0Ó2010 Biomedical Engineering Society 1367
these methods against regional blood flow measure-ments during regional ischemia and to compare the accuracy of our methods to the current state of the art, visual wall motion scoring by trained cardiologists.
METHODS Experimental Protocol
This experiment was performed under a research protocol approved by Columbia University’s Institu-tional Animal Care and Use Committee. Anesthesia was induced with propofol (4–8 mg/kg i.v.) in five dogs with an average body weight of 25 ± 2.5 kg. The dogs were intubated and anesthesia was maintained using inhaled isoflurane (1.5–2.5%). Two micromanometer-tipped pressure catheters (Millar Instruments, Hous-ton, TX) were inserted through the right and left car-otid arteries and positioned to measure aortic and left ventricular pressures. A lateral thoracotomy was per-formed and the pericardium was opened and sutured to the chest wall to expose and support the left ven-tricle. Sutures were placed around the left anterior descending (LAD) and left circumflex (LCx) coronary arteries or their branches at proximal and distal sites.
Baseline apical RT3D echocardiograms were acquired using a Philips iE33 ultrasound system (Phi-lips Medical Systems, Andover, MA). A silicone gel standoff (Aquaflex, Parker Laboratories, Fairfield, NJ) was placed between the ultrasound probe and the apex of the heart. Prior to the first occlusion, baseline hemodynamic data were recorded while baseline microspheres were injected into a left atrial catheter and reference blood samples were taken from a cath-eter positioned in the descending aorta. Distal LCx and LAD occlusions were performed in random order, followed by proximal occlusions. RT3DE images were acquired immediately prior to the occlusion and after 60–90 s of occlusion. Just prior to two minutes of occlusion, the suture was released from the artery and the dog was allowed to recover for at least 10 min. Prior to each subsequent occlusion, intermediate baseline images and hemodynamic data were obtained. At the conclusion of the experiment, dogs were euthanized by overdose injection of pentobarbital sodium (98–118 mg/kg) and phenytoin (12–15 mg/kg).
Assessment of Regional Myocardial Blood Flow At baseline and during each occlusion, colored microspheres (Dye-Trak, Triton Technology Inc., San Diego, CA, 6 million spheres in 2 mL) were injected into the left atrial catheter and blood was sampled from the aortic catheter (7 mL/min for 2 min) to allow
measurement of regional blood flow. After each experiment, the heart was removed and sectioned into 60 blocks (Fig. 1) and regional myocardial blood flow was determined for each block using standard methods for quantification of colored microspheres.13 The ischemic tissue fraction was calculated as the fraction of myocardial segments with 50% or more reduction in blood flow compared to remote nonischemic regions in the basal septum. Regional blood flow was displayed on either a circumferential polar map (Fig. 1c) or a Hammer projection map (Fig.1d), with ischemic regions shaded gray (50–75% reduction) or black (>75% reduction). The Hammer map is created by opening the LV along the mid-septum and displaying it in 2D using an area-preserving projection. This map provides a true representation of the surface area of the LV12; for example, regions at the base of the LV are shown in the correct scale on the Hammer map, while the basal regions occupy more area than equally sized mid-ventricular or apical regions on the circumferen-tial polar map.
Quantitative Wall Motion Analysis
The RT3D echocardiograms were exported to CD and segmented using Tomtec 4D LV-Analysis software version 2.0 (Tomtec Imaging Systems, Unterschleiss-heim, Germany). With three initial contours drawn by the user, this software semi-automatically detects the LV endocardial border. Manual editing of the endo-cardial border was required. The final endoendo-cardial surface data were exported and analyzed using custom software written in Matlab (Mathworks, Natick, MA). The endocardial data were transformed into a cardiac coordinate system using three anatomical landmarks selected at end diastole and end systole: the apex, base and middle of the septum. This cardiac coordinate system translates and rotates with the heart, with axes directed parallel to the base-apex axis (x1), through the
mid-septum (x2), and through the posterior wall (x3)
from an origin located 1/3 of the distance from the base to the apex along the LV long axis.
Surfaces were fit through the data in prolate sphe-roidal coordinates as previously described, providing a compact mathematical representation of the LV (Fig. 2).11Briefly, in this elliptical coordinate system, l represents a longitudinal angular coordinate, h a cir-cumferential angular coordinate, and k = k(l, h) a coordinate along an arc from the central axis, roughly analogous to a radius in spherical coordinates. The focal length of the coordinate system was set to (2/3 of the base-apex distance)/cosh(1) to scale the fitting problem, and data points were projected along lines of constant l and h onto an undeformed ellipsoidal mesh (k = 1) composed of 64 bicubic Hermite elements
FIGURE 1. Blood flow analysis methods demonstrated for proximal LAD occlusion. (a) Baseline and occlusion blood flow levels measured from colored microspheres in 60 blocks of myocardium. (b) Diagram showing location of myocardial tissue blocks. (c) Circumferential polar map displaying 50–75% reduction in blood flow from baseline in gray and >75% reduction in black. (d) A Hammer map of regional blood flow for the same example.
FIGURE 2. Wall motion analysis methods demonstrated for one dog during distal LCx occlusion. (a) Apical 2 chamber view of the 3D echocardiogram at end diastole (ED) and at end systole (ES); there is little motion in the inferior wall from ED to ES. (b) Data points outlining the left ventricular endocardial border at ED and ES as exported from Tomtec. (c) Surfaces fitted through the data to provide a compact representation of the left ventricle. (d) Endocardial surfaces (top) at ED (wireframe) and at ES (solid surface) and three-dimensional fractional shortening (3DFS) displayed on a Hammer projection map (bottom) confirm reduced motion in the inferior wall (white 5 normal, 3DFS > 25%; light gray 5 hypokinesis, 3DFS: 5–25%; dark gray 5 akinesis, 3DFS: 25% to 5%; black 5 dyskinesis, 3DFS < 25%). In this open-chest anesthetized dog, much of the LV is hypokinetic even outside the ischemic region.
(8 circumferential and 8 longitudinal). This projection converted the fitting problem from 3D to 1D, allowing the surface to be fitted to the points by minimizing the least squares error in k.
LV cavity volume was computed as the volume enclosed by the fitted surface. Three-dimensional fractional shortening (3DFS) was computed by com-paring the position of the endocardial surface as reflected in the prolate spheroidal coordinate k at end diastole (ED) and end systole (ES): 3DFS = (kED kES)/kED.11 To account for reduced baseline
function present in open-chest, anesthetized animals, 3DFS measured during each occlusion was subtracted from that measured at the preceding baseline. This measurement, D3DFS, was defined as abnormal if there was a 10% or greater reduction in 3DFS from baseline. D3DFS was displayed using a Hammer pro-jection map, with normal D3DFS shaded white and abnormal D3DFS shaded gray (10–20%) or black (>20%). The abnormal area fraction (AAF) was computed as the fraction of the surface area of the LV with abnormal wall motion.
Visual Wall Motion Analysis
Wall motion scoring was performed on standard 2D views selected from the 3D dataset by two trained car-diologists blinded to the experimental condition, using a 16-segment model.16 We used the scoring system rec-ommended by the American Society of Echocardiog-raphy (ASE)—normal or hyperkinesis 1, hypokinesis 2, akinesis 3, dyskinesis 4—and scored each segment in 2 views per ASE guidelines.16In most cases, the scores from the two views agreed; in the remaining cases we averaged the scores from the two views to obtain a final score for the segment. To account for depressed baseline function in the open-chest dogs, the change in visual scores from baseline was calculated by subtracting the wall motion scores from the preceding baseline image. LV segments with no reduction in wall motion scores were displayed as white and segments with reduced scores from baseline were shaded gray ( 1) or black ( 2) on Hammer projection or circumferential polar maps. The AAF was computed as the fraction of the LV segments with reduced wall motion scores.
Evaluation of Predicted Ischemic Region Size and Location
In order to test the ability of D3DFS and wall motion scoring to predict ischemic region size, we examined the correlation between the AAF determined by D3DFS or segment scoring and the ischemic tissue fraction quantified from colored microspheres, as well as the absolute error in predicting ischemic region size
for each occlusion. To test the accuracy of predictions of ischemic region location, we compared the fraction of the endocardial surface that was correctly classified as ischemic or non-ischemic based on D3DFS or visual scoring. D3DFS, visual scores, and blood flow levels were divided into normal and abnormal (D3DFS < 0.1, change in visual score >0, and 50% or more reduction in blood flow) and were compared at >40,000 points on the LV endocardial surface. Each point was classified as true positive (TP), true negative (TN), false positive (FP) or false negative (FN). The fraction of the LV surface area with an incorrect prediction was calculated for each occlusion as (FP + FN)/total area.
Statistical Analysis
All values are reported as mean ± SD. Linear regressions of AAF computed from D3DFS or wall motion scores against the size of ischemic region as determined by colored microspheres were performed using GraphPad InStat (GraphPad Software, San Diego, CA). Changes in hemodynamic variables were assessed using one-way ANOVA with Dunnett post-tests where appropriate to compare all values to baseline. The absolute error in prediction of ischemic region size and location for D3DFS and each cardiol-ogist were compared using repeated measures ANOVA with Bonferroni-corrected post-tests between D3DFS and each cardiologist.
RESULTS
A total of 20 transient occlusions (<2 min) were performed, four occlusions in each of the five dogs studied. One distal LAD occlusion was excluded from further analysis because the baseline 3D image imme-diately preceding that occlusion was of poor quality; the other nineteen occlusions had satisfactory 3D image quality. Hemodynamic data obtained at baseline and during the occlusions are listed in Table1. As expected, coronary occlusion significantly depressed left ventric-ular function (end-systolic pressure, p < 0.05; ejection fraction, p < 0.01). Hemodynamic data also confirmed a reasonable degree of return to baseline between occlusions (data not shown): ANOVA across the four baseline runs acquired over the course of the study (one before each occlusion) showed no significant trends with time for any of the parameters inTable 1.
Assessment of Regional Myocardial Blood Flow Regional blood flow quantification for a typical proximal LAD occlusion is shown in Fig.1. Blood
flow levels were severely reduced in the anterior wall as shown in the graph of blood flow levels (Fig.1a) and in the blood flow maps (Figs.1c and 1d). Microsphere analysis revealed ischemia (perfusion < 50% of con-trol segments) in 38% of the left ventricular wall for this example. Across all occlusions studied, the range of ischemic region sizes by microsphere analysis was 0–43%, with a mean size of 6 ± 6% for distal LAD occlusions, 27 ± 7% for proximal LAD occlusions, 25 ± 14% for distal LCx occlusions, and 40 ± 3% for proximal LCx occlusions.
Quantitative and Visual Wall Motion Analysis Figure3 illustrates the results of quantitative wall motion analysis and visual scoring for distal left cir-cumflex occlusion in one dog. During this occlusion, blood flow was severely reduced in the posterolateral wall (Fig.3a, gray and black regions) in an area rep-resenting 33% of the left ventricle by mass. Wall motion was reduced in the posterolateral wall, as shown in the map of D3DFS (Fig.3b, gray and black regions); the quantitative analysis revealed >10% reduction in 3DFS on 34% of the LV endocardial surface, providing excellent quantitative agreement with blood flow data. Visual wall motion scoring re-sults from both cardiologists showed reduced scores relative to baseline in the posterolateral wall but also in other segments (Figs.3c–3f); in this case wall motion scoring significantly overestimated ischemic region size, placing it between 50% (8/16 segments) and 56% (9/16) of the left ventricle.
Prediction of Ischemic Region Size and Location Our previously published finite element simulations predicted that the fraction of the endocardial surface displaying abnormal 3DFS should be linearly related
TABLE 1. Hemodynamic parameters at baseline and during transient coronary occlusion of the coronary arteries indicated.
Variable Baseline Distal LAD Proximal LAD Distal LCx Proximal LCx
LV EDP (mmHg) 9.9 ± 4.3 11.4 ± 3.2 13.9 ± 2.0 13.6 ± 2.9 13.6 ± 2.1 LV ESP (mmHg) 77.6 ± 6.6 71.0 ± 6.0 57.8 ± 8.9* 63.7 ± 9.7* 57.9 ± 4.2* HR (bpm) 95 ± 5 90 ± 4 91 ± 7 95 ± 9 93 ± 10 EDV (mL) 46.3 ± 6.2 47.1 ± 4.2 52.2 ± 8.8 52.5 ± 2.4 51.1 ± 9.2 ESV (mL) 24.6 ± 3.4 27.9 ± 2.9 35.5 ± 7.0* 32.9 ± 2.4 34.2 ± 7.2* EF (%) 47 ± 3 41 ± 2 32 ± 4* 37 ± 4* 33 ± 5* CO (L/min) 2.1 ± 0.3 1.7 ± 0.2 1.5 ± 0.3 1.9 ± 0.3 1.6 ± 0.4
Values are mean ± SD (n = 4 for baseline and distal LAD, 5 for other occlusions). LV = left ventricle; EDP = end-diastolic pressure; ESP = end-systolic pressure; HR = heart rate; EDV = end-diastolic volume; ESV = end-systolic volume; EF = ejection fraction; CO = cardiac output.
* Indicates significantly different from baseline by ANOVA and Dunnett post-test.
FIGURE 3. Analysis of data from one dog with distal left circumflex occlusion. (a) Map of regional blood flow distri-bution; regions with normal blood flow are shown in white and regions with more than 50% reduction in blood flow from baseline are shaded gray and black. (b) Map of changes in 3DFS from baseline; regions with more than 10% reduction in 3DFS from baseline are shaded gray and black. (c–f) Changes in wall motion scores from baseline by two trained cardiolo-gists are displayed on Hammer projection maps (c, d) and polar circumferential maps (e, f); white indicates no change from baseline, gray and black regions with reduced wall motion scores from baseline. S 5 septum; A 5 anterior; L 5 lateral; P 5 posterior.
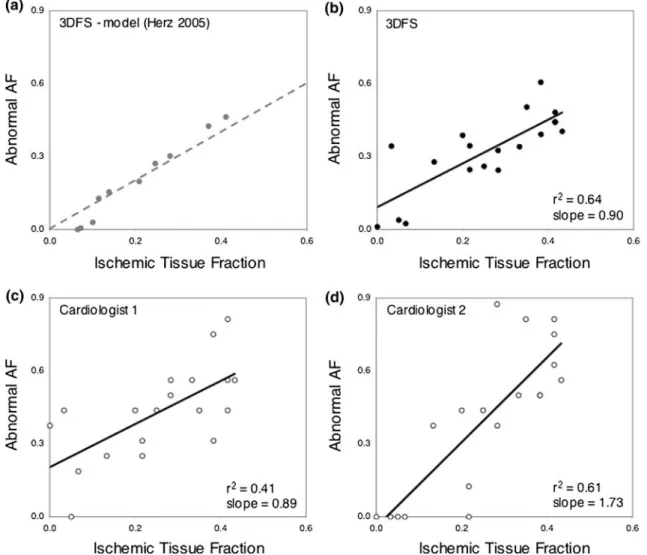
to the fraction of myocardium that is ischemic, above a threshold ischemic region size of about 7% of the left ventricle11; data from those simulations are re-plotted inFig.4a for comparison with the experimental results reported here. The fraction of the endocardium with more than 10% reduction in 3DFS from baseline (D3DFS < 0.10) correlated well with ischemic tissue fraction as measured by colored microspheres (Fig.4b), and the regression line had a slope near 1 (r2= 0.64, slope = 0.90, p < 0.0001). Consistent with model predictions, three of the four smallest occlusions produced little wall motion abnormality. The fraction of endocardial segments with reduced wall motion scores from visual analysis also correlated with the ischemic tissue fraction (Figs. 4c and 4d; r2= 0.41,
slope = 0.89, p = 0.002, and r2= 0.61, slope = 1.73, p < 0.0001). However, the slope and intercept of the regression lines for the two cardiologists were very different.
While quantitative analysis and visual scoring both produced ischemic region size estimates that correlated with ischemic tissue fraction, the size estimates derived from quantitative analysis were much more accurate (Fig. 5, dark gray bars), reducing error by more than half (3DFS error 0.079 ± 0.087, cardiologist 1 0.188 ± 0.127, cardiologist 2 0.197 ± 0.155, p < 0.05 for 3DFS vs. both cardiologists). D3DFS and visual scoring showed similar accuracy in predicting ischemic region location (Fig.5, light gray bars, p < 0.05 for 3DFS vs. cardiologist 1 only).
FIGURE 4. Ischemic region size prediction. (a) Relationship between size of wall motion abnormality identified by 3DFS (abnormal area fraction, AF) and simulated ischemic region size in model analysis reported previously in Herz et al.11; dotted line
shows line of identity (‘perfect’ prediction). (b) Analysis of 19 brief experimental coronary occlusions in open-chest anesthetized dogs confirmed a close relationship between size of wall motion abnormality identified by 3DFS and true ischemic region size by microsphere-based blood flow measurement. (c, d) The predictions of ischemic region size based on the fraction of the endo-cardial surface with reduced wall motion scores assigned by two cardiologists also correlated significantly with ischemic region size assessed by microspheres.
DISCUSSION
Clinical management of cardiac patients relies heavily on quantitative measures such as blood pres-sure, cholesterol levels, and ejection fraction; such measures are essential for risk stratification and in developing treatment guidelines. While ejection fraction is a valuable quantitative measure of global left ven-tricular (LV) function, standard echocardiographic assessment of regional LV function (wall motion anal-ysis) remains qualitative, primarily because quantitative analysis of LV wall motion has been limited by technical issues such as the well-known problem of centroid def-inition.21,31The overall goal of our work is therefore to develop robust methods for quantification of LV wall motion. The purpose of the present study was to test a novel measure of wall motion, 3D fractional shortening (3DFS), which we developed for the specific purpose of predicting the size of an acutely ischemic region. We validated 3DFS-based predictions of the size and loca-tion of experimentally induced ischemic regions against regional blood flow measurements. The change in 3DFS from baseline (D3DFS) predicted ischemic region size better than visual scoring by trained cardiologists, while identifying the location of ischemic regions with the same accuracy as visual scoring.
Prediction of Ischemic Region Size
We initially designed and tested 3DFS on computer simulations of acute ischemia with the goal of
predicting ischemic region size.11 In these computa-tional modeling studies, the fraction of the endocardial surface displaying abnormal 3DFS was linearly related to the fraction of myocardium that was ischemic, suggesting that 3DFS could be used to estimate the size of acutely ischemic regions (Fig. 4a).11 In the present study, we confirmed that D3DFS-predicted ischemic region size correlated well with true ischemic region size across a range of experimental coronary occlusions (Fig. 4b), as predicted by our original computer sim-ulation.11 Our computer simulation also predicted an inability to detect very small ischemic regions due to tethering to adjacent non-ischemic myocardium, a finding confirmed in three small occlusions performed here. This may reflect a fundamental limitation of wall motion analysis; in our computer models, we could detect smaller ischemic regions using circumferential strain but not using wall motion or wall thickening. When compared to the current state of the art, visual scoring by trained cardiologists, D3DFS provided a more accurate estimate of ischemic region size (Fig. 5).
Prediction of Ischemic Region Location The ability to predict the location of the ischemic region was similar among D3DFS and two trained cardiologists. The error in prediction of ischemic region location was higher than the error in prediction of ischemic region size (Fig.5); this is primarily because the measure of error for ischemic region location was particularly stringent. For example, a misregistration of the predicted and true ischemic region will produce false-negative classification of the endocardial surface on one side of the ischemic region and false-positive classification on the opposite side, essentially counting the error twice.
Benefits of 3D Analysis
The use of RT3DE offers several advantages over 2D imaging. For example, the reduced imaging time1,18
is crucial for exercise stress echocardiography, when the entire heart must be scanned rapidly at peak heart rate. Our novel technique takes advantage of the entire 3D geometry of the heart visible in RT3DE as opposed to individual slices through the image, allowing for continuous measurement of wall motion throughout the entire LV rather than at a few discrete locations. However, the most important advantage of RT3D for this work was the fact that the entire LV is visible in the image, enabling new solutions to the problem of defining a centroid as a reference system for wall motion analysis.21,31Using anatomical landmarks that are less affected by regional wall motion abnormalities than a centroid, such as the center of the mitral valve FIGURE 5. Comparison of error in predicting ischemic
region size and location from D3DFS vs. wall motion scoring. Quantitative analysis using D3DFS provided a significant reduction in error for predicting ischemic region size com-pared to wall motion scoring by both cardiologists and for localizing the ischemic region compared to wall motion scoring by one of the two cardiologists. * p < 0.05 compared to 3DFS; error bars indicate SD.
orifice, to register the position of the endocardial surface through time has been shown to be more reliable than selecting a centroid.4
Adjustment for Reduced Baseline Function In this experiment, opening the chest and adminis-tering anesthesia resulted in depressed baseline func-tion. To account for depressed baseline function, we subtracted wall motion measured in preceding baseline images from that obtained in occlusion images. In addition to accounting for reduced baseline function in this experiment, D3DFS provides a mathematical approach for comparing subsequent image datasets, and is capable of identifying subtle changes that might go unnoticed when viewing images side by side. The ability to account for reduced baseline function is clinically relevant for patients with heart failure or those who have had previous infarction. Our approach may also prove useful for evaluating follow-up studies and for comparing images obtained at rest and stress during stress echocardiography.
Analysis Time
Offline image analysis required approximately 15 min to trace the endocardial border for each data set and an additional 2 min for computing D3DFS. Visual wall motion scoring took approximately 10– 15 min for each data set. Therefore, routine compu-tation of 3DFS is already practical with a similar time investment to visual scoring. It is important to note that for assessment of ischemic region size as in this study, only two images (end diastole and end systole) must be traced. Other applications of quantitative wall motion analysis that are of clinical interest, such as the measurement of mechanical synchrony, require data from the full cardiac cycle, doubling the time required for editing the endocardial border using present soft-ware. As 3D image quality improves and software for detecting the endocardial border becomes more refined, the amount of time for image analysis will continue to decrease.
Limitations and Sources of Error
The largest sources of error and variability in our quantitative analysis are manual tracing of endocardial contours and selection of anatomic landmarks. In a preliminary study on 20 clinical RT3D images, we examined the repeatability of these two aspects as well as the sensitivity of our analysis to landmark selection. Repeat tracing of the end-diastolic endocardial surface by an experienced user after an average delay of 6 months resulted in an RMS difference in lambda of
9.4%. Repeat selection of landmarks after 6 months resulted in an average shift in the apical and basal landmarks of 4.6 and 5.3 mm (5.8 and 6.8% of LV long axis length) respectively. These landmark shifts translated to an RMS difference in lambda of 19.5%, suggesting that controlling variability in landmark selection should be our primary focus moving forward. Sensitivity analysis showed that our endocardial sur-face fits are more sensitive to shifts in the apical than basal landmark, which may increase variability in the setting of apical bulging or distortion. Future studies will include a full examination of inter-observer vari-ability on a large clinical dataset. At present, we note only that the success of our analysis in predicting ischemic region size in this study suggests that an experienced user can select landmarks and identify the endocardial border with sufficient accuracy to provide useful quantitative information using our approach, even in situations where the ischemic region involves the left ventricular apex.
In this study, we focused on testing D3DFS to determine its capability to predict the size and location of ischemic regions. However, ischemia was induced via total occlusion of various coronary arteries, creating a mismatch between regional oxygen supply and demand by reducing regional blood flow. In clinical stress echocardiography, the mismatch between oxygen supply and demand arises primarily from increasing demand rather than decreasing supply. Stress echocar-diography may therefore induce subtler ischemia than produced in our study. Additional studies are needed to determine whether the accuracy of our methods for predicting ischemic region size depends on the severity of ischemia. We expect that both the D3DFS threshold used to define ‘‘abnormal’’ wall motion and the specific relationship for predicting ischemic region size based on the size of the wall motion abnormality are likely to be different in closed chest humans and in the setting of enhanced overall ejection typical of exercise or dobu-tamine stress. For example, ischemic regions may demonstrate smaller increases in 3DFS than surround-ing healthy myocardium dursurround-ing clinical stress testsurround-ing, as opposed to the substantial decreases in 3DFS we observed during coronary occlusion in this study.
In this experiment, opening the chest and adminis-tering anesthesia resulted in depressed baseline func-tion. The depressed baseline may have reduced the effectiveness of wall motion scoring in detecting ischemia, since some segments were hypokinetic at baseline; we attempted to compensate for this by identifying as ischemic only segments in which wall motion score worsened from baseline. Four temporary occlusions were performed in each dog, potentially altering baseline regional function over the course of the study. We acquired intermediate baseline images
and hemodynamic data prior to each occlusion and found no significant change in baseline ejection frac-tion or end-systolic pressure over the course of the study. These data suggest that the use of multiple brief temporary occlusions in each dog, instead of single occlusions in a much larger number of dogs, was a reasonable approach that did not strongly affect the results of this study.
CONCLUSION
The purpose of this study was to test the ability of our novel measure of wall motion, 3D fractional shortening (3DFS), to identify the size and location of an experi-mentally induced ischemic region by validating our methods against regional blood flow measurements. Across 19 occlusions with satisfactory image quality, the fraction of the LV with depressed 3DFS and the fraction of segments with reduced visual wall motion scores both correlated with the microsphere-indicated true ischemic region size (3DFS r2= 0.64, cardiologist 1 r2= 0.44, cardiologist 2 r2= 0.67). However, 3DFS predicted ischemic region size more accurately than wall motion scoring, reducing error by more than half (3DFS error 0.079 ± 0.087, cardiologist 1 0.188 ± 0.127, cardiolo-gist 2 0.197 ± 0.155, p < 0.05). 3DFS and wall motion scoring identified ischemic region location with equal accuracy. The methods for wall motion analysis pre-sented here offer numerous advantages compared to currently available techniques including quantification of ischemic region size, fully 3D wall motion analysis, and elimination of the need for defining a centroid. We conclude that 3DFS is an objective, quantitative mea-sure of wall motion that localizes acutely ischemic regions as accurately as visual wall motion scoring while providing superior quantification of ischemic region size. This quantitative approach to identifying regional ischemia in three-dimensional images has the potential to improve clinical screening for coronary artery disease.
ACKNOWLEDGMENT
This study was supported by an Established Inves-tigator Award from the American Heart Association (JWH) and by NIH R01 HL085160 (JWH).
REFERENCES
1
Ahmad, M., T. Xie, M. McCulloch, G. Abreo, and M. Runge. Real-time three-dimensional dobutamine stress echocardiography in assessment of ischemia: comparison
with two-dimensional dobutamine stress echocardiogra-phy. J. Am. Coll. Cardiol. 37(5):1303–1309, 2001.
2
Armstrong, W. F., J. O’Donnell, T. Ryan, and
H. Feigenbaum. Effect of prior myocardial infarction and extent and location of coronary disease on accuracy of exercise echocardiography. J. Am. Coll. Cardiol. 10(3):531– 538, 1987.
3
Biagini, E., A. Elhendy, J. J. Bax, A. F. Schinkel, and D. Poldermans. The use of stress echocardiography for prognostication in coronary artery disease: an overview. Curr. Opin. Cardiol.20(5):386–394, 2005.
4Bjornstad, K., J. Maehle, S. Aakhus, H. G. Torp, L. K. Hatle, and B. A. Angelsen. Evaluation of reference systems for quantitative wall motion analysis from three-dimen-sional endocardial surface reconstruction: an echocardio-graphic study in subjects with and without myocardial infarction. Am. J. Card. Imaging 10(4):244–253, 1996. 5
Caiani, E. G., C. Corsi, J. Zamorano, L. Sugeng, P. MacEneaney, L. Weinert, R. Battani, J. L. Gutierrez, R. Koch, L. Perez de Isla, V. Mor-Avi, and R. M. Lang. Improved semiautomated quantification of left ventricular volumes and ejection fraction using 3-dimensional echo-cardiography with a full matrix-array transducer: com-parison with magnetic resonance imaging. J. Am. Soc. Echocardiogr.18(8):779–788, 2005.
6
Chuang, M. L., R. A. Parker, M. F. Riley, M. A. Reilly, R. B. Johnson, V. J. Korley, A. B. Lerner, and P. S. Douglas. Three-dimensional echocardiography improves accuracy and compensates for sonographer inexperience in assessment of left ventricular ejection fraction. J. Am. Soc. Echocardiogr.12(5):290–299, 1999.
7Corsi, C., R. M. Lang, F. Veronesi, L. Weinert, E. G. Caiani, P. MacEneaney, C. Lamberti, and V. Mor-Avi. Volumetric quantification of global and regional left ventricular function from real-time three-dimensional echocardiographic images. Circulation 112(8):1161–1170, 2005.
8
Dolan, M. S., K. Riad, A. El-Shafei, S. Puri, K. Tamirisa, M. Bierig, J. St Vrain, L. McKinney, E. Havens, K. Habermehl, L. Pyatt, M. Kern, and A. J. Labovitz. Effect of intravenous contrast for left ventricular opacifi-cation and border definition on sensitivity and specificity of dobutamine stress echocardiography compared with cor-onary angiography in technically difficult patients. Am. Heart J.142(5):908–915, 2001.
9Elhendy, A., D. W. Mahoney, B. K. Khandheria, T. E. Paterick, K. N. Burger, and P. A. Pellikka. Prognostic significance of the location of wall motion abnormalities during exercise echocardiography. J. Am. Coll. Cardiol. 40(9):1623–1629, 2002.
10
Gopal, A. S., Z. Shen, P. M. Sapin, A. M. Keller, M. J. Schnellbaecher, D. W. Leibowitz, O. O. Akinboboye, R. A. Rodney, D. K. Blood, and D. L. King. Assessment of cardiac function by three-dimensional echocardiography compared with conventional noninvasive methods. Circu-lation92(4):842–853, 1995.
11
Herz, S. L., C. M. Ingrassia, S. Homma, K. D. Costa, and J. W. Holmes. Parameterization of left ventricular wall motion for detection of regional ischemia. Ann. Biomed. Eng.33(7):912–919, 2005.
12
Hunter, P. J., and B. H. Smaill. The analysis of cardiac function: a continuum approach. Prog. Biophys. Mol. Biol. 52(2):101–164, 1988.
13
Kowallik, P., R. Schulz, B. D. Guth, A. Schade, W. Paffhausen, R. Gross, and G. Heusch. Measurement of
regional myocardial blood flow with multiple colored microspheres. Circulation 83(3):974–982, 1991.
14
Kuhl, H. P., M. Schreckenberg, D. Rulands, M. Katoh, W. Schafer, G. Schummers, A. Bucker, P. Hanrath, and A. Franke. High-resolution transthoracic real-time three-dimensional echocardiography: quantitation of cardiac volumes and function using semi-automatic border detection and comparison with cardiac magnetic reso-nance imaging. J. Am. Coll. Cardiol. 43(11):2083–2090, 2004.
15Kuo, J., B. Z. Atkins, K. A. Hutcheson, and O. T. von Ramm. Left ventricular wall motion analysis using real-time three-dimensional ultrasound. Ultrasound Med. Biol. 31(2):203–211, 2005.
16
Lang, R. M., M. Bierig, R. B. Devereux, F. A. Flachskampf, E. Foster, P. A. Pellikka, M. H. Picard, M. J. Roman, J. Seward, J. S. Shanewise, S. D. Solomon, K. T. Spencer, M. S. Sutton, and W. J. Stewart. Recommendations for chamber quantification: a report from the American Society of Echocardiography’s Guidelines and Standards Commit-tee and the Chamber Quantification Writing Group, devel-oped in conjunction with the European Association of Echocardiography, a branch of the European Society of Cardiology. J. Am. Soc. Echocardiogr. 18(12):1440–1463, 2005.
17
Marcovitz, P. A., V. Shayna, R. A. Horn, A. Hepner, and W. F. Armstrong. Value of dobutamine stress echocardi-ography in determining the prognosis of patients with known or suspected coronary artery disease. Am. J. Car-diol.78(4):404–408, 1996.
18Matsumura, Y., T. Hozumi, K. Arai, K. Sugioka, K. Ujino,
Y. Takemoto, H. Yamagishi, M. Yoshiyama, and
J. Yoshikawa. Non-invasive assessment of myocardial ischaemia using new real-time three-dimensional dobuta-mine stress echocardiography: comparison with conven-tional two-dimensional methods. Eur. Heart J. 26(16):1625– 1632, 2005.
19
Moller, J. E., G. S. Hillis, J. K. Oh, G. S. Reeder, B. J. Gersh, and P. A. Pellikka. Wall motion score index and ejection fraction for risk stratification after acute myocar-dial infarction. Am. Heart J. 151(2):419–425, 2006. 20
Mor-Avi, V., L. Sugeng, L. Weinert, P. MacEneaney, E. G. Caiani, R. Koch, I. S. Salgo, and R. M. Lang. Fast mea-surement of left ventricular mass with real-time three-dimensional echocardiography: comparison with magnetic resonance imaging. Circulation 110(13):1814–1818, 2004. 21Pearlman, J. D., R. D. Hogan, P. S. Wiske, T. D. Franklin,
and A. E. Weyman. Echocardiographic definition of the left ventricular centroid. I. Analysis of methods for cen-troid calculation from a single tomogram. J. Am. Coll. Cardiol.16(4):986–992, 1990.
22
Pellikka, P. A., V. L. Roger, J. K. Oh, F. A. Miller, J. B. Seward, and A. J. Tajik. Stress echocardiography. Part II. Dobutamine stress echocardiography: techniques, imple-mentation, clinical applications, and correlations. Mayo Clin. Proc.70(1):16–27, 1995.
23
Picano, E., F. Lattanzi, A. Orlandini, C. Marini, and A. L’Abbate. Stress echocardiography and the human factor:
the importance of being expert. J. Am. Coll. Cardiol. 17(3):666–669, 1991.
24
Pulerwitz, T., K. Hirata, Y. Abe, R. Otsuka, S. Herz, K. Okajima, Z. Jin, M. R. Di Tullio, and S. Homma. Feasibility of using a real-time 3-dimensional technique for contrast dobutamine stress echocardiography. J. Am. Soc. Echocardiogr.19(5):540–545, 2006.
25
Sapin, P. M., G. B. Clarke, A. S. Gopal, M. D. Smith, and D. L. King. Validation of three-dimensional echocardiog-raphy for quantifying the extent of dyssynergy in canine acute myocardial infarction: comparison with two-dimen-sional echocardiography. J. Am. Coll. Cardiol. 27(7):1761– 1770, 1996.
26Sawada, S. G., D. S. Segar, T. Ryan, S. E. Brown, A. M. Dohan, R. Williams, N. S. Fineberg, W. F. Armstrong, and H. Feigenbaum. Echocardiographic detection of coronary artery disease during dobutamine infusion. Circulation 83(5):1605–1614, 1991.
27
Segar, D. S., S. E. Brown, S. G. Sawada, T. Ryan, and H. Feigenbaum. Dobutamine stress echocardiography: correlation with coronary lesion severity as determined by quantitative angiography. J. Am. Coll. Cardiol. 19(6):1197– 1202, 1992.
28
Takuma, S., T. Ota, T. Muro, T. Hozumi, R. Sciacca, M. R. Di Tullio, D. K. Blood, J. Yoshikawa, and S. Homma. Assessment of left ventricular function by real-time 3-dimensional echocardiography compared with con-ventional noninvasive methods. J. Am. Soc. Echocardiogr. 14(4):275–284, 2001.
29Vlassak, I., D. N. Rubin, J. A. Odabashian, M. J. Garcia, L. M. King, S. S. Lin, J. K. Drinko, A. J. Morehead, D. L. Prior, C. R. Asher, A. L. Klein, and J. D. Thomas. Con-trast and harmonic imaging improves accuracy and effi-ciency of novice readers for dobutamine stress echocardiography. Echocardiography 19(6):483–488, 2002. 30
Walimbe, V., M. Garcia, O. Lalude, J. Thomas, and R. Shekhar. Quantitative real-time 3-dimensional stress echo-cardiography: a preliminary investigation of feasibility and effectiveness. J. Am. Soc. Echocardiogr. 20(1):13–22, 2007. 31
Wiske, P. S., J. D. Pearlman, R. D. Hogan, T. D. Franklin, and A. E. Weyman. Echocardiographic definition of the left ventricular centroid. II. Determination of the optimal centroid during systole in normal and infarcted hearts. J. Am. Coll. Cardiol.16(4):993–999, 1990.
32
Yao, J., Q. L. Cao, N. Masani, A. Delabays, G. Magni, P. Acar, C. Laskari, and N. G. Pandian. Three-dimensional echocardiographic estimation of infarct mass based on quantification of dysfunctional left ventricular mass. Circulation96(5):1660–1666, 1997.
33Yao, S. S., E. Qureshi, A. Syed, and F. A. Chaudhry. Novel stress echocardiographic model incorporating the extent and severity of wall motion abnormality for risk stratifi-cation and prognosis. Am. J. Cardiol. 94(6):715–719, 2004. 34
Zwas, D. R., S. Takuma, S. Mullis-Jansson, A. Fard, H. Chaudhry, H. Wu, M. R. Di Tullio, and S. Homma. Feasibility of real-time 3-dimensional treadmill stress echocardiography. J. Am. Soc. Echocardiogr. 12(5):285– 289, 1999.