[a]sorted Selection: Improving Building Performance
and Diversity Using a New Form of Interactive
Evolutionary Algorithm
by Joshua Ingram M.S., Engineering
Stevens Institute of Technology, 2007 B.S., Architecture
University of Texas at San Antonio, 2005
MASSACHUSETTS INSTITUTE OF TECH NOLOGY
JUN
0
2012
L BRARIES
ARCHNvES
SUBMITTED TO THE DEPARTMENT OF ARCHITECTURE IN PARTIAL
FULFILLMENT OF THE REQUIREMENTS FOR THE DEGREE OF
MASTER OF SCIENCE IN ARCHITECTURE STUDIES
AT THE
MASSACHUSETTS INSTITUTE OF TECHNOLOGY JUNE 2012
@2012 Joshua Ingram. All rights reserved.
The author hereby grants to MIT permission to reproduce and to distribute publicly paper and electronic copies of this thesis document in whole or in part
in any medium now known or hereafter created.
)
/2
Signature of Author: C Certified by: ) V Department of Architecture May 24, 2012 /7 Certified by: Accepted by:611
Terry Knight Professor of Design and Computation Thesis SupervisorUna-May O'Reilly Principal Research Scientist Thesis Supervisor
Takehiko Nagakura Associate Professor of Design and Computation Chair of the Department Committee on Graduate Students
Thesis Committee
Terry Knight Professor of Design and Computation Thesis Supervisor Una-May O'Reilly Principal Research Scientist Computer Science and Artificial Intelligence Lab
Thesis Supervisor Kalyan Veeramachaneni Postdoctoral Associate Computer Science and Artificial Intelligence Lab Thesis Reader
[a]sorted
Selection: Improving Building Performance and Diversity
Using a New Form of Interactive Evolutionary Algorithm
by
Joshua Ingram
Submitted to the Department of Architecture on May 24, 2012 in Partial Fulfillment of the Requirements for the Degree of Master
of Science in Architecture Studies
ABSTRACT
There have been numerous studies demonstrating the use of optimization in architecture, yet it has not been adopted in the field, especially in the early stages of design. As buildings become more complex, the use of optimization in design becomes more relevant. Still, there is a gap between the way architects work and the role optimization plays in the design process. This work presents a new methodology, IDEA (interactive diversity-driven evolutionary algorithm), for designers to engage optimization in the early stages of design. IDEA is designed to work in a manner that is comfortable to the designer and easily integrated into the design process. By focusing on similarities and differences of form, designers sort design options into clusters. The clusters are used to develop a diversity-metric that IDEA uses to generate diverse design options that satisfy the objective. This work demonstrates a novel approach to interaction to better assist in early stages design.
Thesis Supervisor: Terry Knight
Title: Professor of Design and Computation
Thesis Supervisor: Una-May O'Reilly
Table of Contents
1 Introduction...
1.1 Proposal ...
11
12 2 Background and Related Work ...
2.1 O ptim ization ...
2.1.1 Multi-objective Optimization ... 2.1.2 Mathematical Optimization ...
2.1.3 Evolutionary Computation ...
2.1.4 Interactive Evolutionary Computation . 2.2 C lustering ... 3 ID E A ... 3.1 Setup ... 3.2 Interaction ... 3.3 User Em ulation ... 3.3.1 Consensus Clustering ... 3.3.2 Automated Clustering Algorithm ...
3.4 O ptim ization ...
3.5 Result Selection ... 4 Experim ent ...
5 C onclusion ... A A ppendix ...
A.1 Himmelblau Test Case ...
A .2 Experim ent Results ...
... ...
1 2 3 4 5 6 7 8 9 10 11 12 13 14 15 16 17 18 19 20 21 22 A.1 A.2 A.3 A.4 A.5 A.6
List of Figures
Pareto front in a sample data set ... 16
Gradient based optimization in a 1-D search space ... . 19
Example clustering of 2D data points ... 23
Example of hierarchical clustering ... 23
Example of hierarchical clustering selection ... 24
Example of K-means clustering... 25
IDEA work flow ... 27
Example subset comparison for consensus clustering ... 30
Comparison of silhouette distance and nearest neighbor methods ... .32
Sample data points and selection methods ... 33
Context model developed for experiments with IDEA ... . ... 35
Building parameters used in IDEA experiment ... 36
Sample building in Ecotect showing insolation analysis coloration ... 37
Interaction environment presented to designers ... 38
Sample of clustering by a designer... 39
Results of clustering by a designer... 39
Resulting consensus clustering of two designers ... 40
Graph of dominated variables for each designer ... 41
Results from optimization for designer 2 ... 41
Results selected by IDEA from optimization for designer 2... 42
Selected results shown in context model ... 43
Graph of fitness values from IDEA compared to random selection ... 44
Himmelblau Function represented in 3D color graph ... 51
IDEA's design option selection for Himmelblau function ... 54
Clustering by designers ... 57
Consensus clustering for designers ... 60
Optimization result for designers ... 63
1 Introduction
Optimization has proven useful as a quick and effective method for solving tedious and complex architectural problems; however, its successes have been limited to a small portion of the design process. Optimization in architecture is typically used in the later stages of design. This occurs after major design decisions have already been made and where smaller problems with limited scope can be addressed. The majority of the problems left to be solved surround the engineered aspects of the project. Optimization works well here for several reasons. One, the design has stabilized, so it easier to understand the variables and comprehend the effects of the optimization. Two, because the design is more stable, less changes can be expected. Thus, the results produced from the optimization are more likely to be useful to the project. Finally, engineers and optimization work in the same realm of design, mathematics. For an engineer, it is relatively easy to understand, mathematically, what the variables and the constants are within the domain of optimization. The engineer can think of the optimization as an answer machine. For example, they can ask a question, "What is the minimum beam depth for a specified load" And the optimization process can provide an answer, "55 millimeters." In these situations optimization is a useful tool because: the problems are finite; the answer is more likely to be implemented. There is a clear understanding of the constraints and objectives, simplifying the setup of the optimization routine.
In the earlier stages of the design process, also known as the conceptual design phase, optimization is typically not considered. One reason is because in this stage the problem is not yet clear. A single solution provided by a typical optimization process may not be useful because the focus is too specific. Rather, at this stage, a breath and depth of ideas are encouraged. Optimization is also not considered because the objectives of interest are qualitative and often intangible concepts which are difficult to translate into mathematical functions. This creates doubt that optimization can play a role in the conceptual design phase.
Although the role of optimization in the conceptual design phase is obscured by these deterrents, there is still a use. Optimization can act as a bridge to incorporate conceptual ideas that are usually considered too complex in the early stages of design. Concepts that involve structure and environment, for example, can also become an integral part of the design. These concepts are often avoided in the early stages of design because of the complexity involved in understanding and implementing them during the conceptual design phase. For instance, the architect may focus on creating a comfortable climate in the building while maintaining a low energy foot-print. Trying to understand which aspects of the design affect this criteria, and what changes benefit or impair this design goal can be a difficult task. The architect may choose to avoid the problem in order to meet deadlines. Also, if a project shifts direction midway through the project, it may marginalize the work done to make these ideas meaningful. For example, a building envelope could be optimized to maintain comfortable climate in the interior space during the summer. If a code requirement causes the architect to
rotate the building 5 degrees later in the project, an over-specific solution to the building envelope may cause undesirable temperatures as a result. Integrating these types of complex concepts early in the design process can also inhibit other factors that are important to the design as well. For example, after finding a solution that creates comfortable climate by adjusting the building envelope, the designer may realize the form is unattractive and discard the solution.
Optimization can be used to overcome these obstacles, but implementation needs to be rethought in order to avoid the pitfalls that cause optimization to become ineffective. Therefore, a new methodology needs to be developed that employs optimization in a way that helps provide designers with conceptual direction without being overly specific, while incorporating qualitative information important in the conceptual design phase.
Example Scenario: A junior architect works in an architecture firm on a design team. The principal architect calls a meeting to introduce a new project. During the introduction the princi-pal architect says that they want to take advantage of day lighting in this project. The principrinci-pal architect asks the junior architect to produce a handful of concepts by the end of the week. The junior architect can tell from the existing context, it is clear that this site has its access to sunlight obstructed by adjacent buildings. The junior architect goes back to his studio and starts to contemplate ideas. He understands the emphasis on day lighting, but the site and context's awkward configuration obscure design options. As a result of the short time-frame, the junior architect focuses on developing ideas that may or may not take advantage of day lighting, and can only hope that there is something that can be incorporated later when the design idea has been settled on and there is time to run analysis or work with a consultant.
This is a typical challenge that occurs for architects. There are specific criteria fundamental to a project, but without significant time and resources it may be difficult or impossible to come up with a valid architectural solution. Even if a suitable solution was discovered, there is no guarantee that it would be aesthetically pleasing or architecturally valid. Furthermore, a single solution early in the design phase that is overly specific is useless as the architecture will evolve and change in ways that could completely undermine the problem solving features of the form.
1.1 Proposal
What is needed is a quick and efficient method for integrating additional concepts into the design in a way that facilitates architectural creativity. What would be helpful in the previous scenario is for the architect to be provided with a range of solutions that take advantage of day lighting. This would allow the architect to choose a form that may not only perform well for day lighting, but may also have potential for other areas
of the project that are more qualitative. For instance, the architect may realize that options that satisfy day lighting criteria also allow him to consider which buildings are more visually appealing. A range of solutions also provides the architect an enhanced understanding of what changes in the form improve day lighting. If the form that appears to perform the best for day lighting is not functional or aesthetically pleasing, the architect would have choices that may be more suitable. If later in the project a change was required, the architect could weigh the changes against all day lighting options to understand how the change may affect the performance. The result would be a more comprehensive investigation into the chosen criteria that would improve design and performance while maintaining a low-key role in the project.
This thesis proposes such a methodology for integrating optimization into the early stages of design to help architects make better decisions about complex design concepts. IDEA (interactive diversity-directed evolutionary algorithm) is a prototype that integrates interaction with the designer into an evolutionary algorithm that focuses on diversity as one of its two objectives, performance being the other, which could be described as interaction plus diversity-driven evolutionary algorithm (I+DEA). IDEA quickly produces a range of solutions that can provide a variety of potential design directions. By creating a diversity metric, the optimization can serve as an idea machine instead of an answer machine. IDEA consists of 5 phases. Setupis the first phase where goals, constraints and parameters are defined. In the second phase, or Interactionphase, designers are asked to cluster buildings based on similarities and differences of important features. Designer Emulationis the third phase in which the system uses the clusters provided by the user for the diversity metric. These diversity parameters along with the designer's initial objective are used in the fourth phase, the Optimizationphase, to produce a range of well-performing, diverse results. The last phase, the Results Selectionphase, selects a handful of these solutions and provides them to the user. This thesis produces several contributions for the architecture community through the development of IDEA:
* Optimization in the early phases of design : This methodology is able to provide a range of design options that enable early integration of optimization in the design process. The key factor to success is the integration of a diversity metric.
" IDEA: This thesis demonstrates a novel metric and methodology that measures diversity within a given set of design options. Designers can help express their perception of diversity and it will be reinforced as an objective in the optimization.
" Minimal user fatigue : By carefully sampling the space of design options and asking the designer to only cluster small, overlapping sets, the designer's perception of diversity can be modeled allowing a computation approach to clustering all designs option based on diversity. The designer is removed from constant interaction with the system resulting in a system that uses interaction for evolutionary computation instead of "interactive evolutionary computation."
2
Background and Related Work
In order to develop an architecturally relevant conceptual design tool, IDEA, emphasis was placed on pro-viding the architect with a range of solutions. Optimization and clustering are fundamental building blocks employed in IDEA. While the optimization method focuses on providing solutions, the clustering methods works to make sure the solutions are diverse. A full explanation of how optimization and clustering meth-ods are employed is provided in the implementation section. Optimization has been used in architecture in various capacities as a problem solving technique. Clustering has played a smaller role in architecture and is recently finding more relevance as architecture embraces computation. The focus of this section is to define these methods and provide architecturally relevant examples to address their use in architecture and IDEA.
2.1 Optimization
Optimization is usually considered a computational tool, but architectural design can also be thought of as optimization process. Based on the definition of optimization, architecture can be described as the iden-tification of the best architectural decision for a given architectural problem with certain constraints. The search to identify the best decision encompasses all design phases, but the conceptual design phase is the part of the process where the constraints and direction are determined. Though the fitness criteria may be subjective and the process structured differently than typical optimization techniques, design exhibits all of the fundamental characteristics of optimization. It is a goal-directed activity in which decisions are made to maximize fitness [10].
The parallels in architect and optimization suggest architectural design can benefit from advancements in optimization techniques. For instance, in the article "Architectural Layout Design Optimization," Michalek, Choudhary, & Papalambros (2002) employed multiple optimization techniques to find ideal architectural layouts for space [9]. The authors explore two fields of research in optimization: mathematical optimization and evolutionary computation [9]. Mathematical optimization represents a large field of study where most techniques are built on fundamental mathematical concepts, like classic calculus. Alternatively, evolutionary computation is based on a biological evolutionary model. Both fields provide different avenues for finding the optimal solution in a complex search space, whether it is for a single objective or multi-objective.
2.1.1 Multi-objective Optimization Multi-objective refers to an optimization system composed of two or more criteria (objectives). When generating solutions in a multi-objective space understanding the relationship between the objectives can be difficult. Instead of having a single best solution, a range of best solution exists where each solution may perform better in one of the criteria than another best solution.
This tradeoff can complicate how the user interprets the data. One way to understand the relationship between the objectives is to represent the data in a two dimensional plot where each axis represents one of the objectives (see Figure 1). All of the solutions can be mapped in this graph providing a convenient method for evaluating results. The best solutions are quantified using a concept known as Pareto optimal [14]. These solutions lay on, what is known as, a Pareto front. Figure 1 shows an example of a two dimensional optimization represented using in this manner. In figure 1, the Pareto front is represented by the solutions connected via the dotted-line. Any solution that is better than another solution on all objectives in termed "non-dominated" and is considered Pareto optimal. For example, in Figure 1, A is a Pareto optimal solution because no other solutions perform better in both objectives. This is evident as no other solutions exist in the area indicated by the blue rectangle. Results that have performance inferior to other solutions in all objectives are known as dominated solutions. For example, the red rectangle in Figure 1 demonstrates how solution B is dominated by solution C. This means that C performs better than B in all objectives. Using this approach it is easy to distinguish between optimal and non-optimal solutions, this is represented in Figure
1 where the optimal solutions are connected via a dotted line.
F2max
O
.
D n S i BLa
G13 VCDointe Solutioonsiml oltin
00
F2min
0x
EFirst Objective (F1) E
Fig. 1: Pareto front in a sample data set
2.1.2 Mathematical Optimization Classical calculus and mathematical programming are sub-fields
problems [10]. Radford & Gero (1987) present several cases studies for both of these categories [10]. For classical calculus, they propose a hypothetical problem to calculate the preliminary sizing of a public housing estate [10]. They use differential calculus to calculate the maximum benefit of the project in terms of cost(C), benefit (B), net benefit (N), and area (X). They develop a set of equations for each criteria expressed in terms of area (X) [10].
B = 200+ 100X
C = 100+40X2
N = B -C = 100 + 100X - 40X 2
This allows them to specify a single objective as maximizing net benefit (N) [10]. By solving the first derivative of N with respect to X and evaluating the second derivative of N, they are able to find a maximum solution for all criteria: net benefit, benefit, cost, and area [10]. Classic calculus is a simple and elegant approach to problems of this type that can be expressed as a series of formulas [10]. But, classic calculus is limited to problems that have only a few constraints, are continuous, and differentiable [10]. Architectural problems rarely present themselves this way and are often discontinuous and non-differentiable [10]. Though there are methods for managing and/or abstracting problems to overcome the limitation, it can become overly complex and undermine the elegance of the approach.
Other techniques have specifically developed to overcome the limitation of the classic calculus approach. These techniques, referred to as mathematical programming, search iteratively for solutions. The concept is based on moving from an existing solution to a better solution until no better solution can be found. Simplex is a method that can be used to understand the basis of mathematical programming. The simplex method can be defined by three rules:
" Locate a feasible solution
" Determine rate of change of the objective and adjacent solutions (adjacent solutions are solutions that are different than the current solution by a fixed change in each variable)
" Move toward the solution with the highest rate of change; and finally, repeat rule 2 until the rate of change reaches zero [10].
Figure 2 represents a one dimensional problem that demonstrates, visually, how the simplex method works. In Figure 2 the current solution would migrate toward the local optimal based on the rate of change. Radford & Gero (1987) used a case study to identify the minimum length of an apartment using the simplex method [10]. By defining the length of each space (i.e. bedroom (Xi), bathroom (X2), kitchen (X3), living room (X4), ECT (X,)) in the apartment as a variable, the objective can be defined as an equation [10]:
Z = min(X1 + X2 + X3 + X4 + Xn)
After which, the simplex method's rules can be carried out until an optimal solution is reached. This results in a value for the objective function (length of the apartment) and values for each decision variable (length of each space) [10].
Mathematical programming, in most cases, can guarantee an optimal solution in a finite number of steps as long as its requirements are satisfied. The requirements for a problem to be solvable are: the variables must be continuous and all relationships that describe the problem must be linear. This is an issue because very few architectural problems satisfy both of these requirements. For example, area is a common concern in architecture that is represented as a non-linear expression. Also, the system may result in a sub-optimal solution, settling on a local optimum, as shown in Figure 2. In this figure, because of the initial solution, the result will trend toward the local optimal, instead of the global optimal. Though there are specialized techniques for avoiding local optimum traps, they can add complexity to the optimization and may not provide a broad application to a wide range of problems. Evolutionary computation provides an alternative approach capable of avoiding some of the pitfalls of mathematical optimization.
2.1.3 Evolutionary Computation Evolutionary computation (EC) provides an optimization model that
can be applied to any problem. Evolutionary algorithms (EA) have the ability to solve complex problems that other optimization techniques cannot. They can be applied to problems that have discrete feature sets (i.e. beam sizes, material thickness), discontinuous search spaces, and problems that are stochastic (i.e. a system whose behavior is intrinsically non-deterministic). They can often find the global optimal solution within a search-space. Evolutionary algorithms benefit from their inherent parallelism and the ability to perform recombination [17]. All EC systems are based on an interpretation of biological evolution, sometimes referred to as Darwinian evolutionary systems [3]. For a system to be an EA, it needs to consist of three components [2,3]:
" Must be population based
Fmax 40 0 t Global Optimum Adjacent Solutions Fmin X
~
Variable (X)EFig. 2: Gradient based optimization in a 1-D search space
* Must have a selection mechanism that decides which individuals will move to the next generation. Though not without its challenges, the simplicity of the approach allows EAs to be applied to almost any optimization problem. It is an ideal choice when developing a system that is generalized for a wide range of problem types.
One type of EC that can be applied to optimization problems is particle swarm optimization, which is a technique inspired by the behavior of insects and animals as they collectively communicate and adapt while solving a natural optimization problem. It is a simple model which represents each creature as a "particle" (potential solution) moving through the solution space, from position to position, at a velocity. During the optimization the particle changes its position and updates 3 key pieces of information: the best position (or solution) it has visited so far, the best position it and all other members of the swarm have visited (global best) and its velocity. [8]. Velocity represents the magnitude and direction of changes a particle will make when changes its position from one generation to the next. Each generation, the swarm's particles each make a new design option. Then the new information about their performance on the objective is compared and updates to local best, global best are made. Consequently, this information is used to update the particle's position and velocity. A particle's strategy is to steer toward the global best while also considering the location of the best solution it has ever encoded. The result is an optimization technique efficient at solving a wide range of problem types [6].
A further subdivision of PSO is NSPSO (non-dominated particle swarm optimization). NSPSO is a technique
for employing PSO in on multi-objective problems. Particles, in NSPSO, still contain and produce new design options as well as share information between particles to push the solutions towards the Pareto-optimal front ( 2.1.1) [8]. NSPSO employs crowding distance to maximize diversity in objective space [8]. Crowding distance is a niching method that allows each particle to set a target goal to one of the current best particles at random each generation [8]. The target is selected by sorting, in ascending order, the best particles using nearest neighbor interpolation (a distance measure to the nearest particles in the search space) and selecting randomly from the particles that have the greatest distance [8]. This helps avoid premature convergence and helps maintains diversity in the design options. Without a crowding distance function, NSPSO can lose diversity caused by all particles converging towards a global best. The optimization can become trapped in local optimum. Crowding distance provides a mechanism for considering less fit particles that have greater potential for exploring new areas of the search space.
2.1.4 Interactive Evolutionary Computation IEC is a sub-field of EC that employs the same
tech-niques as EC but integrates a human participant into the selection stage of the process [13]. The human can act as a black box evaluator of potential solutions to report of the fitness for optimization [13]. In lieu of automatic fitness evaluation, a black box is a system that is computationally inaccessible, meaning the methods by which the information is obtained is unknown to the system. By using human evaluation, new criteria can be explored outside the reach of current computational models. One of the most commonly considered criteria is personal preference. For example, Tachikawa & Osana (2010) use preference as the criterion for an office layout system [12]. In this system, a genetic algorithm uses a handful of room layouts provided by the user to generate variation of those plans [12]. The results are presented to the user, who then makes decisions about which layout to continue with in the next generation [12]. The system continues this process until the user is satisfied with the results [12].
Human evaluation criteria are often used in multi-objective optimization, to provide the user more control over outcome. This is accomplished by allowing the system to optimize for one criterion while the user directs the system toward a more desired outcome. This process is becoming more prevalent in architecture as designers are looking for a means of managing more complicated concepts.
In the paper "Suitability of Genetic Based Exploration in the Creative Design Process" Buelow (2008) uses IEC to design a bridge, while considering structural performance and personal preference [16]. Each generation calculates a set of potential solutions based on structural analysis of each bridge under a specific loading scenario [16]. The loading scenario is held constant for all designs evaluations [16]. Next the designs are presented to the user [16]. In this article, a group of users participating simultaneously are presented with a set
of designs [16]. After four generations, suitable solutions were generated that met all criteria [16]. This system provided the user with a bridge design that was structurally sound and aesthetically acceptable. Although the results are attractive and competent, there are some drawbacks to this approach. Structural analysis can be computationally intensive. In this case study, 100 virtual machines running in parallel were used to generate structural analysis information. Problems that are computational intensive can either take too long to be applied effectively in architecture or require more resources than are available in an architectural setting. Also, when integrating users into the optimization process, the fatigue of the user must also be considered. In traditional computing models, optimization processes can run millions of evaluations. Human users cannot work on such large data sets; therefore the number of evaluations must be carefully set.
Mueller and Ochsendorf (2011) address some of these concerns in their paper, "An Interactive Evolutionary Framework for Structural Design," where they demonstrate the use of IEC for solving conceptual structural design problems [15]. They present two problems solved using their system [15]. One is a truss design problem with 3 variables and the other is a rigid frame structural design problem with 17 variables [15]. As in the bridge design problem, the human interaction objective is an expression of personal preference [15]. In this case, the focus is on implementing a fluid and efficient user experience [15]. By focusing on a near instant response from the system after user evaluation, their system helps to mitigate user fatigue [15]. To provide the quick response from the system when evaluating the complex problems of structural optimization, a regression model was generated to simulate the structural analysis [15]. A regression model uses regression analysis, a method used in statistics, to estimate the conditional expectation of the objectives given the variables [15]. Though regression modeling only provides estimated results of analysis, it can be used to provide results quickly [15]. Full structural analysis can be performed intermittently to verify the regression model's output [15]. The implementation of regression modeling addresses two main concerns still associated with using IEC in architectural design. First, it allows complex problems to be simulated quickly, making it more feasible to integrate into fast paced architecture schedules. It also helps reduce user fatigue by minimizing the wait time between user evaluations.
Still, there are issues that hinder integration into the design process. Regression modeling can present its own limitations. Depending on the complexity of the problem it can be difficult to create an accurate regression model. Regression modeling also requires sample data generated using the actual analysis. The amount of data is dependent on the complexity of the problem. For complex problems, generating the initial data may deter architects from engaging with the process. Another problem with IEC is that the initial stages of design need to fuel creativity, without limiting it with single design options. Even though the personal preference objective drives the outcome toward a more acceptable design solution, architects often require more than a single design direction in the early stage of design. In the conceptual design phase, another issue that arises
is the undecided direction of the project, making it difficult to use an IEC system that asks for personal preference as an objective.
In the fast paced design environment, allocating time and resources to a new technique can be a difficult choice for the architect. It is important that the system integrate in a way that feels natural to architects and is minimally intrusive to their work style. Although there are numerous optimization methods, some of which have just been briefly discussed, each exhibits shortcomings that discourage integration in the early phases of design. Mathematical methods, though powerful, are limited to linear, continuous, discrete problem types, making them unsuitable for many design problems. EC overcomes these challenges but can also be ineffective. Single objective EAs can produce results that do not satisfy all project constraints and it can be difficult or impossible to integrate all of the important criteria into a multi-objective EA. IEC provides a solution to these problems by allowing designer input to influence to outcome. Although this approach gets closer, it is often implemented in a way that is not congruent with the work process in the early stages of design. The interaction objective is usually personal preference, which can be hard to quantify in the beginning of a project. Also, user fatigue can hinder engagement and must be minimized.
IDEA is a system that attempts to maximize design options while minimizing effort on the part of the architect. It shifts from the commonly used interaction object, personal preference, to articulating desire for diverse design solutions. This allows IDEA to work automatically after it has been taught the designer's notion of diversity producing a range of results that all satisfy both performance and diversity. When ready, the architect can evaluate each solution as a potential design and view multiple avenues for design develop-ment. The result is a new methodology for integrating IEC in the early stages of design to produce more informed architecture without disruption of the current process.
2.2 Clustering
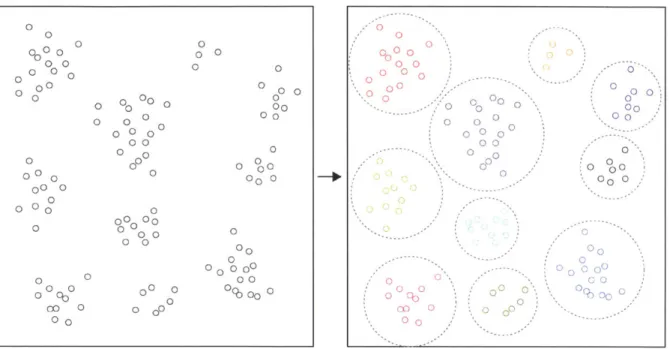
Clustering, or cluster analysis, is a computational technique for organizing objects into groups whose mem-bers are similar is some way [5]. Figure 3 shows clustering on a set of two dimensional points. There are innumerable applications for clustering in data analysis, most of which reside in one of 3 main categories [5]:
" To gain insight into data (generate hypothesis, detect anomalies, identify salient features)
" To identify the degree of similarity among forms " To organize or summarize data
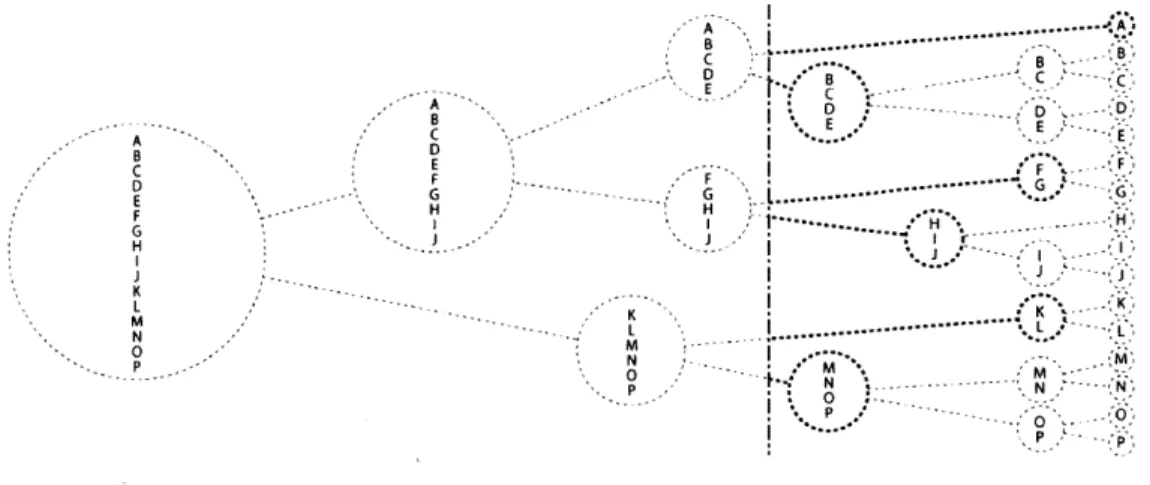
Methods for cluster analysis can be divided into two groups: hierarchical and partitional. Hierarchical clus-tering is a top-down technique of starting with one large cluster and continually subdividing until one data
00 0 0 oo 0 0 0 0 o0 0 0 00 0 0 0 0 0 000 00 0 000 0 0 00 00 0 00 ,.00 00 0 00 0 0 0 000 00 0 000o0 0 000 0 0 00 0 00 0 00 00 o 000 000 00 00 0000 00 000 o 0 00 o 0 0 0 0 0 0 0000 00 0 0 0 0 co 0 000 00 0 0 0 0
~00
00 0 0Fig. 3: Example clustering of 2D data points
A B C D E F H K L M N 0 P K - L -M 0 PP
Fig. 4: Example of hierarchical clustering
point is left in each cluster. Hierarchical clustering can also be employed in reverse, starting with every data point in its own cluster and merging clusters of similarity until only one remains [5]. This type of clustering analysis results in tree structure as shown in Figure 4. Once clustered a user can select where within the hierarchical clustering to sample, as shown in 5. A division line is inserted and clusters connected to the line are selected. This provides more flexibility to the user when deciding the optimal number of clusters by which to divide the space.
0 o Cb 0o o C D c -D --- -E C-F K L -.. .L M M D E
A... D.-D.
Fig. 5: Example of hierarchical clustering selection
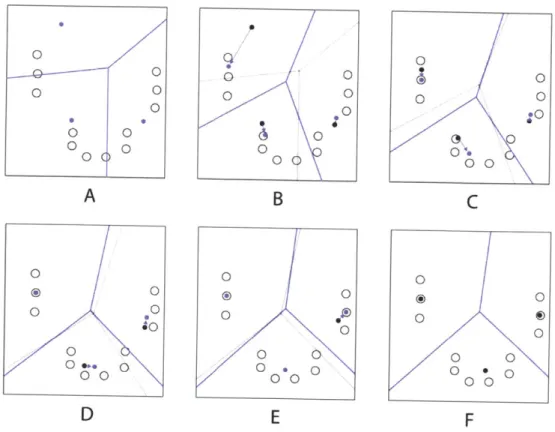
Partitional clustering find all clusters simultaneously by partitioning the space of the data points. The simplest and most popular partitional clustering algorithm is K-means [5], proposed over 50 years ago. According to Jain (2010), K-means algorithm finds a partition such that the squared error between the empirical mean of a cluster and the points in the cluster is minimized [5]. One way of understanding K-means is visualizing the process on a two dimensional set of points as shown in Figure 6. In Figure 6, three cluster center points are randomly placed in A represented by the blue dots. The data points are assigned to a cluster based on their proximity to the nearest cluster center point. New center points are calculated to represent the mean distance between the data points in each cluster in Figure 6B. The data points are reassigned to the nearest cluster center point in Figure 6B3-F. This is repeated until the amount of change in cluster centers diminsihes to below a small threshold (shown in Figure 6F).
There are few examples of the use of clustering in architecture, though one recent work by Ophir (2010) uses clustering to design 1 bedroom apartments using influences from like-minded individuals [7]. Ophir's (2010) work presents a web application, UDesign, that lets users personalize their apartments to meet their individual needs [7]. UDesign integrates social networking to allow a user to engage his/her peers for advice and ideas [7]. By clustering the user with other members of the social network based on similarities represented in their profiles, UDesign creates a system of peer review, and provides suggestions based on other users designs [7]. UDesign also uses clustering to relate floor plan components (i.e. dining tables, sofas, appliances) to provide alternative suggestions to the user [7]. Clustering is employed on two levels in Ophir's (2010) work: it relates users based on similar design taste, and it relates architectural components based on usage and rating by different users [7]. IDEAuses a different approach to clustering by asking a designer to cluster objects to allow the system to produce suggestions. Clustering provides a method for engaging designers in automated system in a way that has never been possible before. This opens new avenues of exploration into
0 0 0 0 0 *0
o
0 0A
B
C
F
Fig. 6: Example of K-means clusteringcomputer-augmented design. IDEAexplores the concept of computer-augmented design though an interactive optimization process.
3
IDEA
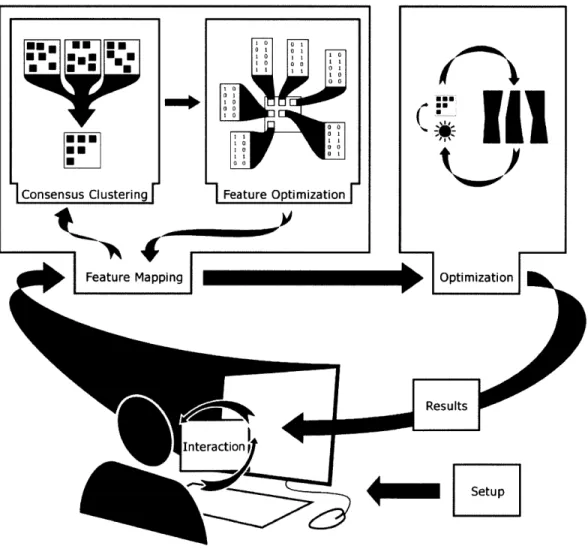
IDEAis a made up of 5 phases: Setup, Interaction, Designer Emulation, Optimization, and Results Selec-tion(Figure 7). In order to implement these 5 phases, multiple computational tools/environments are lever-aged including Rhinoceros, Matlab, and Ecotect. Custom software was developed to manage interoperability between programs (allowing each piece of software to work together). The optimization and clustering algo-rithms were developed by Dr. Kalyan Veeramachaneni of the Evolutionary Design and Optimization Group at the CSAIL at MIT using Matlab (mathematical programming software). In the experiment conducted with this research, Rhinoceros (3D modeling software) provided an interface for interaction and Ecotect (environmental analysis software) was used for analysis. The 5 phases implemented in IDEAallow for novel generation of design ideas based on complex criteria in the early stages of design.
0 U.om :0 E N 0101 * *~ 0 0 0 1 00 oils
VIII
1 0 0 O ptimization [nteraction SetupFig. 7: IDEA work flow
3.1 Setup
IDEA, similar to most optimization systems, requires some decisions to be made prior to engagement with the system. In IDEA, several decisions are required to provide a framework for experimentation. First, the problem needs to be defined. The problem definition can be general, but should include a goal (objective), a metric by which to measure success (fitness), a method to provide varying options (variables), and limits to those options (constraints). The goal and fitness function are directly related. For example, a goal of maximizing structural stiffness would require a fitness function that performs structural analysis. The fitness should be a quantitative measure (i.e. structure, environmental, wind, etc). IDEA is designed to provide diversity as a second qualitative measure. The variables and constraints allow a form to be represented in the system. For example, to represent a box one would provide IDEA with 3 variables. These variables would represent the height, width, and depth of the box. Constraints would set the minimum and maximum allowed values. For the example, the variables may be limited to between 1-2 feet to guarantee a box can contain specific contents and still be handles by a person. In general, the Setup phase defines and limits in terms of scope, output, and implementation. The Setup phase can require significant time and resources, but once complete can be reused and tweaked to suit additional design problems.
3.2 Interaction
The Interaction phase seeks the designer to help define diversity. The designer clusters design options based on perceived similarity. Sets of design options are created by IDEA and are evaluated visually by the designer. The design options are selected such that the extrema of their ranges is presented to the designer. The number of design options generated depends on the complexity of the problem. Higher dimensional problems require more sampling to characterize the space. Therefore, the more variables there are, the more design options
IDEA needs to present to the designer. For the experiment conducted with this research, a 10 dimensional
problem was chosen. The values for each variable were selected to maximize the range of each variable. Design options were created by randomly generating values that were either in near the maximum, minimum, or mean of each variable's range. The number of maximum, minimum and mean values were made to be as equal as possible. For example, if 100 design options were generated for each variable, 33 would be near the maximum, 33 would be the minimum and the remainder would be the the mean value for each variable. In the future, a more mathematically-based method called "Experimental Design" could replace this current
ad hoc method.
The design options are grouped into overlapping sets to mitigate overwhelming the designer. By dividing the design options into smaller groups, the designer can make quicker decision with less fatigue. Two studies
were conducted using a 10 dimensional parametric building model to test the number of building forms designers were comfortable sorting. One study presented the designer with 4 sets of 25 buildings. A total of
100 building forms were sorted into clusters, which took the designers 45 minutes on average to complete.
The second study presented the designer with 6 sets of 16 buildings for a total of 96 evaluation. The designers completed the sorting in an average of 15-25 minutes. Also, the participants reported significant fatigue in the first study compared to no reports of fatigue in the second study. In general, by presenting small subsets to the designer, they are able to quickly and efficiently cluster buildings based on similarity. These results are specific to the experiment conducted as part of this research, and may vary based on the complexity of the design options.
These smaller subsets need to be consolidated to provide an accurate relationship between all of the design options clustered. To do this, each set contains a mix of unique and repeated design options. Repeated design options are shown in more than one set and act as cross reference points to help build an accurate model of the designer's clusters. Each set created is presented to the designer to sort into clusters based on similarity.
By using the intelligence of the designer (the ability to evaluate and discriminate between various forms)
IDEA is able to determine which variables act as bases of diversity. For example, a problem may use the variables floor thickness, building height, and building width. Even though the width and height play a role in the visual appearance of the building, floor thickness would not. In this example, the designer's clustering decisions would be primarily based on width and height, not floor thickness. This information would be used by IDEAto focus the diversity objective on building forms with varying width and height while the floor thickness variable would be free to move toward an optimal value. Where as, in other machine learning algorithms all of the variables would be considered equal.
3.3 User Emulation
The Designer Emulation phase bridges the gap between designer's clusters generated in the Interaction phase and how that information can be used in the Optimization phase. The designer's clusters are used to customize a clustering algorithm that operates on the variables of designs in a PSO population. The designer's clusters are analyzed to determine which variables have the largest effect on the change to impact on diversity. This is done in two steps: consensus clustering and the automated clustering algorithm (ACA) showed in Figure 7 as subsets of Designer Emulation. Consensus clustering and ACA are bundled into one phase because they represent a process of translating the designer's concepts of diversity into a quantitative metric that can be used in an optimization routine. The first step, consensus clustering, rebuilds the designer's clusters using the overlapping design options. The consensus clusters are then used in second step, ACA, which creates a relationship between the variables and the consensus clusters.
3.3.1 Consensus Clustering The first step, consensus clustering, creates clusters for the entire set by analyzing the designer's clustering decisions. By focusing on the consistencies and discrepancies between the overlapping subsets, consensus clustering consolidates the decisions made by the designer on the over-lapping subsets. Consensus clustering uses an algorithmic approach known as DISTATIS, derived from the field of Food and Agricultural Science [1]. The software was provided by CSAIL as MIT. The result is a computationally generated set of clusters that best approximates the designer's clusters while accounting for conflicts.
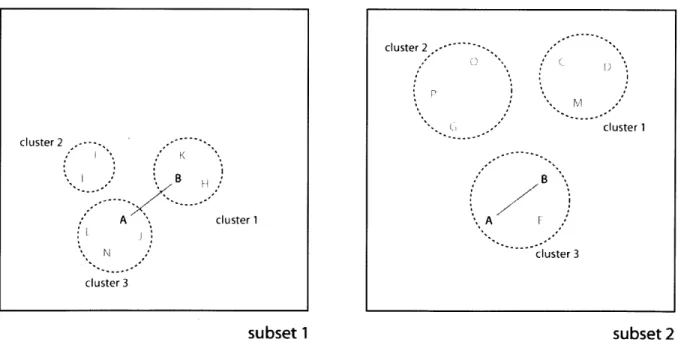
For example, the designer may evaluate two sets that both contain the same two design options, A and B, as shown in Figure 8. The designer may decide A and B are different and cluster them separately as in subset 1. While evaluating subset 2, the designer may decide A and B are similar enough to be clustered together after comparing them to the other design options presented in subset 2. The designer may have decided this because the A and B in subset 1 are shown with design options that are similar to one another, causing A and B to appear more different. Design options A and B in subset 2 may appear more similar due to the diversity of the other design options (i.e. C, D, , 0). Also, these decisions can be extrapolated to create relationships between other design options. For example in Figure 8, the designer clusters A and J together in set 1, then clusters A and E together in set 2. Therefore, consensus clustering can infer a relationship between J and E. Repeating this process on several overlapping subsets allows IDEA to develop relationships between all of the design options.
cluster 2 -M cluster 1 cluster 2 K B B A cluster 1 A cluster 3 cluster 3
subset 1
subset 2
3.3.2 Automated Clustering Algorithm These design options provide a map to understanding the designer's perception of similar designs. But, in order to make this information useful, one more process of distilling the information needs to occur. The second step of Designer Emulation, the automated clustering algorithm (ACA) develops the relationship between the diversity map of the consensus clustering and the design variables. In this step, clusters are developed using a K-means clustering algorithm ( 2.2). K-means takes certain parameters on which its output depends. The goal is to identify those parameters such that when the K-means algorithm is run on the design options, it will generate clusters very highly similar to the designer's.
ACA tries to determine which variables control the visual appearance by adjusting which variables to consider in the k-means clustering algorithm. The objective is to maximize similarity of the generated clusters to consensus clusters. The comparison of similarity is measured using mutual information. Mutual information
measures the mutual dependence of two variables. In IDEA, mutual information is measuring the similarity between the k-means clustering and the consensus clusters developed from the designer. If the mutual information is high, then the variable being considered reflects the dominant factors in the visual appearance of the form.
Once IDEA has determined the variables that have the most effect on the form those variables can be used by IDEA to determine how similar one form in to another. This allows IDEA to evaluate design options for diversity. Since IDEA focuses on diversity as a second objective, a precise representation of the designer's decisions is not as critical, only the variables that cause the form to be different need to be identified.
3.4 Optimization
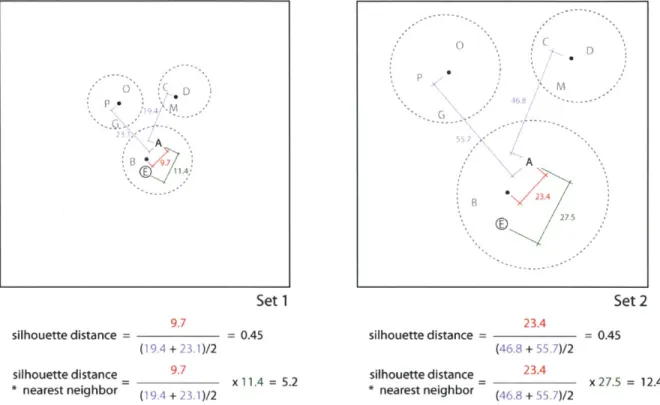
The Optimization phase performs multi-objective optimization using NSPSO for two objectives, the fitness function defined in the Setup phase and the diversity metric. The optimization sends data to the fitness function for evaluation, which returns the performance values to be used in the optimization. The diversity objective is then calculated based on the parameters designated in the Designer Emulation phase. IDEA clusters the design options using ACA. The silhouette distance is then calculated for each design option, which in turn is multiplied by the distance to the nearest neighbor. Silhouette distance is a ratio of how close each design option is to the center of the cluster that it belongs to versus the distance to every other cluster center. Designs that have a large silhouette distance are more diverse, but because silhouette distance is ratio, this difference is relative to the other design options. Distance to the nearest neighbor adds a pressure for designs to maximize spacing within the search space [151. By including the measurement to the nearest neighbor, the ratio is converted to a unit measurement, creating a value that measures the magnitude of the diversity of each design option. For example, two sets of designs can have designs that have the same
silhouette distance, but one may be in a very focused region of the objective space. As shown in Figure 9, the object A has the same silhouette distance in set 1 as it does in set 2. By calculating the nearest neighbor and factoring its distance into the diversity metric, IDEA can avoid design options collapsing into a small region of the objective space.
Set 1 9.7 silhouette distance = = 0.45 (19.4 + 23.1)/2 silhouette distance = 9-7 11.4 = 5.2 * nearest neighbor (19.4 + 23.1)/2 P A B 23.4 27.5 Set 2 23.4 silhouette distance = (46.8 + 55.7)/2 silhouette distance 23.4 * nearest neighbor (46.8 + 55.7)/2 = 0.45 x 27.5 = 12.4
Fig. 9: Comparison of silhouette distance and nearest neighbor methods
3.5 Result Selection
After the Optimizationphase is complete, the last phase provides the designer with a handful of good designs that are different. Since the optimization initially produces hundreds of potential solutions, IDEAsorts and provides a smaller, more diverse set of options to the designer. The optimal design options are re-clustered using the k-means clustering developed in the Designer Emulationphase. Each cluster represents visually different design options. Within each cluster there are two cases that can exist for each design option. Case 1, the design options have a very high fitness value but low diversity, shown in Figure 10 as a 2D search space. Since the results attempt to maximize fitness, crowding occurs. This causes the design options to perform well in fitness, while sacrificing diversity. IDEA selects one of these design options from each cluster as it represents the best fitness and most diversity from other clusters.
* 0 CD
* P"
A
Case 2 represents alternate design options that are diverse and potentially have high fitness (best represented in Figure 10 in the right diagrams as the outliers). These designs, optimal in both diversity and fitness, are shown in Figure 10 in the left diagram in the middle section of the graph. IDEA selects a handful of these designs as well, depending on the total number of clusters. IDEA tries to achieve 10-12 design options to present to the designer. This allows the designer to evaluate maximally diverse design options without feeling overwhelmed with choices.
- Low Diversity High Fitness ow D'versity High Fitness ? DiversityD High Fitness %.. y High Diversity Low Fitness High Diversit y 0 ? Fitness Optimal DiversityHh and Fitnesse +D +F -~~''' Fitness--. F variable A
4 Experiment
IDEA was tested using a hypothetical architectural scenario in which daylighting criteria served as a factor in the design goals. The experiment was used to test the interaction phase and verify that IDEA produces a range of diverse, well-performing design options. The experiment was designed to emulate a real world scenario of a conceptual design problem. The problem was defined as follows:
Develop design ideas for an office tower in an urban context. The office tower needs to take advantage of sunlight on the building surface to provide opportunities for passive and active energy collection system.
First, a contextual model was developed to provide site specific information that would be needed for per-forming sunlight studies for potential design options. Figure 7 shows the context information provided to the designers and used in the experiments. The context model was designed to provide a variety of overshad-owing conditions to make it difficult for a designer to intuitively see the best solution and so that multiple well-performing solutions would be possible.
Ni
Fig. 11: Context model developed for experiments with IDEA
The analysis tool Ecotect provided insolation analysis (solar gain measured in watt hours on the building surface) for evaluating design solutions. Insolation analysis was chosen as the evaluation criteria for several reasons: daylighting criteria is common real world scenario; the evaluation time for each generation requires significant time, making user fatigue a serious issue; and the total time for performing the entire process
would last approximately one day, which would allow a designer to setup IDEA and retrieve the results the next day.
After the problem and objectives were defined, a building form consisting of 10 variables was developed. The form consists of 3 ellipses segmented in 8 straight lines as show in Figure 12A. The first ellipse is placed at the bottom, the second in the middle and the the third at the top of a building, and then lofted to form a
180 meter tall surface that is capped at the top with a flat surface as shown in Figure 12E. The variables
control the X and Y coordinates for the middle and top ellipses as well as the major and minor radii of each ellipse shown in Figure 12B and Figure 12C. The bottom ellipse's center position is fixed at the point shown in the context model in Figure 11). The position coordinates were allowed to move 20 meters in each direction. The major and minor radii of each ellipse could change between 10 and 20 meters.
variables mO MO x1
range (meters) [20,401 [20,40] [-20,20]
minor major x
definition radius, radius, position,
bottom bottom middle
y1 [-20,201 y position, middle ml M1 x2 y2 m2 M2 [20,401 [20,401 [-20,20] [-20,20] [20,401 [20,401
minor major x y minor major radius, radius, position, position, radius, radius, middle middle top top top top
Y2 Y1
K?
A B X2 M2 m2 X1 Ml m1 MO mO C D EFig. 12: Building parameters used in IDEA experiment
In order to use Ecotect as part of the fitness evaluation, a custom tool was developed to create a link between Ecotect and IDEA using dynamic data exchange (DDE). The tool waits for a text file that contains rows of values (one for each variable). It then translates each row into a set of commands that are sent to Ecotect with instructions for opening the context model, creating the building geometry and running the analysis. The building geometry is segmented into triangular surfaces to provide multiple analysis points as shown in
z
Figure 13. The tool then writes the results for each building's performance into a second text file for the optimization program to retrieve.
Fig. 13: Sample building in Ecotect showing insolation analysis coloration
In the experiment a regression model was developed to be used in the optimization phase to save time during development and testing of the algorithm. Each insolation analysis using Ecotect required about 30 seconds to complete. To provide training data for the regression model, insolation analysis was performed on 3,000 test buildings, lasting about 24 hours. This data was used to build the regression model which was then used in place of the Ecotect analysis during the optimization phase. The regression model accomplished two goals: it allowed multiple designers to quickly test IDEA during the experiment and it illustrated how regression modeling can be used in conjunction with IDEA to speed up the process.
Six designers participated using IDEA to develop solution to the problem. Each designer was presented with the following narrative prior to testing:
You are an architect working in an architecture firm on a design team. The principal architect calls a meeting to introduce a new project. During the introduction the principal architect says that they want to take advantage of daylighting in this project. The principal architect asks you to produce a handful of concepts by the end of the week. You will use a new tool, IDEA, to help develop design
ideas quickly. In order to use IDEA you need to describe the similarities and differences in the building forms generated by IDEA.
The 3D modeling program, Rhinoceros, was used as an interface to present the designer with the collections of building forms as well as the context model, and clustering rectangles shown in Figure 14. The designer was asked to place buildings into rectangles based on their similarity. The designer could change the angle of view, navigate around buildings, reposition buildings relative to one another, and evaluate buildings in the context model which forces each building to snap to the correct location. The designer completed the evaluation by placing each building inside the rectangles with other similar buildings. The designer was not allowed to manipulate the building forms (i.e. scaling, skewing, rotating, ect). The building forms were presented to the designer in six sets of 16 for a total of 96 building forms. Only one set was presented to the designers at a time. After the designer completed the sorting of one set, it was removed from view and the next set would become visible. The designers were constrained to using only 9 clusters, though they were allowed to use less. This limited their discrimination between building forms to prevent designers from putting one building in each cluster. Figure 15 and Figure 16 show the results of one designer's clusters.
Fig. 14: Interaction environment presented to designers
After the forms were sorted, the information was passed into the Designer Emulation phase of IDEA where it was used to generate the consensus clusters. Figure 17 show consensus clusters formed based on two designers' clusters. The figures show the building forms in a graph relative to the first and second principal
Fig. 15: Sample of clustering by a designer set 1 set 4 set 2 set 5