Advanced Thermal Insulation for Energy Efficient Buildings:
Structural Performance of Aerogel Composite Panels
by
Thomas Goutierre
Submitted to the Department of Mechanical Engineering
in partial fulfillment of the requirements for the degree of
Master of Science in Mechanical Engineering
at the
MASSACHUSETTS INSTITUTE OF TECHNOLOGY
ARCHIVES
MASSACHUSETTS INSTITUTE OF TECHNOLOGYMAY 18 2011
LIBRARIES
February 2011
@
Massachusetts Institute of Technology 2011. All rights reserved.
A u th or ...
Department of M(hanical Engineering
December 10, 2010
C ertified by ...
Lorna J. Gibson
Matoula S. Salapatas Professor of Material Sciences and Engineering
A ccepted by ...
Thesis Supervisor
David E. Hardt
Chairman, Department Committee on Graduate Theses
Advanced Thermal Insulation for Energy Efficient Buildings: Structural Performance of Aerogel Composite Panels
by
Thomas Goutierre
Submitted to the Department of Mechanical Engineering on December 10, 2010, in partial fulfillment of the
requirements for the degree of Master of Science in Mechanical Engineering
Abstract
Aerogels are well known as exceptional thermal insulators. Thermal conductivities of 9 to 10 mW/m.K have been achieved at atmospheric pressure, and a moderate vacuum (between 1/3 and 1/10 of an atmosphere) can lower this number even further, to around 5 mW/m.K. However aerogels for insulation purposes are not widespread on the market. One of the major shortcomings of aerogels that prevent them from being more widely used is their extreme mechanical weakness and brittleness. In this thesis, we characterize and explain these low mechanical properties. We then propose a composite structure for a rigid aerogel panel, a sandwich panel with a truss core filled with monolithic aerogel. Mechanical and thermal properties are derived and partially tested for the truss cores. Several designs are studied and mechanical properties are derived in order to compare these designs. Some criteria for an efficient designs are given. Finally, we describe a first attempt to manufacture one of these composite structures on a small scale.
Thesis Supervisor: Lorna J. Gibson
Acknowledgments
First of all, I would like to thank my advisor, Professor Lorna Gibson, for her guidance during this work. In particular, I am grateful for her patient and efficient proof-reading of this thesis. I would also like to thank the other members of this project: Professor Leon Glicksman, Professor Taofang Zeng, Professor Gang Chen, Ellann Cohen, Yanjia Zuo and Yi He.
This project was made possible by financial support from the MIT-DuPont alliance.
I would like to thank Mike Tarkanian for its invaluable help for the manufacturing parts of this thesis;
be also thanked Donald Galler, Yong Zhang, Yin-Lin Xie, Alan Schwartzman and Aaron Ramirez.
I am also grateful to Diane Rose and Leslie Regan for their help in this administrative maze that is
MIT.
Thanks to the friends I had during my time at MIT: St6phanie, Charlotte, Jonathan, Dan, CJ, Eric, Nicephore and many others. Thanks also to Anne-Sophie for her patience and to our common friend Skype...
Contents
1 Introduction 17 2 Aerogel 2.1 Introduction 23 .. . . . . . . . . . . . . . . . . . . 232.2 Aerogel structure and characterization... . . . . . . .. 24
2.2.1 Electron Microscopy... . . . .. 24
2.2.2 Adsorption and Penetration Measurements... . . . . . . . . .. 35
2.2.3 Scattering Techniques. . ... . . . . . . .. 43
2.3 Aerogel mechanical properties... . . . . . . . .. 47
2.3.1 Introduction ... . . . . . . . .. 47
2.3.2 Elastic and plastic behaviour of aerogels . . . . 48
2.3.3 Scaling Properties ... . . . . . . .. 56
2.3.4 Strength . . . . 59
2.3.5 Fracture Toughness . . . . 61
2.3.6 Effect of age... . . . . . . . . 63
2.4 Aerogel mechanical properties modeling... . . . .. 64
2.4.1 Introduction... . . . .. 64
2.4.2 Simulating gelation... . . . . . . . . . . .. 65
2.4.3 Static m ethod . . . . 70
2.4.4 Characterizing the models... . . . . . . . . . . .. 74
2.4.5 Simulating the mechanical properties... . . . . . . . . . .. 76
2.5 Commercially available aerogels... . . . . . . .. 80 2.5.1 Raw aerogel and non-insulating applications . .
2.5.2 Aerogels commercialized for high insulation applications.. . . . . .. 2.5.3 Aerogels commercialized for building insulation applications . . . . 2.5.4 Sum m ary . . . .
2.6 Limitations of aerogels for their use in thermal insulation ...
2.6.1 Monolithic aerogel and its potential improvement . . ...
2.6.2 A comparison of monolithic aerogel with common insulation materials .
. 83 . 84 . 85 88 88 89
3 Core structures for composite panels 93
3.1 Introduction... . . . . . . . .. 94
3.2 Review and A nalysis . . . . 95
3.2.1 Honeycombs cores... . . . . . . . 95
3.2.2 Truss cores... . . . . . . .. 98
3.3 Comparison and optimization of the geometry... . . . . . . . . 106
3.4 Manufacturing of the cores... . . . . . . . . .. 115
3.4.1 Choice of the m aterial . . . 115
3.4.2 Injection molding ... . . . . . . . 117
3.4.3 W aterjet cutting . . . 118
3.5 Mechanical testing and comparison with the analysis... . . . . .. 122
3.5.1 Mechanical properties of the polystyrene and relative density of the cores . . . 122
3.5.2 Compression tests of the injection molded specimens... . . . . . .. 125
3.5.3 Shear tests of the injection molded specimens . . . 128
3.5.4 Compression tests of the waterjet cut specimens... . .. 130
3.6 Conclusion... . . . . . . .. 138
4 Design concepts for composite panels 4.1 Introduction... . . . . ... 4.2 Design choices . . . . 4.2.1 Dimensions . . . ... 4.2.2 Core... . . . . 4.2.3 Faces... . . ... 4.2.4 Summary . . . . 4.3 Calculations... . . . . . 139 . . . . . . . . 139 . . . 13 9 . . . . . . . . . 139 . . . . . . . . 14 0 . . . ... . . . ... . 14 1 . . . 14 1 . . . . . . . . . 143
4.3.1 Material Properties . . . . . ...
4.3.2 Determination of the cores densities and panels weights 4.3.3 Thermal properties... . . . . . 4.3.4 Mechanical properties 4.3.5 Conclusions . . . . 4.4 Demonstration ... 4.4.1 Experiment . . . . 4.4.2 Results . . . . 4.4.3 Discussion . ... 4.5 Alternate designs ...
5 Conclusion and future research
5.1 Summary of the work . . . .
5.2 Future research . . . . . . . . . 1 6 8 Bibliography 143 144 145 149 160 161 161 162 165 166 167 167 169
List of Figures
1-1 Thermal conductivities of common insulation materials, from (Cohen, 2011). VIP = Vac-uum Insulation Panel... . . . . . ... 19
1-2 A block of silica aerogel, from www.aerogel.org... . ... 20
2-1 SEM photographs of silica aerogels (Roy and Hossain, 2008)... . . ... 25
2-2 Scanning electron micrographs from (Vacher et al., 1991) for p = 0.23g/cm3. The left side shows surfaces with a gold coating, while the right side shows them with the Pt/C coating. 25 2-3 High resolution scanning electron microscopy of silica aerogels (Rigacci et al., 1998).
Spec-imens are made under acidic conditions, samples are uncoated. . . . . 26
2-4 Image obtained with our SEM... . . . . . . . . 27 2-5 Transmission electron micrograph of a silica aerogel (p=0.23 g.cm- 3) (Rousset et al., 1990) 28
2-6 Conventional bright-field images of a silica aerogel obtained by TEM (Stroud et al., 2004) 28 2-7 Image of one of our samples obtained by TEM . . . . 29 2-8 Image of one of our samples obtained by TEM . . . . 29 2-9 AFM data of the fracture surface of aerogel with a density of 0.20 g.cm- 3. The facing
black and white arrows indicate the typical size of the aggregate of clusters, the facing white ones that of the clusters, as deduced from the AFM measurements (Marliere et al.,
2001).. .. ... ... . ... . 30
2-10 SEM photographs of silica aerogels prepared using (a) acidic (HCl) and (b) basic (NH40H)
2-11 Aerogel structure of (a) base-catalysed aerogel and (b) acid-catalysed aerogels (Bourret,
1988). The scales are the same. The material contained in the chains of the base-catalysed
aerogel appears to be homogeneous, while the material contained in the chains of the acid-catalysed aerogel is not homogeneous and supposed to be a 3D network of polymer-like ch ain s . . . . 34 2-12 Sketch of the aerogel structure deduced from electron microscopy, with larger scale
aggre-gates (Rousset et al., 1990) . . . . 34
2-13 Different levels of organization in acid-catalysed aerogels, from (Bourret, 1988) . . . . 35 V
2-14 Volumetric contraction, V, and change in pore radius r[Ii, of gel with bulk modulus KO = 2 MPa and m = 3 (as in equation 2.1), as function of initial pore radius r(0)
when measured by mercury porosimetry (MIP), thermoporometry using water (TPM), or nitrogen adsorption/desorption (NAD), from (Scherer, 1998)... . . . . . . . . . 36 2-15 Pore size distribution by mercury porosimetry after correction, from (Ali6 et al., 2001) . . 38 2-16 PSD obtained by N2 adsorption for four different types of aerogels (Jarzebski et al., 1995) 40 2-17 "As measured" and corrected datas from N2 adsorption (Reichenauer and Scherer, 2001).
The shaded area marks the average chord length in the pore phase as derived from SAXS. 41
2-18 Cumulated porous volume against the pore radius obtained from thermoporometry
(Rous-set et al., 1990) ... ... .... .. ... . .. 42 2-19 Representation of a scattering experiment, from (Emmerling and Fricke, 1992). Due to
inhomogeneities of the sample, part of the monochromatic collimated beam of photons (or neutrons) is scattered. The angular distribution of scattered intensity is recorded either sequentially with a point-like detector (as drawn), or in parallel using a position-sensitive detector system . . . . . 44 2-20 Typical small angle scattering intensity of a particle network such as aerogel, from
(Em-m erling and Fricke, 1992) . . . . 45 2-21 USAXS normalized intensity as a function of wave vector (Marlire et al., 2001). The left
part with the transition at Q has been specifically revealed by USAXS. . . . . 46 2-22 Bending test of one our samples with linear fit. We calculate E=0.62 MPa . . . . 48
2-23 Bending test of one our aerogels up to failure; the behavior remains linear until failure (at 31 kPa, 5%)... . . . . . . . . . . . . . ... 49
2-24 Stress versus strain curve showing reversible deformation of an aerogel under uniaxial com pression (Alaoui et al., 2008) . . . . 49
2-25 Stress versus strain curve showing irreversible deformation of an aerogel under uniaxial
com pression (Alaoui et al., 2008) . . . . 50 2-26 One of our samples in uniaxial compression up to failure and the unloading of the partially
broken sam ple . . . . 50 2-27 Mercury porosimetry curve, volume versus pressure, of af an aerogel sample crushed by
mercury porosimetry (Pirard et al., 1995)... . . . . . . . . 52 2-28 Schematic view of the three models considered for the volume variation of a network of
cubic pores such as aerogel, by (Pirard et al., 1995) . . . . 53 2-29 Size of the largest pore Lmax versus compaction pressure P due to mercury: (D)
experi-mental point, (-) regression line, ( - ) collapse law, (- - - - - -) axial crushing law and (- -- - - ..) Washburn's intrusion law. Note that the regression curve is superimposed on the collapse law (Pirard et al., 1995) . . . . 53 2-30 Indentation on the lateral surface of cylindrical rods... . ... 55 2-31 Data for the Young modulus against the density (log-log plot) obtained in (Alaoui et al.,
2008; Woignier et al., 2000; Pierre and Pajonk, 2002; Scherer et al., 1995a; Scherer, 1997)
for silica aerogels and some denser silica compounds . . . . 57 2-32 Power law fit for the whole set of data. We find an overall exponent of 3.2 . . . . 57 2-33 Data for the strength against the density obtained in (Woignier et al., 1998; Alaoui et al.,
2008; Woignier and Phalippou, 1988)... . . . . . . . . 59
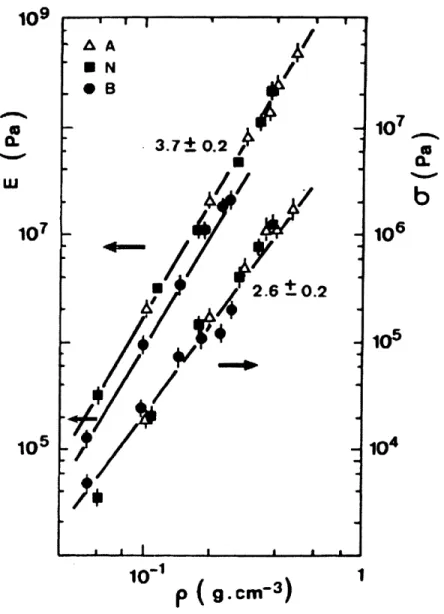
2-34 Combined plot of Young modulus and flexural strength for three sets of aerogels, acid (A), neutral (N) and basic (B) (Woignier et al., 1998) . . . . 60 2-35 Evolution of the mechanical properties as a function of the bulk density for a set of of
neutral-catalysed (N) and base-catalysed (B) aerogels (Woignier et al., 2000).. . ... 62 2-36 Evolution of critical flaw size (ac) and larger pore size (L.P.S.) as function of the density
(Woignier et al., 2000) ... . . . . . . . . . 62 2-37 Comparison of stress-strain curves for freshly machined specimens and specimens aged in
2-38 DLCA algorithm in two dimensions (Kolb et al., 1983). The three situations correspond
to Nc = 86, 8 and 1 cluster, respectively. The system has a size L = 128 and initially No
= 1024 particles. Note the chainlike appearance and the few branchings of the clusters. 65
2-39 Sketch of the hierarchical model (Botet et al., 1984)... . ... 66
2-40 (a) Three-dimensional aggregate containing 4096 spherical particles without restructuring. (b) Same as (a) but with complete restructuring. (Hasmy et al., 1993)... . ... 67
2-41 Results with a flexible model for different probabilities of formation of bonds. Only a thin slab of the structure is shown, with particle shaded by depth (Gelb, 2007). . . . . 69
2-42 Diagram of the cluster model algorithm (Morales-Fl6rez et al., 2008) . . . ... 70
2-43 Aggregates with 2 and 3 shells . . . . 71
2-44 Two examples of cluster models with 3 shells of randomly-packed spheres and 2 hierarchical levels (top) and with 2 shells and 3 hierarchical levels (bottom), by Morales-Fl6rez et al. (Morales-Fl6rez et al., 2005)... . . ... 72
2-45 SEM micrograph of one of our aerogels... . . . . . ... 73
2-46 Comparison of the scattering curves for aerogels of constant density p = 0.10g/cm3 (but with different particle size) and the simulated curve in the diffusion-limited case (DLCA m odel) (Hasm y et al., 1993) . . . . 74
2-47 Schematic illustration of the 2-dimensional triangulation method applied to the pore space (Morales-Fl6rez et al., 2008)... . . . . . ... 75
2-48 Comparison of two PSD calculation methods (Monte-Carlo integration and triangulation) on the static model of Morales-Fl6rez et al. (Morales-Fl6rez et al., 2008) . . . . 75
2-49 Scaling relationship of bulk modulus with relative density of DLCA models by the finite element analysis for DLCA models (original and perfectly connected) (Ma et al., 2000) . . 77
2-50 Cumulative distribution of strain energy in a bond (Ma et al., 2001)... . . . . ... 79
2-51 Granular aerogel (100 cm3 container) -United Nuclear . . . . 81
2-52 TAASI Aerogel Products . . . . 82
2-53 Panel with aerogel core -Glacier Bay . . . . 83
2-54 Aspen Aerogel"Spaceloft... . . . . . . . . 84
2-55 Cabot products: Nanogel@ particles (left) and Thermal WrapT (right)... . ... 85
3-1 Drawing of the suggested structure of an aerogel insulation panel... . . . .. 94
3-2 Honeycomb structure, from Gibson and Ashby (Gibson and Ashby, 1997) . . . . 96 3-3 Honeycomb cell, from Gibson and Ashby (Gibson and Ashby, 1997)... . . . . . .. 96
3-4 Double-wall honeycomb, from Gibson and Ashby (Gibson and Ashby, 1997). The inclined walls have thickness t while the vertical walls have thickness 2t... . . . .. 97 3-5 Geometry of a tetrahedral core panel, from Wicks and Hutchinson (Wicks and Hutchinson,
2001) . . . ... 99
3-6 3D representation of one of the tetrahedron, from Chiras et al. (Chiras et al., 2002) . . . 100 3-7 Beam model for the deformation of a truss core, from Finnegan et al. (Finnegan et al., 2007)103 3-8 Geometry of a pyramidal core panel, from Queheillalt and Wadley (Queheillalt and Wadley,
2005)... ... ... 105
3-9 Graph showing the expected relative thermal conductivity A of different structures as a function of the relative density P . . . . 109
PS
3-10 Graph showing the expected relative Young's modulus f! of different structures for a
given thermal conductivity. The lines end at a relative density of 10% and both Young's modulus and thermal conductivity scale linearly with the density... . . . .. 110 3-11 Graph showing the expected relative shear modulus G' Gs of different structures, assuming
G = 2E, for a given thermal conductivity. The lines end at a relative density of 10% and
both Young's modulus and thermal conductivity scale linearly with the density. . . . 111 3-12 Graph showing the expected relative compressive strength of different structures for a
given thermal conductivity. The thermal conductivity is linearly dependent on the relative density based on the numbers given in Table 3.1. . . . 112 3-13 Graph showing the expected relative compressive strength of different structures for a
given thermal conductivity. The thermal conductivity is linearly dependent on the relative density based on the numbers given in Table 3.1. . . . 113
3-14 Materials chart plotting Young's modulus against thermal conductivity of wood.The dashed lines represent constant E ... .. .... ... .. ... 116 3-15 Materials chart plotting Young's modulus against thermal conductivity of polymers. The
dashed lines represent constant... das ed ine r preentco sta t
j
.. .. . . . .1 . ... 11663-16 A polystyrene truss lattice made by injection molding... . . . .. 118
3-18 Sketch of a unit element of a waterjet cut polystyrene lattice with w = 45'. Length are in
mm. For a sheet 2 mm thick, trusses have thus a square section of 2 mm x 2 mm. . . . . 120
3-19 Truss lattice made by waterjet cutting epoxy-bonded to an aluminum plate... . .. 120
3-20 Tension test specimen for sheet plastic, from ASTM standard D 638 (ASTM International, 2008)... ... ... 123
3-21 Stress-strain curve for an uniaxial tensile test of a polystyrene dogbone... . . .. 124
3-22 A polystyrene truss core between aluminum plates . . . 126
3-23 Results of the compression tests up to failure for two injection molded specimens. . . . 126
3-24 Polystyrene struts after failure for an injection molded core . . . 127
3-25 Results of the compression tests on injection molded specimens. Elastic predictions lines are of the same slope as guides for the eyes. . . . 127
3-26 Picture of a polystyrene truss core between aluminum plates . . . 129
3-27 Stress strain curve of the polystyrene truss core loaded in shear . . . 130
3-28 Geometry of the trusses made by the waterjet cutting technique... . . . . . .. 131
3-29 Set-up for the compression test of the waterjet cut polystyrene core . . . 132
3-30 Stress strain curve of a waterjet cut core 6% dense in uniaxial compression . . . 133
3-31 Buckled polystyrene struts after the compression of a waterjet cut core. . . . . . . . . 133
3-32 Buckled polystyrene strut exhibiting a notch after compression... . . . .. 134
3-33 Calculated and predicted Young's modulus of a waterjet cut core as a function of the relative density in uniaxial compression . . . 134
3-34 Calculated and predicted Young's modulus of a waterjet cut core as a function of the relative density in uniaxial compression for densities lower than 6%.... . . . . . . .. 135
3-35 Calculated and predicted compressive strength of a waterjet cut core as a function of the relative density in uniaxial compression . . . 137
4-1 Geometry of a tetrahedral core panel, from Wicks and Hutchinson (Wicks and Hutchinson, 2001)... . . . . . . . 140
4-2 Thermal diagram for the calculation of the overall thermal resistance of the panel. The truss or honeycomb core has volume fraction <D = i and the aerogel fills the rest of the Ps core with volume fraction 1 - 4< . . . . 146
4-4 The geometry of a rectangular beam sandwich structure (Gibson and Ashby, 1997) . . . . 151
4-5 A sandwich beam loaded in 3-point bending (Gibson and Ashby, 1997) . . . 152
4-6 The two-layer system (Fox, 1948) . . . 156 4-7 Equilateral triangle plate (all edges are simply supported) (Roark and Young, 1975) . . . 159
4-8 A tetrahedral truss core made by 3D-printing... . . . ... 161
4-9 Tetrahedral truss core made by 3D-printing with density (a) 4.24% and (b) 2.40% . . . . 162
4-10 The control core made of pure aerogel . . . 163 4-11 Aerogel embedded in the core 4.24% dense (struts of radius 0.60 mm).. . . . ... 164 4-12 Aerogel embedded in the core 2.40% dense (struts of radius 0.45 mm).. . . . ... 164 4-13 Photograph of the octet-truss lattice material, here made from a casting aluminium alloy
List of Tables
2.1 Comparison between p(D) and et, (Emmerling and Fricke, 1997) . . . ... 58
2.2 detailed properties for aerogel commercialized with no insulating purposes... . . ... 86
2.3 detailed properties of aerogel commercialized for insulating applications. . . . ... 87
2.4 Densities of common insulating materials... . . . . . . ... 89
2.5 Young's modulus of common insulating materials . . . . 90
2.6 Flexural strength of common insulating materials... .... . . . . ... 90
2.7 Compressive strength of common insulating materials.. . . . . . . . . 90
3.1 Summary of the analysis of elastic and thermal properties for honeycombs and truss cores 107 3.2 Summary of the analysis of different failure mode for honeycombs and truss cores . . . 108
3.3 Median properties of polystyrene (Granta Design Limited, 1999)... . . . .. . 114
3.4 Comparison of polystyrene structures each 3% dense . . . 114
3.5 Comparison of polystyrene structures having each a thermal conductivity of 2 mW/m.K . 114 3.6 Comparison of polymers with high f ratios. ... . ... 115
3.7 Design chosen for waterjet cut cores. Parameter names are the same as in Figure 3-28. Values are given in m m . . . . 131
3.8 Length
I
(in mm) of the struts for the chosen densities . . . 1314.1 Designs considered for an aerogel rigid insulation panel... . . . . . ... 142
4.2 Median properties of the materials used in this study (Granta Design Limited, 1999) . . . 143
4.3 Weight of a single panel for each design. Each design number is described on Table 4.1 . 145 4.4 Global thermal conductivity and thermal resistance per inch of each design for an aerogel thermal conductivity A=10 mW/m.K . . . 146
4.6 Young's modulus in compression of each of the cores . . . 150
4.7 Mechanical compressive strength of each of the cores . . . 150
4.8 Strain in the panel core under the load of a stack of panels 2 meter high... . . .. 151
4.9 Shear modulus of each of the cores . . . 152
4.10 Beam compliance under three-point bend with uniformly distributed load . . . 153
4.11 Beam compliance under three-point bend with uniformly distributed load of a panel with pure aerogel core . . . 153
4.12 Shear strain in the core under three-point bend with a uniformly distributed load of 100 N, in % ... .. ... ... ... . . . .. . . . 154
4.13 Mechanical compressive strength of each of the cores . . . 155
4.14 Shear stress in the core under three-point bend with a uniformly distributed load of 100 N, in % of the shear strength of the core . . . 155
4.15 ozz just under the interface as a percentage of the applied stress for a=1 cm and resulting strain for various loads for a panel with pure aerogel core . . . 157
4.16 Maximum displacement of a polystyrene triangular plate and corresponding strain in the core under a concentrated load of W=50 N... . . . .. 159
4.17 Maximum displacement of a polystyrene triangular plate and corresponding strain in the core under a uniformly distributed load of W=50 N... . .. 159
Chapter 1
Introduction
A major element in meeting projected reductions in the nation's and the world's energy consumption and CO2 generation is based on improved energy efficiency in the consumption sector. Buildings comprise
the largest single sector, consuming approximately 40% of US primary energy (in 2006, 20.9% for the commercial sector and 18.0% for the commercial sector -the industrial sector is not included) and 70% of the US electricity (U.S. Energy Information Administration, 2008). In 2006, in the U.S., space heating and space cooling represented 49.9% of the total energy delivered to a residential building. For commercial buildings, heating and cooling represented 18.8%. Overall, space heating and cooling of residential and commercial buildings (not including heating and cooling of industrial buildings and transportation vehicles) accounts for 11.1 % of the total energy consumption in the United States. In Europe, where the residential sector accounted for 26.6% of the final energy consumption in 2005, heating represents still a higher component of the consumption: up to 67% in the group "EU-15", the members of the European Union before 2004 (European Environment Agency, 2008).
A number of organizations have established ambitious goals for the efficiency levels of future buildings.
For example, the American Institute of Architects (AIA) and a number of other American organizations have a goal of achieving, by the year 2015, a minimum 70% reduction from the average regional (or country) level of consumption of fossil fuels used to construct and operate new and renovated buildings. They also would promote further reductions of remaining fossil-fuel consumption by 10 percentage points or more every five years after 2015, leading to carbon neutral buildings in 2030. This is known as the Architecture 2030 challenge. In the European Union, the Energy Efficiency Action Plans aims at a reduction of primary energy consumption as of 2005 by 20% by 2020 and assumes a potential for savings
in the household sector up to 25%, a large part being achieved by energy efficiency improvements reducing the heating energy used (European Environment Agency, 2008).
To reduce the overall energy consumption in the building sector requires a substantial reduction in energy consumption in existing buildings. The United States only builds 1 to 2 million new residential units in a normal year and has upwards of 100 million exiting units. Thus efficient retrofits of existing homes and commercial buildings will play a major role in the next few decades. The combination of space heating and cooling constitutes the largest energy use in residential and commercial buildings. The heating and cooling energy demand is directly related to the level of insulation in the exterior envelope of a building: primarily the performance of the walls and windows.
Many existing buildings have inadequate levels of installation in their external walls. Current methods of retrofit involve costly reconstruction or layering over the current exterior and/or infill of insulation in wall cavities. In northern climates this technique adds an additional hazard of moisture damage since the exterior addition adds another moisture barrier on the wrong side of the wall near the cold surface where condensation can occur. Conventional insulations can achieve up to an R value of 6 or 7 (imperial units) in a one inch thickness (ie a thermal conductivity of 20 to 24 mW/m.K) but they are subject to degradation in R value over time due to diffusion of low conductivity gas out of the insulation. Figure 1-1 shows values for common insulation materials. Several manufacturers have developed and test-marketed vacuum panels. However, the current designs are expensive and are made up of large vacuum elements so that the entire panel loses its superior insulation performance if the protective coating suffers a single puncture.
Aerogels are sol-gel derived solid materials with porosities from about 80% to 99.8%. The high porosity is achieved via supercritical drying or freeze drying of an alcogel or a hydrogel. Aerogels were first made by S. S. Kistler (Kistler, 1931) in the early thirties. An aerogel block is shown on Figure 1-2. Aerogels, and particularly silica aerogels, have been rapidly identified as excellent thermal insulators, with conductivity between 9 and 17 mW/m.K at atmospheric pressure. Existing literature also shows that that the thermal conductivity can even be reduced to between 4 and 8 mW/m.K when evacuated, and even with only a moderate vacuum, a fraction of an atmosphere, between 1/3 and 1/10 (Lee et al.,
1995). Other potential improvements to aerogel thermal conductivity include reducing thermal radiation
in the aerogel.
Common Insulation Thermal Conductivities (mW/m K)
10.0 Cellulose 20.0 30.0Expanded Polystyrene
40.0 50.0-1
(6(A o0 0 -j a Fiber glass Rock Wool.L Closed Cell Phenolic
E M Open Cell Phenolic
u. Polyisocynaurate
Expanded Polystyrene (EPS) Extruded Polystyrene (XPS)
0 Polyurethane Foam
Polyisocyanurate Board - Foil faced
Polysocynurate Board -Unfaced
Phenolic Foam
Aspen Aerogel Blanket Cabot Nanogel Granules
Cabot Thermal Wrap Blanket Glacier Bay Ultra-R w/ Aerogel Core
Acutemp
Figure 1-1: Thermal conductivities of common insulation materials, from (Cohen, 2011). VIP
Figure 1-2: A block of silica aerogel, from www.aerogel.org
that has a substantial R value, for example R-10 (imperial units) in a half inch thickness or less, that is a thermal conductivity of 7 mW/m.K. The thin panel would allow retrofits over interior wall surfaces without a major impact on interior building geometry and smoother joints with windows. The proposed insulation would be twice as good as aerogel insulations at room temperature and pressure.
Despite its well known potential as a thermal insulator, aerogel has never been widely used for that purpose. It seems that there are two main reasons for that: one being that its manufacturing is complicated and expensive, and the other is that its mechanical properties are low, preventing one to fully use its potential.
The mechanical properties of aerogels are indeed low: for a typical 5% dense silica aerogel, Young's moduli are between 1-10 MPa, compressive strengths are about 0.5 MPa and tensile strengths are on the order of 0.01 MPa. These properties can be related to the porous structure of aerogels, which resembles that of foams, although they generally have a much more disconnected microstructure. Although the insulation panels do not carry structural loads in use and presumably would be adhered to a solid panel in retrofitting applications, they must be able to withstand loads associated with fabrication, transportation and installation.
This work focuses on proposing a design for an insulation panel that could achieve a very high thermal resistance while being sufficiently strong to be practical.
This thesis is part of a project funded by the MIT-DuPont Alliance. The project is led by Professor Leon Glicksman, an expert on heat transfer and building technology. Co-PIs for the project are Professor Gang Chen, an expert in thermal conductivity characterization and nanoscale heat transfer, Professor Lorna Gibson (advisor for this thesis), an expert in mechanical properties of porous media, and visiting assistant professor Taofang Zeng, an expert in aerogel synthesis. Three other graduate students have also been working on this project: Ellann Cohen on measuring the thermal properties of aerogels and Yanjia Zuo and Yi He on the synthesis and characterization of aerogels.
This thesis is organized in three main chapters.
The next chapter is a review of different aspects of aerogels relevant to our study: their microstruc-ture, their mechanical properties, their commercial availability. It concludes that monolithic aerogel (as opposed to granulates in diverse forms) are required to achieve superior insulation properties, but that monolithic aerogel cannot be strengthened sufficiently by modifying the chemistry. That is why we
propose to study a composite structure with macroscopic elements to support the mechanical loads. The third chapter focuses on analyzing structures that could act as a structural skeleton of a panel filled with aerogel, honeycombs and truss cores. We carry a theoretical analysis of those cores as a function of their geometry and their relative density. Then we test that the mechanical behavior of polystyrene truss cores fits the analysis.
The fourth chapter derives properties for several proposed panel designs and gives criteria for an efficient design. The last part of this chapter is a first try at the implementation of a composite panel with a truss core and a solid aerogel filling.
Chapter 2
Aerogel
2.1
Introduction
In this chapter, we first review the microstructure and mechanical properties of aerogels.. This review is mainly based on the literature but also on some characterizations made during this study. We then give an overview of commercially available aerogels. In the last section, we will see how an aerogel product could meet the specifications of the project and, based on a comparison with other insulating materials, we will see that this goal cannot be achieved by monolithic aerogel alone.
2.2
Aerogel structure and characterization
Generally, three basic techniques can be used to reveal structural features of aerogels (Fricke and Emmer-ling, 1992): direct methods (electron microscopy), adsorption or penetration measurements and indirect measurements (scattering techniques). Here we are applying these characterization methods to the case of silica aerogel, but they could be used for any kind of aerogel.
2.2.1
Electron Microscopy
Electron microscopy yields a direct image of the structure. Morphological features such as particle shapes, particle arrangements can be recognized. Two different techniques can give complementary information:
SEM (Scanning Electron Microscopy) and TEM (Transmission Electron Microscopy). Both qualitative
and quantitative information can be deduced from microscopy.
SEM
SEM images the sample surface by scanning it with a high-energy beam of electrons in a raster scan
pattern. The detection of secondary electrons or back-scattered electrons contains information on the sample surface topography.
SEM imaging of aerogels (see Figure 2-1) is commonly performed for structural investigation (Rousset
et al., 1990; Dumas et al., 1990; Vacher et al., 1991; Bouaziz et al., 1992; Pajonk et al., 1996; Rigacci et al., 1998; Martin et al., 2001; Kucheyev et al., 2007).
For basic SEM imaging, the sample has to be coated with a conductor to get a good resolution. Otherwise, electrons from the electron beam accumulate in the sample and have an effect on the imaging (charging artefacts) which limit the magnification one can achieve. The coating consists in vaporizing a conductive material on the sample at low pressure (typically 1 Pa), so that the sample is coated by a thin layer of conductor, typically 10-20 nm (Vacher et al., 1991).
The most common coating material is gold (Rousset et al., 1990; Dumas et al., 1990; Bouaziz et al.,
1992). Another study (Pajonk et al., 1996) uses gold containing 20% palladium. Osmium impregnation
followed by Pt coating is also reported. Vacher et al. (Vacher et al., 1991) report that Au coating produces artefacts that are not related to the actual structure of aerogels, namely a peculiar grainy appearance. They affirm that gold is well known, particularly among biologists, to limit the resolution of SEM pictures significantly, as it tends to clump. On the other hand, Pt/C coatings are known to give
w
Figure 2-1: SEM photographs of silica aerogels (Roy and Hossain, 2008)
generally excellent results for fragile samples. In Figure 2-2, on the left, one see "grains". The grains show a microstructure at a scale of the order of 10nm typical for gold crystallization. The grains are well separated, giving the visual impression of a large inter-grain porosity (the dark areas between the grains). On the right of Figure 2-2, by contrast, one notes that the structure becomes finer as the density is decreased. Clearly the Pt/C coating preserves part of the fractal structure of the lightest sample. It does not have the mobility of gold, and thus forms neither the fine microstructure nor the large clumps that appear on the left-hand side. The latter might result from local damage produced by capillary forces. One does not gain the impression that the materials are "large scale aggregates of grains" as is the case for images with gold.
0.23
200nm
200nm
Figure 2-2: Scanning electron micrographs from (Vacher et al., 1991) for p 0.23g/cm3. The left side
Figure 2-3: High resolution scanning electron microscopy of silica aerogels (Rigacci et al., 1998). Speci-mens are made under acidic conditions, samples are uncoated.
The coating process is far from trivial for a tenuous material, and it can have dramatic effects on fragile structures. An alternative approach is to use uncoated samples. This affects the resolution due to the charging effects in conventional SEM. The charging effects can be decreased using a low-vacuum mode available on certain SEM (Kucheyev et al., 2007), the electrons leaving the sample thanks to the ions in the surrounding gas. However, very good resolution has never been achieved by these means. Progress in techniques, such as high-resolution SEM with a field-emission, give reasonably good images on uncoated samples, as seen on Figure 2-3 (Rigacci et al., 1998).
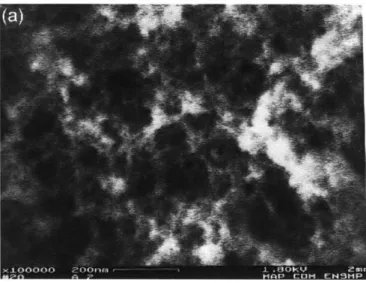
We performed imaging with a thin gold coating on a LEO VP438 (LEO Elektronenmikroskopie, Oberkochen, Germany), see Figure 2-4. Although the resolution achieved was relatively low, one can see the aggregate of particles reported in other studies.
Yr
Figure 2-4: Image obtained with our SEM
TEM
TEM is a microscopy technique whereby a beam of electrons is transmitted through an ultra thin speci-men, interacting with the specimen as it passes through. An image is formed from the interaction of the electrons transmitted through the specimen.
TEM gives higher resolution than SEM of approximately one order of magnitude.
TEM studies of aerogels have been performed (Rousset et al., 1990; Bourret, 1988; Ruben et al.,
1995; Stroud et al., 2004). Due to the brittleness of aerogels, preparation of thin monolithic samples is
impossible. Therefore, one has to grind the aerogel into a powder and then disperse the powder on a carbon support film. Often a solvent, e.g., acetone, ethanol, hexane, etc., is used to prevent aggregation of the powder on the support film, providing a more uniform distribution of particles. The use of a solvent is not strictly necessary, and in some cases leads to alteration of the aerogel structure. It is best to use dry grinding when feasible and to test several solvents if one is required. Typical images are shown on
Figures 2-5 - 2-8.
Images on Figures 2-7 and 2-8 were made in this study using a TEM JEOL 200CX (Jeol Ltd., Tokyo, Japan). The aerogel was ground in a mortar and then put in ethanol before being dispersed on a copper
grid.
100 nm
Figure 2-5: Transmission electron micrograph of a silica aerogel (p=0.23 g.cm 3) (Rousset et al., 1990)
Figure 2-6: Conventional bright-field images of a silica aerogel obtained by TEM (Stroud et al., 2004)
Stereopairs can be taken to study the 3D arrangement (Bourret, 1988). A tilt angle of ±50 is usually sufficient. Stereopairs can be examined on a stereoscope with a moving luminous spot which allows measurement of height differences. One can then identify the number of chains at crossing points.
Ruben et al. (Ruben et al., 1995) performed vertical replication of a fracture surface with a thin layer of platinum and carbon, which produces informative images, avoiding dispersing the sample in a solvent. However, the procedure is tedious and expensive.
110509-02.t It
Cal: 1.51pixm 100 N 100 nm 12:16 11/0/309 HV=200.GkV
TBM Mode: reaging Direc Nag; 27000x
F 2 g amler Syta b
Figure 2-7: Image of one of our samples obtained by TEM
AW LU t,111
Figure 2-8: Image of one of our samples obtained by TEM I.
Atomic Force Microscopy
Atomic Force Microscope (AFM) has also been used, although not as frequently, to study aerogel struc-ture (Borne et al., 1995; Marliere et al., 2001). The AFM is a high-resolution type of scanning probe microscopy, meaning it forms images of surfaces using a physical probe that scans the specimen, with demonstrated resolution of fractions of a nanometer. An AFM micrograph is shown on Figure 2-9.
-100. 0 rwe
3W
0.
0 n14p 0.20 g.cm
Figure 2-9: AFM data of the fracture surface of aerogel with a density of 0.20 g.cm--. The facing black and white arrows indicate the typical size of the aggregate of clusters, the facing white ones that of the clusters, as deduced from the AFM measurements (Marliere et al., 2001)
Results
Differences between acid-catalysed and basic-catalysed aerogels The structure of aerogel ap-pears to be strongly dependent on the catalyst used during the condensation of the gel.
* Under acidic conditions, the silicic acid monomers condense slowly, which leads to the formation of polymer-like silica chains, resulting in a weakly cross-linked, low density network.
" Under basic conditions the condensation is rapid compared to the hydrolysis. One observes
compar-atively dense, colloidal particles; their final size depends on the temperature and on the pH-value of the solution.
I
Figure 2-10: SEM photographs of silica aerogels prepared using (a) acidic (HCl) and (b) basic (NH40H)
catalysed alcogels (Pajonk et al., 1996)
This distinction can be observed on Figure 2-10. One can see clearly the dense and colloidal particles for base-catalysed aerogel. Note that the aerogels synthesized for this study were condensed under basic conditions.
3D-structure The TEM observations confirm that the structure of base-catalysed aerogels is a 3D network, an open structure of small chains of diameter ao, interconnected at average distances do (Bourret,
1988) (Figure 2-11). The structure is best described by cylindrical chains: however some modulation of
these chains is sometimes visible which could be reminiscent of initially spheroidal particles in the wet stage. At connecting points the number of departing branches is either three or four. Inside the chain the contrast is typical of a homogeneous amorphous medium. No sign of crystallinity is present and the material contained in each individual chain of the 3D-network is homogeneous down to a level of 5 to 8
A
(lowest resolution obtained).The structure of acid-catalysed gels is more compact even at a very small scale. The chain diameters are smaller, ~ 30
A,
and the network is much tighter. Moreover, the surface of each element is wavy and rough down to the resolution limit (- 5A).
In particular it is not possible to find any element even at the highest resolution level where the matter is homogeneously distributed. However, chains of denser material are still visible although the acid-catalysed gel structure is not always constant throughout the specimen. Some polydispersity is present and chains are sometimes better described as aggregates of small blocks or spheres (this is reflected in a smaller 4 ratio as compared to the base catalysed gels). Bourret (Bourret, 1988) postulated that at the atomic resolution level, polymer chains, (SiO2)n molecules, are thebasic material forming a 3D network. At the lowest hierarchy level the diameter of this chain is therefore defined by twice the average ionic radius of oxygen and silicon and postulated to be of the order of 2.8
.
As we said earlier, ao and do depend greatly on the catalysis method.
It is observed that this 3D network forms aggregates (clusters, "blobs") whose size has an order of magnitude of 100 nm (typical results from SEM imaging), which could be interpreted as a higher level network, although it is much more difficult to characterize (see Figure 2-12). Again, the size of this bigger
catalysis pH ao do ao
basic 40
A
130A
3.15structural feature depends on the catalysis. Bourret reports the size of the aggregates is 25 nm for acidic catalysed aerogels and 75 nm for basic catalysed ones. However, the voids are much more difficult to characterize, and no study gave a good description of porosity at that level.
Fractal Geometry Direct observation reveals aerogels to be self-similar (fractal) materials, although
historically the fractal character of aerogels has been first brought to light by scattering experiments (see subsection 4).
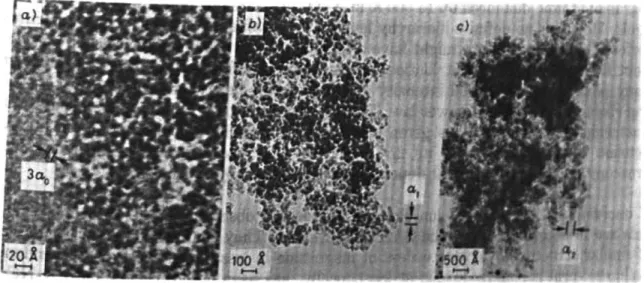
Bourret (Bourret, 1988) reports in his TEM study different levels of self-similarity in aerogels. These can be observed over two orders of magnitude in the case of acid catalysed gels (roughly three similar levels), slightly less in the case of basic catalysed gels (two similar levels), see Figure 2-13.
A j~~#t
2
14
Figure 2-11: Aerogel structure of (a) base-catalysed aerogel and (b) acid-catalysed aerogels (Bourret,
1988). The scales are the same. The material contained in the chains of the base-catalysed aerogel
appears to be homogeneous, while the material contained in the chains of the acid-catalysed aerogel is not homogeneous and supposed to be a 3D network of polymer-like chains
*- 27 nm '
Figure 2-12: Sketch of the aerogel structure deduced from electron microscopy, with larger scale aggregates (Rousset et al., 1990)
Figure 2-13: Different levels of organization in acid-catalysed aerogels, from (Bourret, 1988)
2.2.2
Adsorption and Penetration Measurements
The porosity <b of an aerogel is derived with the formula <D = 1 - -, where p is the density of the aerogel
and ps the density of the material it is made of (ps=2.6 g.cm-3 in the case of silica). Porosity as high as 99.8% has been reported (Pajonk et al., 1996). Now we want to characterize the shape and the size distribution of these voids.
The common techniques for characterizing porosity are mercury porosimetry, thermoporometry and nitrogen adsoption (Lowell et al., 2004; Scherer, 1998).
However, characterization of the pore size distribution in aerogels is complicated by their extreme compressibility (Scherer, 1998). These techniques apply capillary pressures on the aerogel network that can cause large volumetric compression, leading to false values for the pore volume and pore size. Since the bulk modulus of aerogels is known to exhibit a power-law dependence on density (K oc p'), it is possible in some cases to estimate the magnitude of the compression and then to derive the true distribution. The contraction levels for each methods are sketched on Figure 2-14.
It is necessary to mention that the pores of aerogels are not closed cells but rather spaces between filaments (Ali6 et al., 2001), thus it is hard to identify a "pore size" in such a geometry.
.. . 1I. . .,
10
a-0 0 a-U 01
D
5
10
15
20
25
30
3
rST(O)( nm
)
Figure 2-14: Volumetric contraction, -, and change in pore radius r, of gel with bulk modulus KO =
2 MPa and m = 3 (as in equation 2.1), as function of initial pore radius r(O) when measured by mercury porosimetry (MIP), thermoporometry using water (TPM), or nitrogen adsorption/desorption (NAD), from (Scherer, 1998)
-N
NAD
:3 I I .A I I I I I L I I I h I I I A I I I
-'-.- MIP
Mercury penetration porosimetry
Mercury porosimetry gives information on the structure of mesopores (2-50 nm) and macropores (>50nm).
A material's porosity is characterized by applying various levels of pressure to a sample immersed in
mercury. The pressure required to intrude mercury into the samples' pores is inversely proportional to the size of the pores. As pressure on the filled penetrometer increases, mercury intrudes into the samples' pores, beginning with those pores of largest diameter. The analysis of the distribution of the specific surface area and of the specific pore volume in relation with the pore size from mercury porosimetry data is classically based on Washburn's equation, which can be written in our case
1
D = (-)4-ycos(#)
P
where D is the pore diameter, P is the applied pressure, -y the surface tension of mercury and
#
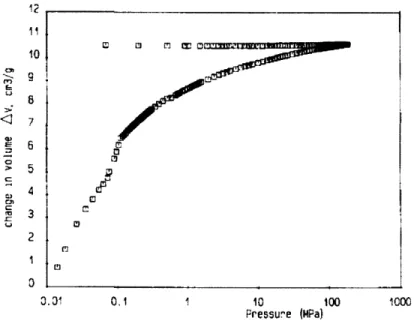
the contact angle between the mercury and the sample. The volume V of mercury penetrating the pores is measured directly as a function of applied pressure. This P-V information serves as a unique characterization of pore structure.Yet, in the case of aerogels, it has been observed experimentally that the structure of aerogels is damaged by the high pressure required to intrude small cells. This can be explained by the small value of the Young modulus and of the ultimate compressive strength of aerogels. Consequently, Washburn's equation cannot be applied to aerogels (Pirard et al., 1995; Scherer et al., 1995b).
It has been suggested that one can estimate the amount of compression that will occur before mercury enters a gel (Pirard et al., 1995; Scherer et al., 1995a). From these estimates a correction can be made and the actual values of the pore sizes can be derived, see Figure 2-15.
The bulk modulus K, defined by dP = -Kivv (P is the pressure applied isostatically and V the
resulting volume), is found to be for an aerogel (Scherer, 1998):
KO if V ; V, where V is a threshold volume depending on the sample (2.1)
Ko(+)m if V ;> V
However, this estimate depends on the model for the elastic modulus, and it cannot be applied is the structure is not only compressed but modified by the compression. Furthermore, the shrinkage is so substantial that it reduces significantly the range of pores that can be explored, limiting greatly its
50 100 150
pore
size
(nm)
200
Figure 2-15: Pore size distribution by mercury porosimetry after correction, from (Ali6 et al., 2001)
Nitrogen Adsorption / Desorption
Capillary condensation isotherms of vapors are widely used for calculations of pore size distributions
(PSD) in nanoporous materials.
The principle of adsorption measurements (Lowell et al., 2004) is to observe the weight W of gas adsorbed in a material as a function of the absolute temperature T, the pressure P, and the interaction potential E between the vapor (adsorbate) and the surface (adsorbent). Usually the quantity adsorbed is measured at constant temperature:
W = F(P, E)
A plot of W versus P, at constant T, is referred to as the sorption isotherm of a particular gas-solid
interface.
The state and thermodynamic stability of pure fluids in mesopores (pores exhibiting diameter from 2 to 50 nm) depends on the interplay between the strength of fluid-wall and fluid-fluid interactions on the one hand, and the effects of confined pore space in the other hand. The most prominent phenomenon observed in mesopores is pore condensation, which represents a first order phase transition from a gas-like state to a liquid-like state of the pore fluid occuring at a pressure P less than the corresponding saturation pressure PO of the bulk fluid, i.e., pore condensation occurs at a chemical potential p less than the value po at gas-liquid coexistence of the bulk fluid. It is thus possible to calculate the pore radius as a function of P and Po.
The basic equation is the Kelvin equation:
P -2yV In( ) = _
-Po rRT
where R is the universal gas constant,
y
is the surface tension of the liquid, V the molar volume of the condensed liquid and r the mean radius of curvature of the meniscus of the pore liquid (equal to the actual radius of the pores in the case of cylindrical pores).To be complete, one has to take in account a multilayer adsorbed at the onset of pore condensation. Then one obtains the modified Kelvin equation ln({) -2V , where t, describes the statistical
thickness prior to condensation. tc can be calculated under geometrical assumptions on the shape of the pores. The standard methods for the PSD calculations, such as the Barrett-Joiner-Halenda (BJH) method (Barrett et al., 1951) are based on a description of the capillary condensation to calculate tc. An
example of PSD obtained by this method is given on Figure 2-16.
0.1
dV/dD
[cm3/g nM]
0.05
Pore diameter [am]
0
0 10 20 30 40 50
Figure 2-16: PSD obtained by N2 adsorption for four different types of aerogels (Jarzebski et al., 1995)
However, this method has been questioned in the case of compliant materials, as the capillary pressures upon sorption can be as large as several MPa and thus large deformations are expected upon analysis. Reichenauer and Scherer (Reichenauer and Scherer, 2001) introduced a technique to correct the isotherms: simultaneous recording of nitrogen sorption data and linear length changes reveals a new type of isotherm. Comparison of dilatation and sorption data shows that the bulk modulus of a compliant material can be calculated from its nitrogen sorption isotherm alone. Using this information together with a model that describes the relationship between macroscopic deformation and changes in pore size and volume, the isotherm can be corrected for the contraction of the sample during analysis. The corresponding pore size distribution is found to be in excellent agreement with results deduced from small angle X-ray scattering (see Figure 2-17).
The nitrogen adsorption/desorption method also gives information about the specific area, using the same equations as those used for pore size characterization. The surface area is derived from the weight of the monolayer of adsorbate. The specific surface area is found to be in the range 200-800 m2
/g,
increasing with the density (Rigacci et al., 1998; Hiising et al., 1998). Only surfaces that are accessible to N2 are2.5
-,
corrected (UC model)
-as
measured
S1.5
E
c0.5
0--0
5
10
15
20
25
R
/nm
Figure 2-17: "As measured" and corrected datas from N2 adsorption (Reichenauer and Scherer, 2001).
Thermoporometry
Thermoporometry has been described by Brun et al.(Brun et al., 1977). A thermodynamic study of the liquid-solid phase transformation in porous materials provides the relationships between the size of the pores in which solidification takes place and the temperature of the triple point of the divided liquid, on the one hand, and between this temperature and the apparent solidification energy on the other hand.
Indeed, when the liquid in a pore freezes, the pore walls impose positive curvature on the crystal, so that the equilibrium melting point is reduced. This phenomenon can be used to measure the pore size distribution by measuring the freezing point using DSC (Differential Scanning Calorimetry) or NMR (Nuclear Magnetic Resonance).
Water thermoporometry was performed on aerogels in several studies (Rousset et al., 1990; Ehrburger-Dolle et al., 1992; Rigacci et al., 1998). A typical result is shown on Figure 2-18.
2W
1000
/
1000f
0 10 20 30
R (nm)
Figure 2-18: Cumulated porous volume against the pore radius obtained from thermoporometry (Rousset et al., 1990)
This method is highly successful for rigid materials, but it also exerts stresses on the network, so it is less reliable for compliant materials. Rousset et al.(Rousset et al., 1990) report that 27% of the total volume is not detected (this percentage grows to 50-60% in Rigacci et al.) and attribute it to the macropores (thermoporometry does not allow observations of pores with a radius larger than 400
A).
This interpretation has been refuted by Scherer (Scherer, 1998), who attributes it to the volume shrinkage during investigation.Permeability
One method that is satisfactory for measuring the characteristic pore size of a network is permeabil-ity(Scherer, 1998). The permeability is controlled by the breakthrough radius, rBT. This is the same characteristic size obtained from the inflection point of a mercury intrusion or nitrogen desorption curve, and it represents the critical pore size controlling entry into a percolating network of the largest pores.
A direct test of this idea has been made in the following way: rBT was calculated from permeability measurements made on wet gels, then the gels were supercritically dried and the aerogels were examined
by nitrogen desorption; the values of rBT were found to be in good agreement. Measurements of this kind indicate that rBT is 15 nm for silica gels containing >6 vol% solids. If there were a substantial fraction of macropores i.e. constituting 20% of the pore volume, then those pores should percolate and dominate the permeability, but that is not the case.
2.2.3
Scattering Techniques
SAXS (Small Angle X-Ray Scattering) (Borne et al., 1995; Schaefer and Keefer, 1986; Emmerling and
Fricke, 1992) and SANS (Small Angle Neutron Scattering) (Vacher et al., 1988; Reidy et al., 2001) have been extensively used to study the fractal structure of the aerogel network. Low-angle scattering methods are valuable non-contact methods, yet they yield only general features of the network structure, not including a pore size distribution.
The typical arrangement of a scattering experiment is shown in Figure 2-19. The specimen is irradiated
by monoenergetic photons (light, X-rays) or particles (neutrons). Part of this incoming primary beam is
scattered as a result of the inhomogeneity of the sample. We then consider the scattering wavevector
q=k -k
where k and k' are the wave vectors of the impinging and the scattered photon (neutron) respectively. In case of elastic scattering the absolute values of k and k' are unchanged ( =k
I
= - , A beingthe wavelength). If, in addition, the structure is statistically isotropic, the scattering intensity depends only on the absolute value of the scattering vector:
47r .0 q = - sin