HAL Id: hal-02995912
https://hal.archives-ouvertes.fr/hal-02995912
Submitted on 9 Nov 2020HAL is a multi-disciplinary open access archive for the deposit and dissemination of sci-entific research documents, whether they are pub-lished or not. The documents may come from teaching and research institutions in France or abroad, or from public or private research centers.
L’archive ouverte pluridisciplinaire HAL, est destinée au dépôt et à la diffusion de documents scientifiques de niveau recherche, publiés ou non, émanant des établissements d’enseignement et de recherche français ou étrangers, des laboratoires publics ou privés.
Developmental transitions in body color in chacma
baboon infants: Implications to estimate age and
developmental pace
Jules Dezeure, Julie Dagorrette, Alice Baniel, Alecia Carter, Guy Cowlishaw,
Harry Marshall, Claudia Martina, Cassandra Raby, Elise Huchard
To cite this version:
Jules Dezeure, Julie Dagorrette, Alice Baniel, Alecia Carter, Guy Cowlishaw, et al.. Developmental transitions in body color in chacma baboon infants: Implications to estimate age and developmental pace. American Journal of Physical Anthropology, Wiley, 2020, �10.1002/ajpa.24118�. �hal-02995912�
1
Developmental transitions in body color in chacma baboon infants:
1implications to estimate age and developmental pace
2Jules Dezeure1, Julie Dagorrette1, Alice Baniel2, Alecia J. Carter3, Guy Cowlishaw4, Harry H. 3
Marshall5, Claudia Martina3,4,6, Cassandra Raby4,7, Elise Huchard1 4
1Institute of Evolutionary Biology of Montpellier (ISEM), Université de Montpellier, CNRS, 5
IRD, EPHE, Montpellier, France. 6
2Department of Anthropology, Stony Brook University, Stony Brook, NY, USA 7
3Department of Anthropology, University College London, London, UK 8
4Institute of Zoology, Zoological Society of London, Regent’s Park, London NW1 4RY 9
5Centre for Research in Ecology, Evolution and Behaviour, Department of Life Sciences, 10
University of Roehampton, London, SW15 4JD, UK 11
6Department of Behavioural Biology, University of Vienna, Althanstrasse 14, 1090, Austria 12
7 Institute of Integrative Biology, University of Liverpool, Biosciences Building, Liverpool, 13 L69 7ZB, UK 14 15 Corresponding author: 16
Jules Dezeure, Institute of Evolution Science of Montpellier, UMR 5554, University of 17
Montpellier, CNRS, IRD, EPHE, Place Eugène Bataillon, Cc 065, 34095 Montpellier Cedex 18 05, France. 19 Email: jules.dezeure@etu.umontpellier.fr 20 21
ABSTRACT
22Objectives: In many primates, one of the most noticeable morphological developmental traits 23
is the transition from natal fur and skin color to adult coloration. Studying the chronology and 24
average age at such color transitions can be an easy and non-invasive method to (i) estimate the 25
2
age of infants whose dates of birth were not observed, and (ii) detect inter-individual differences 26
in the pace of development for infants with known birth dates. 27
Materials and Methods: Using a combination of photographs and field observations from 73 28
infant chacma baboons (Papio ursinus) of known ages, we (1) scored the skin color of six 29
different body parts from pink to grey, as well as the color of the fur from black to grey, (2) 30
validated our method of age estimation using photographic and field observations on an 31
independent subset of 22 infants with known date of birth, and (3) investigated ecological, 32
social and individual determinants of age-related variation in skin and fur color. 33
Results: Our results show that transitions in skin color can be used to age infant chacma 34
baboons less than seven months old with accuracy (median number of days between actual and 35
estimated age = 10, range=0-86). We also reveal that food availability during the mother’s 36
pregnancy, but not during lactation, affects infant color-for-age and therefore acts as a predictor 37
of developmental pace. 38
Discussion: This study highlights the potential of monitoring within- and between-infant 39
variation in color to estimate age when age is unknown, and developmental pace when age is 40
known. 41
42
Keywords:
ageing method, primate, inter-individual variation, food availability43 44
INTRODUCTION
45The relationship between age and physical maturation has been a major topic of interest in 46
behavioral and evolutionary ecology. Across species, different developmental paces shed light 47
on between-species life-history variations (Sibly, Grady, Venditti, & Brown, 2014). For 48
example, primates, including humans, have longer periods of lactation, associated with slower 49
postnatal growth and smaller litter size compared to other mammals of similar sizes (Dufour & 50
3
Sauther, 2002). Across populations and individuals of a same species, variation in infant 51
developmental pace can have important fitness consequences on later survival and future 52
reproduction (Lindström, 1999) as well as on maternal reproductive success, via a trade-off 53
balancing investment in current versus future progeny (Lee, Majluf, & Gordon, 1991; 54
Maestripieri, 2002; Trivers, 1972). 55
Developmental pace may vary in relation to various environmental, social, maternal and 56
individual traits. Specifically, and as for all mammals, the quantity and quality of milk represent 57
a primary influence on infant growth trajectory (Lee, 1996). For example, a positive impact of 58
exclusive breastfeeding in the first 3-5 months of life on growth rates is observed among 59
children in Bangladesh (Arifeen, Black, Caul, Antelman, & Baqui, 2001). In non-human 60
primates, food availability between conception and weaning is an important source of variation 61
in developmental pace, which is likely mediated by maternal condition for young infants who 62
do not yet feed independently (Lee, 1996). As a result, the seasonal timing of birth, as well as 63
maternal traits that may affect the nutritional status of mothers, may affect growth and 64
development (Lee, 1996; Lummaa, 2003; Vandeleest & Capitanio, 2012). For example, in 65
hierarchical societies, dominant females often have a better access to food, which may lead to 66
higher reproductive rates and faster offspring development (Clutton-Brock & Huchard, 2013; 67
Stockley & Bro-Jørgensen, 2011). Individual traits, like infant sex, may also impact the 68
developmental pace of sexually dimorphic primates (Lonsdorf, 2017). Finally, selective 69
pressures such as predation risk (Coslovsky & Richner, 2011; Fontaine & Martin, 2006), 70
infanticide risk (Bădescu et al., 2016) or group size (Borries, Larney, Lu, Ossi, & Koenig, 2008) 71
may further impact developmental trajectories, depending on the species considered. 72
In more than 30% of primate species, one of the most noticeable and widespread 73
morphological developmental traits is the transition from natal fur and skin color to adult 74
coloration (Ross & Regan, 2000; Treves, 1997). Neonatal fur coloration may have evolved to 75
4
promote allomaternal care, infant attraction and protection by other group members, or in 76
response to infanticide risk (Ross & Regan, 2000; Treves, 1997). Even if the ultimate function 77
of neonatal fur color remains unclear (Hrdy, 1976; Treves, 1997), careful monitoring of such 78
developmental transitions at the individual level could have at least two important applications. 79
First, if the age at which such transitions occur does not vary excessively across individuals, it 80
can be an easy and non-invasive method to estimate individual ages in transitional infants for 81
whom the date of birth is unknown (Altmann & Altmann, 1981). Such a method relies on the 82
detailed description of age-related changes in body coloration for a cohort of infants of known 83
ages. This approach, which can be applied using observational data only, has significant 84
advantages over many other common methods, such as body weight or dental eruption patterns, 85
which rely on invasive measurements (Hohn, 2009; Morris, 1972). 86
Second, for infants of known ages, inter-individual differences in the age of color 87
transitions may reflect broader individual variation in developmental pace, if they correlate with 88
physical growth or other indicators of behavioral development, such as social, feeding and 89
locomotor development, or the temporal dynamics of the mother-offspring relationship 90
(Barthold, Fichtel, & Kappeler, 2009; Treves, 1997). Few studies have investigated such 91
correlations. Across species, the loss of natal pelage of 138 primate species is partially 92
correlated with the temporal dynamics of mother-offspring spatial proximity, i.e. this color 93
change begins around the period when the infant spends a considerable amount of time (25%) 94
out of the mother’s arm-reach (Treves, 1997). Within species, the transition from natal to adult 95
fur coincides with advanced physical independence, such as independent locomotion and 96
feeding on solid food as is the case in red-fronted lemurs (Eulemur fulvus rufus) (Barthold et 97
al., 2009). In such cases, recording infant color changes at particular ages may represent one 98
easy way to quantify individual differences in developmental pace, and an early-life indicator 99
of weaning age, which is a crucial life history trait affecting maternal fitness. 100
5
Baboons are among the most studied of the non-human primates, but our ability to 101
estimate infant age and our understanding of the determinants of infant developmental pace in 102
this species are still limited. Little work has been done to estimate infant age based on color 103
transitions since two seminal papers on yellow baboons (Papio cynocephalus) forty years ago 104
(Altmann & Altmann 1981; Rasmussen 1979) - although a short preliminary study has also 105
been published on chacma baboons (Papio ursinus) (Whitehead, Henzi, & Piper, 1990). These 106
studies report that the fur and skin of infants of both species show different coloration compared 107
to adults. When they are born, the fur is black and the exposed skin on the face, ears, hands, 108
and feet are pink, and they gradually acquire the physical traits of adults, grey skin and dark 109
grey fur for chacma baboons (yellow fur for yellow baboons) in their first year of life. This 110
transition may operate following a specific chronology, with some parts of the body turning 111
grey before others (Altmann & Altmann, 1981). However, those studies have only described 112
the chronology of the color transitions, while the accuracy of a method based on such transitions 113
to estimate infant ages has never been assessed. 114
More is known about developmental pace in baboons, but few studies have focused on 115
the specific pace of developmental transitions in coloration. High levels of individual variation 116
can be seen across various indicators of development including changes in fur and skin color, 117
as well as in growth rate and behavioral development, with some infants maturing faster than 118
others (Altmann 1980; Altmann and Alberts 2005; Altmann and Altmann 1981; Johnson 2003). 119
Food availability in the environment is a major factor influencing individual variation in growth 120
rate (Altmann & Alberts, 2005). The timing of the birth in the annual cycle could thus impact 121
infant developmental pace, as seasonal variation in food availability largely occur across 122
tropical Africa (Feng, Porporato, & Rodriguez-Iturbe, 2013). Moreover, maternal traits are also 123
known to affect baboon infant development: yellow baboon infants of dominant females have 124
faster growth rates and reach sexual maturity earlier than those of subordinates (Alberts & 125
6
Altmann, 1995; Altmann & Alberts, 2005; Charpentier, Tung, Altmann, & Alberts, 2008). In 126
this same population, offspring of multiparous females are larger for their age than offspring of 127
primiparous females (Altmann & Alberts, 2005). Overall, while the determinants of individual 128
variation in growth trajectories have already been explored, less is known about color 129
transitions in baboons. Examining such variation may contribute to a better understanding of 130
processes affecting growth and physical maturation, and changes in the color of certain body 131
parts could be used as indicators of developmental pace in baboon species. 132
Using the skin and fur coloration of wild infant chacma baboons, we first characterize 133
in detail the temporal sequence of physical maturation from natal to adult-like coloration to 134
compare the chronology of these coloration transitions with other baboon populations and 135
species. Second, we assess the accuracy of the developed method by using these dates of 136
coloration transitions to estimate the ages of infants, and comparing age estimates with their 137
known birth dates. We then examine the main determinants of individual variation in body color 138
transitions for a cohort of infants of known ages, focusing on the influence of ecological factors 139
(food availability during pregnancy and early lactation, timing of infant birth in the annual 140
cycle), maternal traits (rank and parity) and individual traits (sex) on the age at transitions. 141
142
Material and Methods
1431 Study site 144
Data were taken by different field observers each year between 2005 and 2019 from three 145
habituated groups of chacma baboons (J and L since 2005, and M, a fission of group J, since 146
2016) living in Tsaobis Nature Park (22°23S, 15°44’50E). Chacma baboons at the Tsaobis 147
Baboon Project live in a semi-arid region of Namibia, on the edge of the Namib Desert. Annual 148
rainfall is low and variable which leads to relatively low, and highly unpredictable food 149
availability (Cowlishaw & Davies, 1997). Nonetheless, rainfall occurs most years, and peaks 150
7
between January and April, resulting in an annual food peak of variable intensity and duration 151
from February to May. The groups were followed daily on foot from dawn to dusk, allowing 152
observers to collect a variety of demographic, life-history, behavioral and group spatial data. 153
Each group member was known individually through ear notches and identifying marks, and 154
each new birth in a group was recorded. Reproductive states of adult females were recorded 155
every day in the field, and they were classified as: (i) pregnant, where pregnancy was 156
determined post hoc following infant birth, and encompassed the six months between the 157
conceptive cycle and the birth; (ii) lactating, for the period from infant birth until the resumption 158
of cycling; and (iii) cycling, including both swollen females (i.e., sexually receptive with a 159
perineal swelling) and non-swollen females between two swelling phases. Groups were not 160
followed year-round, and each year a field season of variable length was conducted 161
(median=126 days, range: 57-240 days). 162
163
2 Ecological and individual traits 164
To investigate the determinants of individual variation in physical development, we considered 165
both ecological and individual traits. We estimated food availability with the normalized 166
difference vegetation index (NDVI). This measure has previously been used as a proxy of food 167
availability in our population (Baniel, Cowlishaw, & Huchard, 2018) and other baboon 168
populations (Zinner, Peí Aez, & Torkler, 2001). We extracted the mean NDVI per 16-day 169
period on a 500 m resolution from 2004 until 2019 on the NASA website (MOD13A1 product) 170
(Didan, Barreto Munoz, Solano, & Huete, 2015) within the home ranges of the three habituated 171
groups. Using the GPS locations recorded every 30 minutes by the observers during daily group 172
follows, between 2005 and 2019, we computed 100% isopleth home ranges for our three groups 173
separately using kernel density estimates (‘kernelUD’ function, h set to ‘href’) implemented in 174
the adehabitatHR package (Calenge, 2006). We then computed a daily NDVI value for each 175
8
group on its given home range using a linear interpolation between two known NDVI values of 176
16 days-intervals. 177
The social rank of adult females was established each year for each group separately using 178
ad libitum and focal observations of dyadic agonistic interactions (supplants, displacements,
179
threats, chases and physical attacks). We computed a linear hierarchy among adult females 180
using Matman 1.1.4 (Noldus Information Technology, 2013), and then calculated a relative 181
rank for each female controlling for group sizes. This relative rank was computed using the 182
formula (N-r)/(N-1), where N was the number of adult females in the group in a given year, and 183
r was the absolute rank of the female (ranging from 1 to N, 1 being the most dominant). 184
Although adult females’ ranks are relatively stable through time, individuals’ relative ranks 185
change as females enter and leave the hierarchy through maturation and death, respectively. 186
Each female was assigned one relative rank per year, ranging from 0 (for the lowest ranking 187
female) to 1 (for the highest-ranking), as hierarchy is inherited and stable for female baboons. 188
For analyses of infant development, we considered the mother’s rank during the year her infant 189
was born. 190
The mother’s parity was assigned using long-term life-history data. Females were 191
considered primiparous between the birth of their first and second infant, and multiparous after 192
the birth of their second infant. 193
194
3 Infant color scoring 195
Infant coloration was scored using photographs and direct field observations. An observation, 196
which could be either from a photograph or from the field, was a set of scores of different body 197
parts on a given day for a given infant baboon. We used photographs opportunistically taken 198
by field observers between 2005 and 2018 of infant baboons aged between 0-19 months old 199
(N=255 pictures of 109 infants in total, median=2 pictures per individual, range: 1-11 pictures 200
9
per individual). We discarded photographs when luminosity or quality were too poor to give a 201
color score. In addition, in 2018 and 2019, infant baboons were scored every two weeks using 202
direct field observations, until they finally turned completely grey. We obtained 158 field 203
observations on 28 infants in this way, i.e. with no photograph (median=5.5 observations per 204
individual, range: 1-10 observations per individual). Infant baboons were scored on 205
photographs by one observer (Author 2), and in the field by one observer (Author 1). We 206
determined the inter-individual consistency of scores by scoring independently the same set of 207
60 pictures, and compared score similarity with the intra-class correlation coefficient for each 208
body part (Koo & Li, 2016). To do so, we computed intra-class coefficient looking at the 209
absolute agreement of a single-fixed rater with a two-way mixed models, using the ICC function 210
of the ‘psych’ package in R (Revelle, 2020). The scoring reliability was excellent for each body 211
part (mean ± SD, ICC = 0.92 ± 0.06, see also Table S1 of the Supporting Information). Thus, 212
in total, we scored coloration for 134 infants between 2005 and 2019. 213
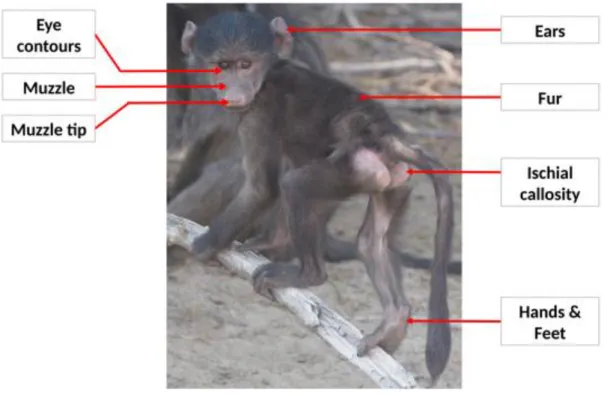
In addition to determining the color of the fur covering the whole body, we scored the skin 214
color of the following body parts: ears, eye contours, hands and feet, muzzle, muzzle tip, and 215
ischial callosities (see Figure 1 for locations of these body parts). For each body part, we 216
attributed a score between 1 and 5 following previous work (Altmann & Altmann, 1981; 217
Rasmussen, 1979), such that 1 is fully pink, 2 is distinctively pinker than grey, 3 is a mixture 218
of pink and grey, 4 is distinctively greyer than pink, and 5 is fully grey (Figure 2). For the fur, 219
1 is fully black, 3 is a mixture of black to grey, and 5 is fully grey; we did not use scores 2 and 220
4 because the color transition for the fur is less obvious than for other body parts (Figure 2). 221
We scored all the body parts that were visible in each photograph. The data that support the
222
findings of this study are openly available in Mendeley data:
223
http://dx.doi.org/10.17632/65vk9tck25.1.
224 225
10
4 Accuracy of age estimations based on fur and skin coloration 226
To describe the physical transition in fur and skin coloration and further test whether it is a 227
reliable method to estimate the age of an infant, we focused on scores from a sample of 73 228
infants of known age, that is, whose date of birth was known with a maximum uncertainty of 229
10 days. These dates of birth were determined from having been present on either the day of 230
birth (51 infants, hereafter called Sample 1) or the day of conception (22 infants, called Sample 231
2). The conception day was identified as the exact day of deturgescence of the sexual swelling 232
in the conceptive cycle, which was the cycle followed by a pregnancy and by no other cycle. 233
We then estimated the dates of birth of these 22 infants by adding 190 days to the conception 234
date, based on the fact that the mean gestation length is 190 days at Tsaobis with little variability 235
(range: 181-200 days, SD = 5, N = 13 pregnancies where both conception and birth were 236
observed). We considered only baboons aged less than 8 months, as older baboons, from 8 to 237
19 months old, were all fully grey. We thus restricted our dataset to this Cohort 1, comprising 238
242 observations from 73 infants: 148 photographs on 59 infants and 94 field observations on 239
16 infants (including 2 infants that were both photographed and observed in the field in 2018). 240
Specifically, we obtained 238 scores for ears, 201 for eye contours, 238 for fur, 203 for hands 241
and feet, 239 for muzzle, 91 for muzzle tip and 143 for ischial callosities. 242
To determine the body parts that showed the most reliable timing in color transition to 243
predict ages, we computed a correlation matrix using the Spearman’s rank correlation 244
coefficient between infant age (in months) and color scores for each body part of individuals in 245
Cohort 1. We also examined pairwise correlation coefficients between the different coloration 246
scores to determine whether some body parts provided redundant information because they 247
changed color at the same age. It is important to note that the dataset used to generate these 248
correlations is pseudoreplicated to some extent given that some individuals contribute multiple 249
observations. These correlation coefficients are nevertheless useful to compare values across 250
11
body parts, but should be interpreted with caution to evaluate the statistical significance of any 251
single correlation. 252
To determine the accuracy of coloration scoring as an estimate of infants’ ages, we 253
computed the difference between the actual known age and the estimated age of another, 254
independent subset of 70 observations on 22 infants. To do so, we divided our Cohort 1 in two 255
sub-samples, namely Sample 1, including 172 observations of 51 infants with precisely known 256
dates of birth (less than 10 days of uncertainty), and Sample 2, including 70 observations on 22 257
infants (with exactly 10 days of uncertainty on their date of birth, since it had been inferred 258
from conception date). We use Sample 1 as the reference for age estimation at color transitions, 259
and Sample 2 to validate our method on a fully independent sample. 260
With Sample 1, we first conducted a principal component analysis (PCA) taking into 261
account the color scores of the seven body parts considered, using the function ‘PCA’ of the 262
‘FactoMineR’ package (Husson, Josse, Le, & Maintainer, 2020). We had a considerable 263
number of missing values in our dataset as it was generally impossible to score all body parts 264
from a single picture. To conduct a PCA with missing values, we performed imputations to 265
complete the dataset using the ‘imputPCA’ function of the ‘missMDA’ package (Josse & 266
Husson, 2016), which uses an iterative algorithm taking into account similarities between 267
observations, as well as relationships between the scores of different body parts. The first 268
dimension of the PCA (PC1) explained 86.6% of the variance of the color scores (versus 8.8% 269
for the second dimension), and was the only PC retained for downstream analyses. We then 270
investigated the relationship between PC1 and infant age (in days). To do so, we compared 271
several linear models, all with PC1 as response variable, and containing as fixed effects a 272
polynomial function of age modelled with variable degrees (from 1 to 8). We selected the best 273
model of this subset as the one minimizing the Akaike Information Criterium (AIC), and a 274
polynomial function of age of degree 4 was retained in our model. 275
12
Next, we followed four steps to quantify the accuracy of age estimation from Sample 2. 276
First, we estimated the missing values of the Sample 2 dataset on color scores using the method 277
described above (‘missMDA’ package) (Josse & Husson, 2016). Second, we predicted the 278
values of PC1 using the color scores of the seven body parts, using the ‘predict.PCA’ function 279
of the ‘FactoMineR’ package, that took into account the PC1 values computed from Sample 1 280
(Husson et al., 2020). Third, we used the linear model (that was computed on Sample 1) to 281
calculate one age estimate for each of these predicted values of PC1, i.e. for each observation 282
of Sample 2. More precisely, we used the ‘uniroot’ function in R to solve the equation of 4 283
degrees linking each PC1 value with infant age. Fourth, we computed the absolute difference, 284
in days, between the actual known age (± five days of uncertainty) and this estimated age to 285
quantify the accuracy of our method of age estimation. 286
In order to investigate the effect of the number of body parts that were scored on the 287
accuracy of our age estimates, as well as which body part was the most informative in this 288
context, we repeated this process with a variable number of body parts. From the seven body 289
parts initially considered, we first removed the fur scores from Samples 1 and 2, as the scores 290
of this body part had the lowest correlation with PC1. We then repeated this process by 291
progressively removing one body part at a time, based on the relative values of the correlation 292
between PC1 and the raw scores of that body part, removing first those parts for which scores 293
were least correlated to PC1. Chronologically, we first removed fur, followed by hands and 294
feet, ischial callosities, muzzle and eye contours. Our last round of analyses contained only 295
scores from ears and muzzle tip. 296
We also tested whether the 5-level scale for color scores produced more accurate age 297
estimations than a simpler 3-level scale with the following levels: (1) pink (score 1 in our 5-298
level scale), (2) transitional (pooling scores 2, 3, 4 in our 5-level scale), (3) grey (score 5 in our 299
5-level scale). Using only one score instead of three for transitional colors can facilitate data 300
13
collection in the field, and be less subjective across observers. We then repeated the same 301
processes described for Samples 1 and 2, to quantify the accuracy of the age estimation under 302
a 3-level scale of color scores for different number of body parts considered. 303
We also tested the effect of the number of observations per individual on the accuracy of 304
age estimates. In Sample 2, there were 70 observations from 22 infants (range = 1-8, median=2 305
observations per infant). For all infants with more than one observation, we computed one 306
estimated birth date by averaging the different birth date estimates from each observation. We 307
then computed the difference, in days, between the actual and estimated birth dates as an 308
indicator of estimation accuracy to compare the accuracy of age estimates obtained from a 309
variable number observations of a given infant. 310
Moreover, we investigated the potential effects of the actual age of an infant on the accuracy 311
of age estimations per observation, to test whether the accuracy of our age estimates may 312
decrease for older juveniles. To do so, we ran a linear mixed model, with the accuracy of age 313
estimates per observation (i.e. the absolute number of days between actual age and estimated 314
age) as a response variable, the actual age as the only fixed effect, and infant identity as the 315
only random effect (to control for repeated observations). For this analysis, we used all 316
observations available from Sample 1, for all 7 body parts scored on a 5-level scale. 317
Finally, we were interested in quantifying the effects of observation types, i.e. field or 318
photographic observations, on the accuracy of age estimation per observation. To do so, we ran 319
a linear mixed model, with the accuracy of age estimates per observation as a response variable, 320
the observation type as the only fixed effect, and infant identity as the only random effect (to 321
control for repeated observations). For this analysis, we used all observations available from 322
Sample 1, for all 7 body parts scored on a 5-level scale to estimate ages of Sample 2 (Sample 2 323
contained 38 field observations from 5 infants and 32 photographic observations from 17 324
infants). 325
14 326
5 Determinants of individual variation in the pace of color changes 327
To identify the main determinants of developmental pace, we used 242 observations from the 328
full sample of 73 infants with known ages (Cohort 1), and ran general additive mixed models 329
(GAMMs). We first computed a weighted mean color score for each observation, where the 330
score of each body part was given a different weight depending on its correlation with infant 331
age (see above). More precisely, we attributed less weight to body parts that were less correlated 332
with age by dividing their color score by their correlation coefficient, on the basis that the 333
developmental pace of these body parts was less variable across individuals for a given age, 334
and so presumably less affected by environmental and individual factors. We thus obtained a 335
general score of color development across all body parts for a given observation. Our response 336
variable was the weighted mean color score per observation (continuous variable). 337
GAMMs allow to fit non-linear relationships between the response variable and one or 338
more fixed effect(s), using thin plate splines (Wood, 2003). We first determined the best model 339
describing the age effect on mean color scores, with the identity of infant set as random effect 340
to take into account the lack of independence between multiple observations of a same 341
individual. To do so, we compared GAMMs containing either (1) a simple, continuous effect 342
of age; (2) age modelled as a polynomial of degree 2; (3) a polynomial of degree 3; or (4) age 343
modelled using a thin plate regression spline. We selected the best model as the one minimizing 344
the Akaike Information Criterium (AIC). We found that the age modelled using a thin plate 345
regression spline was retained in all our models (See Table S2 in the Supporting Information 346
for model selection on the weighted mean color score response variable for an example). We 347
then ran our global GAMMs, with age modelled with a spline, infant identity as random effect, 348
and including the following additional fixed effects: 349
15
- Food availability during infant growth. We expected infants whose gestation and birth 350
occurred during periods of high food availability to develop faster for their age (Altmann & 351
Alberts, 2005; Johnson, 2003). To test which time period of infant development (prenatal 352
versus postnatal) was most sensitive to variations in food availability, we investigated the 353
effects of both food availability during pregnancy (approximated by the mean NDVI daily 354
values between conception and birth date for a given infant) and early lactation (approximated 355
by the mean NDVI daily values between birth and observation date for a given infant). As these 356
two indicators of food availability were highly correlated (Pearson correlation = 0.39, 357
confidence interval: [0.28; 0.49], t=6.58, P-value<10-4), leading to collinearity, we included 358
them separately in two different models. 359
- Date of birth. We expected infants born at particular times of the year to develop more
360
quickly. The NDVI is only a partial proxy of food availability, and other components of 361
seasonal variation that are not necessarily captured by NDVI (such as temperature, photoperiod, 362
or particular plant phenologies) may further affect developmental pace. As a given date in the 363
annual cycle is a circular variable (at least when considering environmental seasonality), we 364
used a sine fixed effect expressed as follows to introduce the infant’s date of birth, converted 365
in radians, into our multivariate linear model:
366
sin(𝐼𝑛𝑓𝑎𝑛𝑡′𝑠𝑑𝑎𝑡𝑒𝑜𝑓𝑏𝑖𝑟𝑡ℎ + 𝜑) 367
Where φ is the phase value. We changed the phase value φ (to 0, π/6, π/3, π/2, 2*π/3, 5*π/6) to 368
account for potential phase shifts across the year, i.e. to consider all the months of the year as 369
possible birth months maximizing faster development. For example, a positive effect of the sine 370
phase of π/6 would maximize February, and a negative effect will maximize August. We ran 371
sequentially six different multivariate models (GAMMs with the six different phase values) 372
containing all other fixed effects, and we selected the best phase as the one minimizing the AIC 373
(which is π/3 for the weighted mean color score model). 374
16
- Mother’s dominance rank. We expected infants from dominant females to develop more
375
quickly, following studies on other aspects of baboon developmental pace (Altmann & Alberts, 376
2005; Cheney et al., 2004; S. Johnson, 2003). 377
- Mother’s parity. We expected infants from primiparous mothers to develop more 378
slowly, following studies on other aspects of baboon developmental pace (Altmann & Alberts, 379
2005). 380
- Infant sex. We did not expect any sex difference in the pace of early morphological 381
development, following studies on other aspects of baboon developmental pace (Altmann & 382
Alberts, 2005; Altmann & Altmann, 1981; Johnson & Kapsalis, 1995). Nevertheless, we 383
included this variable to control for potential unexpected sex differences. 384
- Group identity, to control for possible differences between social groups. 385
We further considered each body part separately (seven models) to test whether the same 386
determinants affected all body parts or only some of them, and to evaluate which body parts 387
were most sensitive to ecological, individual and maternal traits. Here, our response variables 388
were the scores of one given body part, and were coded as ordinal, with five categories for each 389
body part (except for the fur, with only three categories). We ran all the GAMMs using the 390
‘gam’ function of the ‘mgcv’ package (Wood, 2003), in R version 3.5.0 (R Core Team, 2018). 391
Ordinal response variables for each body part were specified with the family ‘ocat’ of the 392
‘mgcv’ package (Wood, 2003). We computed parameter estimates for each fixed effect, with 393
Wald statistic tests (X2) and P-values associated. For smooth effects, we computed the effective 394
degrees of freedom, with the Wald statistic test and the P-value. We considered an effect to be 395
significant when its P-value was < 0.05. We were also interested in quantifying the importance 396
of inter-individual variation in developmental pace, and so tested the significance of the random 397
intercept, looking similarly at its P-value. For each model, we also checked graphically the 398
normality of the residuals’ distribution and the accuracy of the number of knots used for the 399
17
age thin plate spine (this parameter constrains the ‘wiggliness’ of the smooth, i.e. the number 400
of bow points in the fitted curve) (Wood, 2003) using the ‘gam.check’ function of the ‘mgcv’ 401
package (Wood, 2019). Graphical representations were made using the ‘mgcViz’ package 402
(Fasiolo, Nedellec, Goude, & Wood, 2018). 403
404
RESULTS
4051 Characterization of fur and skin color changes in chacma baboon infants 406
All results associated with the characterization of fur and skin color changes in relation to age 407
are summarized in Figure 3. All baboons were fully grey (i.e., at all body parts) after 8 months 408
of age, with similar fur and skin coloration as adults. The fur, muzzle or hands and feet were 409
the first body parts to turn grey, on average between 1 and 2 months of age. Hands and feet, as 410
well as the muzzle, started to transition around 1 month old until becoming fully grey at approx. 411
4 months of age. Ears started to turn grey after 2 months and were totally grey by 5 months. 412
The last body parts to change color were the eye contours, the ischial callosities, and the tip of 413
the muzzle, which started to transition at approx. 3 months of age, and finished after 5 months. 414
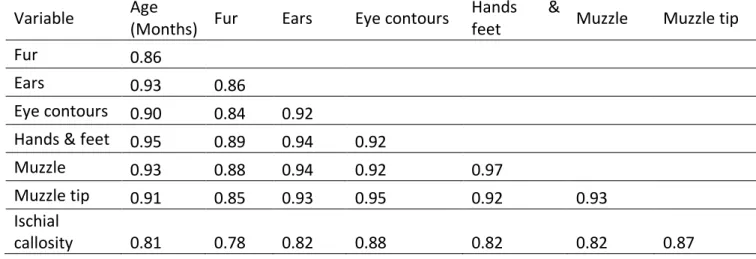
The qualitative chronology of the transition was apparent in the correlation matrix (Table 1): 415
hands and feet scores were highly correlated with muzzle scores, and eye contours scores were 416
highly correlated with muzzle tip scores. Nonetheless, the order in which body parts change 417
color was not always consistent across individuals. For some infants, we observed ears turning 418
grey before muzzles and hands, or ischial callosities turning grey before the muzzle tip and ears. 419
Overall, a chacma baboon infant with entirely pink skin and black fur was almost always 420
younger than 2 months old, as at least the hands and feet started to turn grey after this age. An 421
infant with entirely grey skin and fur was at least 4 months old, as no infant was observed with 422
a grey tip of the muzzle before this age. Finally, a transitional infant was aged between 1 and 6 423
months old. 424
18 425
2 Accuracy of age estimates based on color scores 426
The color scores were strongly correlated with the known ages of infants for all body parts, 427
though correlation coefficients were slightly lower for the fur and the ischial callosities (Table 428
1). This means that the scores of these two body parts produce less precise age estimates, 429
probably due to higher inter-individual variation in the age of transition of these parts compared 430
to others. For example, a 3-month-old baboon could exhibit the full range of colors for ischial 431
callosities, from fully pink to fully grey; and a 1-month-old baboon could exhibit a fully black 432
or a fully grey fur (Figure 3). 433
In order to test the accuracy of infant body coloration as a method of age estimation, we 434
computed a composite score (using PCA) from 172 observations of all body parts from 51 435
infants of known ages (births observed, Sample 1), and then predicted this composite score to 436
estimate ages on an independent sample of 70 observations from 22 infants of known ages 437
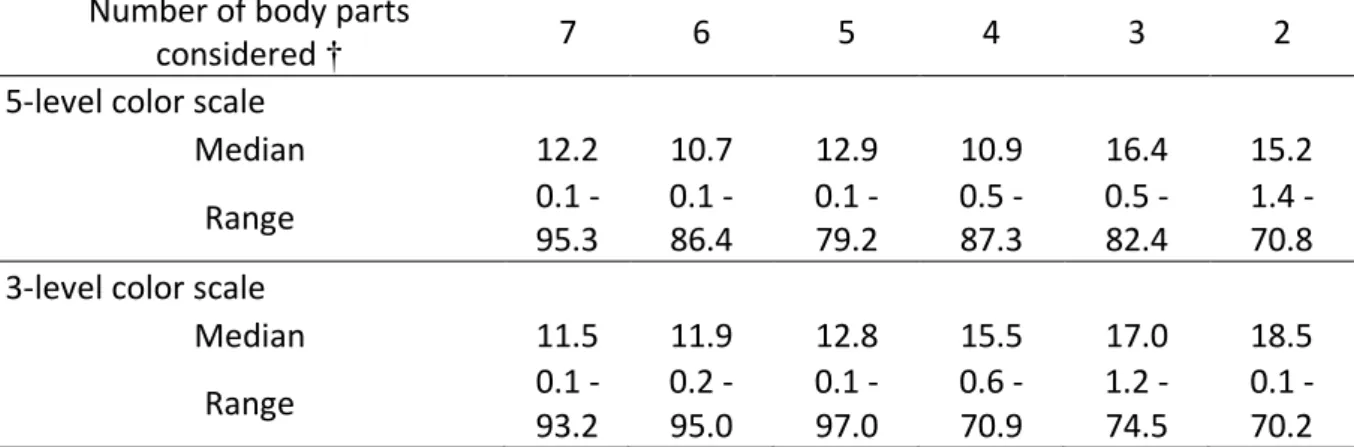
(Sample 2). We obtained a median difference of 12 days between the actual age and the 438
estimated age using 70 observations, 7 body parts and a 5-level scale of color scores (Table 2). 439
We also investigated the effects of the number of body parts considered, and the number of 440
levels of the color scale. Decreasing the number of body parts considered only slightly 441
decreased the accuracy of age estimates (Table 2), and the same conclusion applied for using a 442
3-level color scale instead of a 5-level one – though using a 3-level scale in combination with 443
few body parts decreased accuracy more substantially (Table 2). Our best age estimations per 444
observation were computed when considering the skin across all 6 body parts but excluding the 445
fur, and using a 5-level color scale (absolute number of days of between actual and estimated 446
ages: median = 10.7, range = 0.1–86.4). We also investigated the effect of the number of 447
observations per infant on the accuracy of age estimates: the more observations, the more 448
accurate were the estimates (Figure S1, Supporting Information). Finally, the accuracy of age 449
19
estimates significantly decreased with age (X2 = 10.0, P-value = 1.54x10⁻³) (Figure S2, 450
Supporting Information), and were lower for photographic compared to field observations 451
(Figure S3, Supporting information), albeit the latter effect did not reach significance (X2 = 452
3.63, P-value =0.06). 453
454
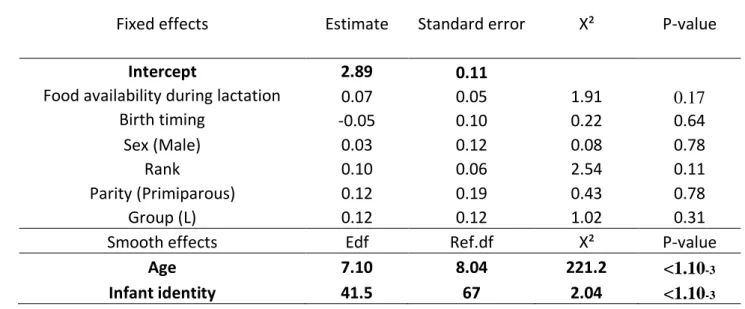
3 Determinants of individual variations in the pace of color changes 455
Finally, we investigated the determinants of inter-individual variations in age-related color 456
scores, looking at ecological (food availability during pregnancy or during early-lactation, birth 457
timing), maternal (parity, rank) and individual (sex) predictors using GAMMs controlling for 458
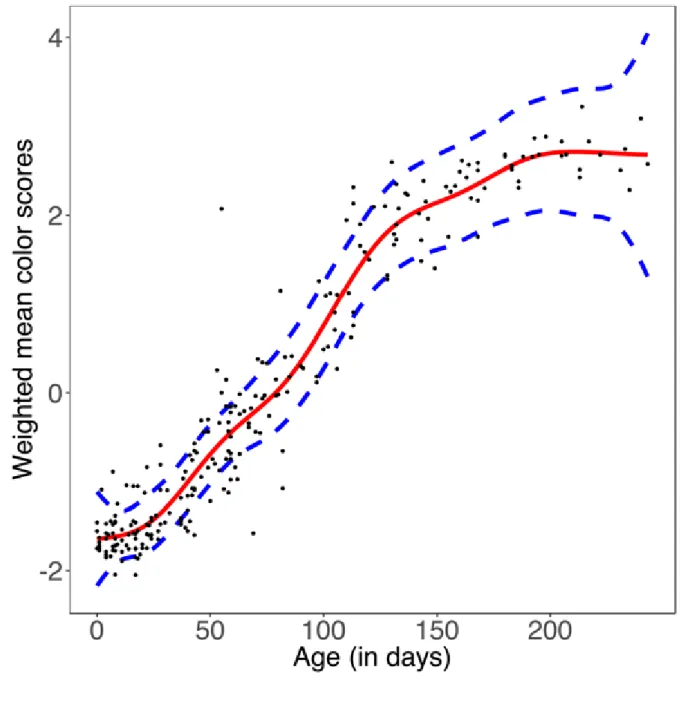
age with a spline regression (Figure 4). The model explained 93% of the variation in the 459
weighted mean color scores. We detected significant inter-individual differences in mean color 460
scores (Table 3), and in most body parts (except for the muzzle tips, for which we had fewer 461
infants scored compared to other parts, see Table S3 in Supporting Information). Our index of 462
food availability during pregnancy influenced the weighted mean color score (controlled for 463
age): infants turned grey earlier considering all their body parts together when food during 464
pregnancy was abundant (Table 3, Figure 5). In contrast food availability during lactation did 465
not (Table S4, Supporting Information). We did not detect any effect of maternal (rank and 466
parity) nor individual (birth date and sex) traits on variation in infant mean color scores 467
controlled for age (Table 3). Looking at individual variation in color transitions for each body 468
part separately, we found a positive effect of food availability during pregnancy on the score of 469
ischial callosities only (Table S3, Supporting Information). We also found a positive effect of 470
the timing of birth on the scores of muzzle tips (maximizing scores for infants born in 471
December-January) but not for other body parts (Table S3, Supporting Information). We did 472
not detect any effect of food availability during lactation, maternal traits, i.e. maternal rank and 473
parity, on variation in infant color for any body part (Table S3, Supporting Information). 474
20 475
DISCUSSION
476Our purpose in this study was twofold: (1) to assess how well infant chacma baboons with 477
unknown ages can be aged on the basis of their skin and fur color, and (2) to explore potential 478
environmental, maternal, and individual predictors of variation in the pace of infant color 479
development for infants with known ages. The age estimates obtained using infant color scores 480
were generally accurate (median number of days between actual age and estimate age per 481
observations = 10, range=0-86 days). All the tools required for estimating ages in a chacma 482
baboon population are provided in this paper. Figures 1 and 2 can be used to score baboon 483
coloration directly in the field (or using photographs), and the methods section details how the 484
first dimension of a composite score (using PCA), derived from these color scores, can be 485
computed to estimate ages. Various recommendations can be made to improve the accuracy of 486
age estimates: 487
1. Use the color scores from all body parts except fur, as age estimates were most accurate 488
with this configuration. However, decreasing the number of body parts considered does 489
not decrease the accuracy of age estimations dramatically. For example, considering 490
only two body parts (ears and muzzle tip) instead of six reduces the accuracy of age 491
estimations by only 4.5 days. Nonetheless, such a result may vary across primate 492
species, and one should establish the relevant body parts to be considered in different 493
species. 494
2. Score the same individual repeatedly, as an infant with 8 observations had a birth date 495
estimation error of 5 days in average, compared to more than 30 days for infants with 496
only a single observation. Ideally, infants should be scored as early as possible (as 497
accuracy decreases as infants age) and regularly until it turns fully grey. 498
21
3. Prioritize field observations. Photographic evidence can be less accurate because color 499
scores may be influenced by fluctuating light conditions. If necessary, photographic 500
approaches should exploit multiple high-resolution photographs of the same individual 501
on a given day at different times and angles to control for light variation. 502
4. Consider using a 3-level color scale, which is slightly less accurate than a 5-level scale 503
but also more practical, and may maximize inter-observer reliability. However, such 504
choice depends on the trade-off between the accuracy targeted and the conditions of 505
data collection (e.g., single versus multiple observers). 506
In addition, this study opens the possibility of a similar application for machine learning where 507
an algorithm could predict the age of an infant based on pictures, as long as a large set of high-508
quality pictures (see recommendation #3) of known-age individuals is available to initialize the 509
algorithm. This relatively recent method is based on mathematical and statistical approaches 510
through which computers can ‘learn’ from data to then make predictions. Such methods have 511
been used in a wide range of field applications, and are becoming increasingly common (Al-512
Jarrah, Yoo, Muhaidat, Karagiannidis, & Taha, 2015). 513
Changes in the pigmentation of infants’ ears and muzzles at Tsaobis follow a similar pattern 514
to that observed in another population of wild chacma baboon living in Mkuzi Game Reserve 515
(South Africa), with an onset of grey coloration appearing around 1-2 months, and the full 516
transition completed around 4-6 months of age (Whitehead et al., 1990). Our detailed 517
characterization of the age at which fur and skin turn grey indicates that infant chacma baboons’ 518
coloration develops faster than yellow baboons (Altmann & Altmann, 1981; Rasmussen, 1979). 519
Whilst chacma baboon infants have all turned grey by 8 months of age, most yellow baboon 520
infants are still in the transition phase at this age, and only exhibit adult color around 12 to 14 521
months of age, depending on the population (Altmann & Altmann, 1981; Rasmussen, 1979). In 522
addition, in contrast to yellow baboons, the order in which body parts change color was not 523
22
always consistent across individuals in this study. Discrepancies observed in the age and 524
chronology of transition between baboon species highlight that such patterns are species-525
specific, and that the methodology presented here should be developed and validated separately 526
for each species. 527
Inter-individual variation in the rate of maturation was high for each body part considered 528
in this study, as found in yellow baboons (Altmann & Altmann, 1981; Rasmussen, 1979). 529
Specifically, the change in fur color was a less accurate indicator of age, as fur turned grey 530
relatively early and showed marked individual variation. Failure to derive accurate age 531
estimates remains non-negligible (we had a maximum of 86 days difference between actual and 532
estimated age when relying on 6 body parts), due to the existence of outlier individuals with 533
very fast or slow development. This suggests that, whilst this method of age estimation is not 534
perfect, infant coloration can provide a simple and non-invasive proxy to detect individual 535
variation in developmental pace on a semi-quantitative scale. Nevertheless, despite their utility 536
for tracking other developmental factors (Barthold et al., 2009; Treves, 1997), studies linking 537
age-related changes in color to other indicators of developmental pace are very rare in baboons. 538
Only one study on Amboseli yellow baboons recorded that late changes in paracallosal skin 539
color can be seen as a first sign of developmental abnormality, being followed by delayed 540
maturation, locomotor disability and finally death (Altmann & Altmann, 1981). 541
Regarding the determinants of individual variations in color-for-age considering all body 542
parts together, we found that higher food availability during pregnancy, but not during early-543
lactation, accelerated the transition towards adult coloration. In line with this, infant yellow 544
baboons from a food-enhanced group grew more rapidly than individuals from wild-foraging 545
groups (Altmann & Alberts, 2005). Similarly, in Phayre’s leaf monkeys (Trachypithecus 546
phayrea) infants in larger groups transitioned from natal to adult fur color later, suggesting that
547
food competition affects infant color maturation and development (Borries et al., 2008). Here, 548
23
we distinguished pre-natal from post-natal food availability, and our results emphasize the 549
importance of maternal condition during pregnancy for infant post-natal color development. In 550
capital breeders like baboons or humans, females can store energy to use it later, and conception 551
likelihood generally peaks during periods of high food availability to increase the success of 552
their reproductive attempt (Brockman & van Schaik, 2005). Numerous human studies similarly 553
show that maternal nutritional status during pregnancy has a significant impact on infant birth 554
weight, early-life development, health and survival (Emery Thompson, 2013; Martorell & 555
Gonzalez-Cossio, 1987). This study, by highlighting the effect of prenatal food availability on 556
inter-individual variations in color-for-age, suggests that similar effects could occur in baboons, 557
and that color-for-age may thus be a reliable indicator of other developmental dimensions. 558
Studies on various primates including baboons have also shown that the infants of dominant 559
females exhibit faster development in terms of growth rate and age at weaning (Altmann & 560
Alberts, 2005; Fedigan, 1983; Pusey, 2012). Yet, surprisingly, maternal rank did not affect 561
individual variation in infant color in this study. Given that color scores reflect inter-individual 562
variation in maternal nutritional condition (see above), it is possible that rank does not capture 563
such differences at Tsaobis, perhaps because most food resources are not monopolizable, or 564
because subordinate females adopt foraging and social strategies that help to mitigate the costs 565
of their low rank (Marshall, Carter, Ashford, Rowcliffe, & Cowlishaw, 2015; Sick et al., 2014). 566
Interestingly, looking at the color development of each body part separately, we found that 567
the only body part affected by prenatal food availability was the ischial callosities. This suggests 568
that the color scoring of different body parts could be used for different purposes; for example, 569
ischial callosities are a better indicator of developmental pace than of age. Further investigations 570
of the determinants of color changes at specific body parts showed that infants born in 571
December-January have greyer muzzle tips for their age than others. However, the muzzle tip 572
was scored on the lowest number of infants (N = 16), and such a small sample size questions 573
24
the robustness of this result that was not replicated using other body parts. Using a larger dataset 574
will be necessary to reach conclusive results. 575
Our study of the determinants of inter-individual variation of color-for-age is preliminary 576
for several reasons. First, we were not able to explore the impact of other factors that are known 577
to influence infant color transitions, like variation in social dynamics and infanticide risk 578
(Bădescu et al., 2016) that are probably of considerable evolutionary significance for young 579
chacma baboons (Cheney et al., 2004; Palombit, 2003). Second, further studies are needed to 580
explore the correlation between age-related changes in coloration and developmental 581
milestones like weaning age for chacma baboons. Testing whether color development co-varies 582
with other dimensions of development would indicate if it could be used as a reliable indicator 583
of developmental pace that may ultimately be connected to fitness. In line with this suggestion, 584
the transition from natal to adult fur coloration of wild ursine colobus (Colobus vellerosus) 585
infants has been used as a proxy of developmental pace to show that high infanticide risk 586
accelerates infant development (Bădescu et al., 2016). Finally, examining the potential effects 587
of infant coloration on protective behavior from other group members, and on the level of 588
alloparenting care received wherever it is relevant (Brent, Teichroeb, & Sicotte, 2008; Ross & 589
Regan, 2000) could be an interesting perspective to test other hypotheses proposed to account 590
for the evolution of natal coat in primates. 591
Our study demonstrates that monitoring the skin color transition of infant baboons is a non-592
invasive and accurate method to estimate age up to 8 months old, with a median accuracy of 10 593
days, which can decrease further if the same individual is scored repeatedly. Our study 594
additionally highlights inter-individual variability in the ages of color transitions. This suggests 595
that scoring the change in infants’ body coloration can also be used to detect individual variation 596
of developmental pace, and certain body parts are more variable than others for a given age, 597
and thus represent promising candidates in this respect. In this context, food availability during 598
25
prenatal life affected infant color-for-age in our population, suggesting that maternal nutritional 599
condition during pregnancy plays a central role in infant color development. Further research 600
is necessary to determine whether such scores correlate with broader aspects of development 601
(morphological, behavioral, and physiological), and which body parts are most useful. 602
603
DATA AVAILABILITY STATEMENT
604The data that support the findings of this study are openly available in Mendeley data:
605 http://dx.doi.org/10.17632/65vk9tck25.1 606 607
ACKNOWLEDGMENTS
608We are grateful to all Tsaobis Baboon Project volunteers (2005-19), and in particular to Anna 609
Cryer, Remi Emeriau, Rachel Heaphy and Vittoria Roatti for sharing their pictures. We further 610
thank the Tsaobis beneficiaries for permission to work at Tsaobis, the Gobabeb Research and 611
Training Centre for affiliation, and the Snyman and Wittreich families for permission to work 612
on their land. We would also like to thank Amy Lu, an anonymous reviewer and two anonymous 613
editor board members for their comments which have actively contributed to the quality of this 614
paper. Data used in this study are part of long-term data collected within the framework of the 615
Tsaobis Baboon Project, recently funded by a grant from the Agence Nationale de la Recherche 616
(ANR ERS-17-CE02-0008, 2018-2021) awarded to EH. This paper is a publication of the ZSL 617
Institute of Zoology’s Tsaobis Baboon Project. Contribution ISEM n°2020-173. 618
619
CONFLICT OF INTEREST STATEMENT
620The authors do not have any conflict of interest to declare. 621
26
BIBLIOGRAPHY
623
Al-Jarrah, O. Y., Yoo, P. D., Muhaidat, S., Karagiannidis, G. K., & Taha, K. (2015). Efficient 624
machine learning for big data: a review. Big Data Research, 2(3), 87–93. 625
https://doi.org/10.1016/j.bdr.2015.04.001 626
Alberts, S. C., & Altmann, J. (1995). Preparation and activation: determinants of age at 627
reproductive maturity in male baboons. Behavioral Ecology and Sociobiology, 36(1), 628
397–406. 629
Altmann, J. (1980). Baboon Mothers and Infants. The University of Chicago Press. 630
Altmann, J., & Alberts, S. C. (2005). Growth rates in a wild primate population: ecological 631
influences and maternal effects. Behavioral Ecology and Sociobiology, 57, 490–501. 632
https://doi.org/10.1007/s00265-004-0870-x 633
Altmann, J., & Altmann, S. (1981). Physical maturation and age estimates of yellow baboons, 634
Papio cynocephalus, in Amboseli National Park, Kenya. American Journal of
635
Primatology, 1(4), 389–399. https://doi.org/10.1002/ajp.1350010404
636
Arifeen, S., Black, R., Caul, L., Antelman, G., & Baqui, A. (2001). Determinants of infant 637
growth in the slums of Dhaka: size and maturity at birth, breastfeeding and morbidity. 638
European Journal of Clinical Nutrition, 55, 167–178. Retrieved from
639
www.nature.com/ejcn 640
Bădescu, I., Wikberg, E. C., MacDonald, L. J., Fox, S. A., Vayro, J. V., Crotty, A., & Sicotte, 641
P. (2016). Infanticide pressure accelerates infant development in a wild primate. Animal 642
Behaviour, 114, 231–239. https://doi.org/10.1016/j.anbehav.2016.02.013
643
Baniel, A., Cowlishaw, G., & Huchard, E. (2018). Context-dependence of female 644
reproductive competition in wild chacma baboons. Animal Behaviour, 139, 37–49. 645
https://doi.org/https://doi.org/10.1016/j.anbehav.2018.03.001 646
Barthold, J., Fichtel, C., & Kappeler, P. (2009). What is it going to be? Pattern and potential 647
27
function of natal coat change in sexually dichromatic redfronted lemurs (Eulemur fulvus 648
rufus). American Journal of Physical Anthropology, 138(1), 1–10.
649
https://doi.org/10.1002/ajpa.20868 650
Borries, C., Larney, E., Lu, A., Ossi, K., & Koenig, A. (2008). Costs of group size: lower 651
developmental and reproductive rates in larger groups of leaf monkeys. Behavioral 652
Ecology, 19(6), 1186–1191. https://doi.org/10.1093/beheco/arn088
653
Brent, L. J. N., Teichroeb, J. A., & Sicotte, P. (2008). Preliminary assessment of natal 654
attraction and infant handling in wild Colobus vellerosus. American Journal of 655
Primatology, 70(1), 101–105. https://doi.org/10.1002/ajp.20478
656
Brockman, D., & van Schaik, C. (2005). Seasonality and reproductive function. In Cambridge 657
University Press (Ed.), Seasonality in Primates: Studies of Living and Extinct Human 658
and Non-Human Primates (pp. 269–305).
659
Calenge, C. (2006). The package “adehabitat” for the R software: A tool for the analysis of 660
space and habitat use by animals. Ecological Modelling, 197, 516–519. 661
https://doi.org/10.1016/j.ecolmodel.2006.03.017 662
Charpentier, M. J. E., Tung, J., Altmann, J., & Alberts, S. C. (2008). Age at maturity in wild 663
baboons: genetic, environmental and demographic influences. Molecular Ecology, 17, 664
2026–2040. https://doi.org/10.1111/j.1365-294X.2008.03724.x 665
Cheney, D. L., Seyfarth, R. M., Fischer, J., Beehner, J., Bergman, T., Johnson, S. E., … Silk, 666
J. B. (2004). Factors affecting reproduction and mortality among baboons in the 667
Okavango Delta, Botswana. International Journal of Primatology, 25(2), 401–428. 668
https://doi.org/0164-0291/04/0400-0401/0 669
Clutton-Brock, T., & Huchard, E. (2013). Social competition and its consequences in female 670
mammals. Journal of Zoology, 289(3), 151–171. https://doi.org/10.1111/jzo.12023 671
Coslovsky, M., & Richner, H. (2011). Predation risk affects offspring growth via maternal 672
28
effects. Functional Ecology, 25(4), 878–888. https://doi.org/10.1111/j.1365-673
2435.2011.01834.x 674
Cowlishaw, G., & Davies, J. G. (1997). Flora of the Pro-Namib Desert Swakop River 675
catchment, Namibia: community classification and implications for desert vegetation 676
sampling. Journal of Arid Environments, 36, 271–290. https://doi.org/0140– 677
1963/97/020271 678
Didan, K., Barreto Munoz, A., Solano, R., & Huete, A. (2015). MOD13A1 MODIS/Terra 679
Vegetation Indices 16-Day L3 Global 500m SIN Grid V006 [Data set].
680
https://doi.org/https://doi.org/10.5067/MODIS/MOD13A1.006 681
Dufour, D. L., & Sauther, M. L. (2002). Comparative and evolutionary dimensions of the 682
energetics of human pregnancy and lactation. American Journal of Human Biology, 683
14(5), 584–602. https://doi.org/10.1002/ajhb.10071
684
Emery Thompson, M. (2013). Comparative reproductive energetics of human and nonhuman 685
primates. Annual Review of Anthropology, 42(1), 287–304. 686
https://doi.org/10.1146/annurev-anthro-092412-155530 687
Fasiolo, M., Nedellec, R., Goude, Y., & Wood, S. N. (2018). Scalable visualisation methods 688
for modern Generalized Additive Models. ArXiv, 1–20. Retrieved from 689
http://arxiv.org/abs/1809.10632 690
Fedigan, L. M. (1983). Dominance and reproductive success in primates. Yearbook of 691
Physical Anthropology, 26, 91–129.
692
https://doi.org/https://doi.org/10.1002/ajpa.1330260506 693
Feng, X., Porporato, A., & Rodriguez-Iturbe, I. (2013). Changes in rainfall seasonality in the 694
tropics. Nature Climate Change, 3(9), 811–815. https://doi.org/10.1038/nclimate1907 695
Fontaine, J. J., & Martin, T. E. (2006). Parent birds assess nest predation risk and adjust their 696
reproductive strategies. Ecology Letters, 9(4), 428–434. https://doi.org/10.1111/j.1461-697
29 0248.2006.00892.x
698
Hohn, A. (2009). Age Estimation. In Encyclopedia of Marine Mammals (Second Edition) (pp. 699
11–17). 700
Hrdy, S. B. (1976). Care and exploitation of nonhuman primate infants by conspecifics other 701
than the mother. Advances in the Study of Behavior, 6, 101–158. Retrieved from 702
https://doi.org/10.1016/S0065-3454(08)60083-2 703
Husson, F., Josse, J., Le, S., & Maintainer, J. M. (2020). Package “FactoMineR”: 704
Multivariate Exploratory Data Analysis and Data Mining. Retrieved from
705
http://factominer.free.fr 706
Johnson, R., & Kapsalis, E. (1995). Determinants of postnatal weight in infant rhesus 707
monkeys: implications for the study of interindividual differences in neonatal growth. 708
American Journal of Physical Anthropology, 98(3), 343–353.
709
https://doi.org/10.1002/ajpa.1330980307 710
Johnson, S. (2003). Life history and the competitive environment: trajectories of growth, 711
maturation, and reproductive output among chacma baboons. American Journal of 712
Physical Anthropology, 120(1), 83–98. https://doi.org/10.1002/ajpa.10139
713
Josse, J., & Husson, F. (2016). missMDA: a package for handling missing values in 714
multivariate data analysis. Journal of Statistical Software, 70(1), 1–31. 715
https://doi.org/10.18637/jss.v070.i01 716
Koo, T. K., & Li, M. Y. (2016). A guideline of selecting and reporting intraclass correlation 717
coefficients for reliability research. Journal of Chiropractic Medicine, 15, 155–163. 718
https://doi.org/10.1016/j.jcm.2016.02.012 719
Lee, P. C. (1996). The meanings of weaning: growth, lactation, and life history. Evolutionary 720
Anthropology, 5(3), 87–98.
https://doi.org/https://doi.org/10.1002/(SICI)1520-721
6505(1996)5:3<87::AID-EVAN4>3.0.CO;2-T 722
30
Lee, P. C., Majluf, P., & Gordon, I. J. (1991). Growth, weaning and maternal investment from 723
a comparative perspective. Journal of Zoology, 225(1), 99–114. 724
https://doi.org/10.1111/j.1469-7998.1991.tb03804.x 725
Lindström, J. (1999). Early development and fitness in birds and mammals. Trends in Ecology 726
and Evolution, 14(9), 343–348. https://doi.org/10.1016/S0169-5347(99)01639-0
727
Lonsdorf, E. V. (2017). Sex differences in nonhuman primate behavioral development. 728
Journal of Neuroscience Research, 95(1), 213–221. https://doi.org/10.1002/jnr.23862
729
Lummaa, V. (2003). Early developmental conditions and reproductive success in humans: 730
downstream effects of prenatal famine birthweight, and timing of birth. American 731
Journal of Human Biology, 15(3), 370–379. https://doi.org/10.1002/ajhb.10155
732
Maestripieri, D. (2002). Parent–offspring conflict in primates. International Journal of 733
Primatology, 23(4), 2005–2007. https://doi.org/10.1023/A:1015537201184
734
Marshall, H. H., Carter, A. J., Ashford, A., Rowcliffe, J. M., & Cowlishaw, G. (2015). Social 735
effects on foraging behavior and success depend on local environmental conditions. 736
Ecology and Evolution, 5(2), 475– 492. https://doi.org/10.1002/ece3.1377
737
Martorell, R., & Gonzalez-Cossio, T. (1987). Maternal nutrition and birth weight. Yearbook of 738
Physical Anthropology, 30, 195–220.
739
Morris, P. (1972). A review of mammalian age determination methods. Mammal Review, 740
2(3), 69–104. https://doi.org/https://doi.org/10.1111/j.1365-2907.1972.tb00160.x
741
Palombit, R. A. (2003). Male infanticide in wild savannah baboons: adaptive significance and 742
intraspecific variation. In American Society of Primatologists (Ed.), Sexual selection and 743
reproductive competition in primates: new perspectives and directions (Jones CB, pp.
744
367–412). 745
Pusey, A. (2012). Magnitude and sources of variation in female reproductive performance. In 746
University of Chicago Press (Ed.), The Evolution of Primate Societies (pp. 343–366). 747