HAL Id: hal-00295582
https://hal.archives-ouvertes.fr/hal-00295582
Submitted on 20 Jan 2005
HAL is a multi-disciplinary open access
archive for the deposit and dissemination of
sci-entific research documents, whether they are
pub-lished or not. The documents may come from
teaching and research institutions in France or
abroad, or from public or private research centers.
L’archive ouverte pluridisciplinaire HAL, est
destinée au dépôt et à la diffusion de documents
scientifiques de niveau recherche, publiés ou non,
émanant des établissements d’enseignement et de
recherche français ou étrangers, des laboratoires
publics ou privés.
Observations of oxidation products above a forest imply
biogenic emissions of very reactive compounds
R. Holzinger, A. Lee, K. T. Paw, U. A. H. Goldstein
To cite this version:
R. Holzinger, A. Lee, K. T. Paw, U. A. H. Goldstein. Observations of oxidation products above a
forest imply biogenic emissions of very reactive compounds. Atmospheric Chemistry and Physics,
European Geosciences Union, 2005, 5 (1), pp.67-75. �hal-00295582�
SRef-ID: 1680-7324/acp/2005-5-67 European Geosciences Union
Chemistry
and Physics
Observations of oxidation products above a forest imply biogenic
emissions of very reactive compounds
R. Holzinger1, A. Lee1, K. T. Paw U2, and A. H. Goldstein1
1Department of Environmental Science, Policy, and Management (ESPM), Division of Ecosystem Sciences, University of
California, Berkeley, California, 94720-3110, USA
2Atmospheric Science Program, Department of Land, Air, and Water Resources, University of California, Davis, California,
95616-8717, USA
Received: 20 July 2004 – Published in Atmos. Chem. Phys. Discuss.: 15 September 2004 Revised: 3 December 2004 – Accepted: 6 January 2005 – Published: 20 January 2005
Abstract. Vertical gradients of mixing ratios of volatile or-ganic compounds have been measured in a Ponderosa pine forest in Central California (38.90◦N, 120.63◦W, 1315 m). These measurements reveal large quantities of previously un-reported oxidation products of short lived biogenic precur-sors. The emission of biogenic precursors must be in the range of 13–66 µmol m−2h−1 to produce the observed ox-idation products. That is 6–30 times the emissions of total monoterpenes observed above the forest canopy on a molar basis. These reactive precursors constitute a large fraction of biogenic emissions at this site, and are not included in current emission inventories. When oxidized by ozone they should efficiently produce secondary aerosol and hydroxyl radicals.
1 Introduction
Biogenic hydrocarbon emissions are the dominant source of reduced organic gases to the atmosphere, even larger than an-thropogenic pollution and biomass burning. Naturally these emissions play important roles in global, regional, and lo-cal atmospheric chemistry. In this paper we present evidence that a significant fraction of biogenic volatile organic com-pounds (VOC) emitted by a coniferous forest react within the canopy on time scales of a minute or less. Our results refer to a class of very reactive biogenic volatile organic compounds (VR-BVOC) that have not been accounted for in current bio-genic emission inventories or in atmospheric chemistry mod-els. Once airborne VR-BVOCs are too reactive to escape the forest canopy, however, their effect is important for several reasons: (i) their short lifetime makes them a previously un-accounted sink for reactive species like O3 and possibly a
source of OH; (ii) their oxidation products may be relatively stable and thus be transported, affecting atmospheric
chem-Correspondence to: R. Holzinger
(holzing@nature.berkeley.edu)
istry on much larger scales; (iii) VR-BVOC emission and/or their oxidation products are likely to partition into particles and contribute to secondary organic aerosol formation and growth.
The production and emission of VR-BVOCs by plants may have evolved in response to the atmospheric environ-ment. Scavenging atmospheric oxidants such as O3 that
could otherwise damage plant tissues is a potential defense mechanism for the plant. Aerosol formation and growth in-creases diffuse radiation and therefore inin-creases the light use efficiency of plants within the forest canopy. On a larger scale secondary organic aerosol formation and growth can impact the radiation balance, cloud formation and precipi-tation, and thus have feedbacks to ecosystems on a global scale.
Kurpius and Goldstein (2003) showed that the observed canopy scale ozone flux at this site can not be explained by stomatal uptake and dry deposition alone; half of the mea-sured flux in summer must be due to an additional sink, which was presumed to be chemical reaction with biogeni-cally emitted compounds. Fluxes of total monoterpenes mea-sured above the forest are only about 10% of the chemi-cal ozone sink on molar basis; however, both the chemichemi-cal ozone sink and the monoterpene emission exhibit the same temperature dependence. Forest thinning in spring 2000 caused measured terpene flux to increase by a factor of 10 (Schade and Goldstein, 2003); the chemical loss of ozone simultaneously increased by a similar factor (Goldstein et al., 2004). This set of observations strongly suggests that chemical ozone loss is linked with biogenic emission of VR-BVOCs, most likely terpenoid compounds. As will be dis-cussed below, the postulated compounds must have a very short lifetime (few minutes or less) and react with ozone (most likely also with OH) before leaving the forest canopy. Terpenoid compounds with such short lifetimes with respect to ozone mixing ratio have indeed been observed at our site (Goldstein et al. 2004).
68 R. Holzinger et al.: Observations of oxidation products 2 Experimental
Ecosystem scale fluxes of gases including CO2, O3 and
VOCs have been measured for several years at the same site (Blodgett Forest) on the western slope of the Sierra Nevada, California (38.90◦N, 120.63◦W, 1315 m elevation; Gold-stein et al., 2000; Lamanna and GoldGold-stein, 1999; Schade and Goldstein, 2001). The plantation is located 75 km down-wind (northeast) of Sacramento and receives anthropogeni-cally impacted air masses rising from the valley below during the day (Bauer et al., 2000). Anthropogenic pollutants, such as carbon monoxide, oxides of nitrogen, and many volatile organic compounds we measure, are transported to the site from sources that are typically 5–6 h transport time away; therefore their mixing ratios are lower before noon and rise in the afternoon coinciding with the arrival of polluted air from the Sacramento region. This has been discussed in detail in several papers reporting observations from Blod-gett Forest (e.g. Lamanna and Goldstein, 1999; Dillon et al., 2002). Ozone concentrations largely follow the diurnal pattern of transported compounds. Summer mixing ratios typically were 50 nmol/mol before noon and 100 nmol/mol in the afternoon. At night the wind usually shifts towards the west and air masses descend from the sparsely populated Sierra Nevada to the site. The site was planted with Pinus ponderosa L. in 1990, interspersed with a few individuals of Douglas fir, white fir, California black oak, and incense cedar. Average tree height was 4.8 (median) in 2003; the canopy height was 6.4 m, a height exceeded by 20% of the trees. The understory was composed primarily of manzanita (Arctostaphylos spp.) and whitethorn (Ceonothus cordula-tus) shrubs.
Measurements were made at the Blodgett Forest site for 47 days from 25 June–23 September 2003. VOC mixing ratios were measured in situ by Proton-Transfer-Reaction Mass Spectrometry (PTR-MS), which has been described elsewhere in detail (Lindinger et al., 1998). During each hour air was sampled through 6 individual gas inlets each of which were protected by a Teflon filter (PFA holder, PTFE membrane, pore size 2 µm). One inlet was used to sample air at 12.5 m from 0 to 30 min for eddy-covariance flux mea-surements of total monoterpenes; for 9 days (12–23 Septem-ber 2003) fluxes of 2-Methyl-3-buten-2-ol (MBO) were mea-sured in addition. A sample flow of 10 L/min was main-tained by a mass flow controller (MKS Instruments) and the Teflon filter was significantly blackened due to dust and par-ticles when replaced typically every other week. Five inlets were used to sample vertical gradients at height-levels within (1.1 m, 3.1 m, 4.9 m) and above (8.75 m, 12.5 m) the forest canopy sequentially for 6 min each during the second 30 min of each hour (Fig. 1). The 5 gradient inlets were identically designed; each consisted of 30 m PFA tubing (ID ∼4 mm) protected by a Teflon filter and a sample flow of 1 L/min was maintained at all times through each sample tube. The Teflon filters on the gradient inlets were replaced every 3–6 weeks.
21
Figure 1. VOC-gradients were measured during the second 30 minutes of each hour. The
PTR -MS sampled from 5 individual inlets (B-F) positioned at 1.1, 3.1, 4.9, 8.75, and 12.5m
above ground. Canopy height was 6.4m.
Fig. 1. VOC-gradients were measured during the second 30 min of
each hour. The PTR-MS sampled from 5 individual inlets (B-F) positioned at 1.1, 3.1, 4.9, 8.75, and 12.5 m above ground. Canopy height was 6.4 m.
Usually no blackening was observed on used filters, and we did not see changes in any signal of the reported compounds after changing the filters. In September 2003 we divided the sample time between the 2 inlets at 12.5 m (one gradient inlet and the eddy-covariance flux inlet) and for these two inlets at the same height level with different flow rates, and thus dif-ferent particulate loading on the filters, none of the reported compounds showed differences in concentration.
The instrumental background levels were measured by di-recting the sample flow through a catalytic converter during minutes 53–55 of each hour. The converter consisted of a stainless steel tube filled with Platinum-coated quartz wool (Shimadzu) heated to 350◦C, which efficiently removed the VOCs from the sample. The catalytic converter did not re-move water vapor from the sample, which is important be-cause the background impurities may depend on the humid-ity of the sampled air.
The gradient measurements were made at a frequency of approximately one scan per minute. Measuring in the se-lected ion mode we chose about 50 masses from 18–220 amu (atomic mass unit) with a dwell time on each mass of 1 s. Atmos. Chem. Phys., 5, 67–75, 2005 www.atmos-chem-phys.org/acp/5/67/
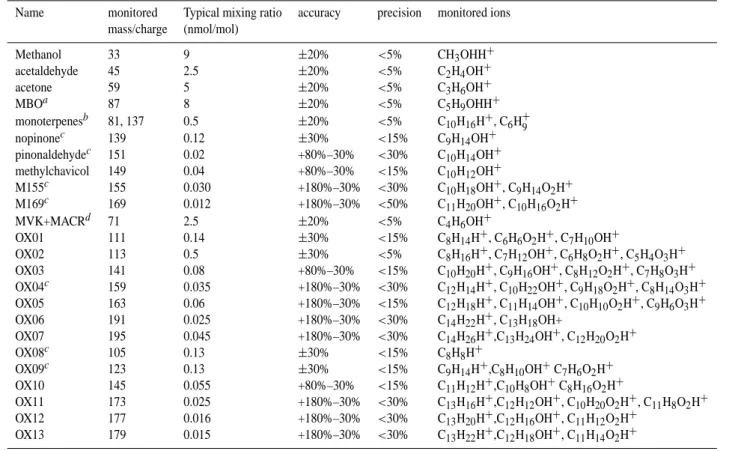
Table 1. Composition of compounds measured at the Blodgett Forest site in summer 2003.
Name monitored Typical mixing ratio accuracy precision monitored ions mass/charge (nmol/mol) Methanol 33 9 ±20% <5% CH3OHH+ acetaldehyde 45 2.5 ±20% <5% C2H4OH+ acetone 59 5 ±20% <5% C3H6OH+ MBOa 87 8 ±20% <5% C5H9OHH+ monoterpenesb 81, 137 0.5 ±20% <5% C10H16H+, C6H+9 nopinonec 139 0.12 ±30% <15% C9H14OH+ pinonaldehydec 151 0.02 +80%–30% <30% C10H14OH+ methylchavicol 149 0.04 +80%–30% <15% C10H12OH+ M155c 155 0.030 +180%–30% <30% C10H18OH+, C9H14O2H+ M169c 169 0.012 +180%–30% <50% C11H20OH+, C10H16O2H+ MVK+MACRd 71 2.5 ±20% <5% C4H6OH+ OX01 111 0.14 ±30% <15% C8H14H+, C6H6O2H+, C7H10OH+ OX02 113 0.5 ±30% <5% C8H16H+, C7H12OH+, C6H8O2H+, C5H4O3H+ OX03 141 0.08 +80%–30% <15% C10H20H+, C9H16OH+, C8H12O2H+, C7H8O3H+ OX04c 159 0.035 +180%–30% <30% C12H14H+, C10H22OH+, C9H18O2H+, C8H14O3H+ OX05 163 0.06 +180%–30% <15% C12H18H+, C11H14OH+, C10H10O2H+, C9H6O3H+ OX06 191 0.025 +180%–30% <30% C14H22H+, C13H18OH+ OX07 195 0.045 +180%–30% <30% C14H26H+,C13H24OH+, C12H20O2H+ OX08c 105 0.13 ±30% <15% C8H8H+ OX09c 123 0.13 ±30% <15% C9H14H+,C8H10OH+C7H6O2H+ OX10 145 0.055 +80%–30% <15% C11H12H+,C10H8OH+C8H16O2H+ OX11 173 0.025 +180%–30% <30% C13H16H+,C12H12OH+, C10H20O2H+, C11H8O2H+ OX12 177 0.016 +180%–30% <30% C13H20H+,C12H16OH+, C11H12O2H+ OX13 179 0.015 +180%–30% <30% C13H22H+,C12H18OH+, C11H14O2H+ a2-Methyl-3-butene-2-ol; bsum of total monoterpenes
cthe diurnal course of these compounds shows features that are indicative of partitioning into the particle phase. dsum of methylvinylketone and methacrolein.
Typically 5 scans per level were used to compute average datasets on an hourly basis. Table 1 lists the m/z mon-itored and the corresponding compounds. For methanol, acetaldehyde, 2-Methyl-3-butene-2-ol (MBO), acetone, to-tal monoterpenes, and the sum of methyl vinyl ketone and methacrolein (MVK+MACR) we have used experimen-tally determined reaction rate constants. Gravimetrically mixed gas-standards of acetaldehyde, MBO, acetone, MVK, MACR, and several monoterpenes were automatically mea-sured on a regular basis to cross-check the correct calcu-lation of the concentration. The accuracy for these com-pounds is better than ±20%. For all other comcom-pounds the concentration has been computed using calculated values for the collision rate constant which should equal the reaction rate constant within ±30%. In addition to our automated standard additions we also measured standards of nopinone,
β-carophyllene, and methylchavicol and found our system to be reliable for measuring these sort of compounds. The transmission efficiency of the mass spectrometer was regu-larly measured up to m/z values of 140. Extrapolating the
transmission efficiency above this value may result in over-estimation because an insufficiently tuned mass scale of the mass spectrometer and aging of the secondary electron multi-plier (SEM) reduced transmission efficiency of high masses. Therefore we may have underestimated mixing ratios for compounds with molecular weights exceeding 140 amu, and accounted for this by using asymmetrical accuracy levels in Table 1.
3 Results and discussion 3.1 Observations
Figures 2a–d shows vertical gradients and diurnal cycles for 4 compounds. To create these images we interpolated median values calculated from the 47 days for each compound, hour and height-level. We found that diurnal patterns were clearer using median rather than mean mixing ratios; however both the patterns and absolute values were very similar.
70 R. Holzinger et al.: Observations of oxidation products
22
Figure 2. Vertical gradients for individual compounds. Measurements over 47 days were
averaged to produce profiles representative of summer 2003. Monoterpenes (a) and MBO (b)
are examples of primary biogenic emissions. Decreasing mixing ratios during the day are
indicative of heterogeneous chemistry of nopinone (c). Highest concentrations above the
canopy identify OX02 (d) as an oxidation product with a strong local source.
Fig. 2. Vertical gradients for individual compounds. Measurements over 47 days were averaged to produce profiles representative of summer
2003. Monoterpenes (a) and MBO (b) are examples of primary biogenic emissions. Decreasing mixing ratios during the day are indicative of heterogeneous chemistry of nopinone (c). Highest concentrations above the canopy identify OX02 (d) as an oxidation product with a strong local source.
Higher concentrations in the canopy provide a clear sig-nature showing that terpenes (Fig. 2a) are emitted from the ecosystem. Temperature is the main driver for monoter-pene emissions. The short lifetimes of termonoter-penes (minutes to hours) result in low concentrations during the day as com-pared to nighttime when both oxidation and vertical mixing are slower.
MBO (Fig. 2b) is another biogenically emitted compound whose emission has been previously reported from this site (Schade et al., 2000). In contrast to monoterpenes, the emis-sion of MBO also requires light; therefore both the mixing ratios and gradients reach minimum values at night when no emission occurs.
Nopinone (Fig. 2c) is known to be produced from the ox-idation of β-pinene by OH. The reported molar yields vary from 0.27 (Hakola et al., 1994) to 0.79 (Hatakeyama et al., 1991). Its concentration was generally highest above the trees at the 8.75 m level. The same trend was observed for pinonaldehyde which is the equivalent product formed from α-pinene oxidation. Considering gas phase chem-istry, increasing mixing ratios would be expected during
the day since the OH-lifetime of nopinone is about 5 times that of β-pinene (Fuentes et al., 2000) and relatively con-stant β-pinene concentrations were usually observed from morning through afternoon. However, nopinone concentra-tions were highest in the morning (09:00–10:00 PST, Pacific Standard Time, i.e. UTC-8 hrs) and lowest in the afternoon (15:00–17:00 PST). Assuming yields of 0.27 and 0.79 re-spectively, daytime levels of β-pinene of 125 pmol/mol (25% of total monoterpenes), and considering gas-phase chem-istry alone, nopinone mixing ratios of 160–460 pmol/mol would be expected. However daytime levels were only 85– 120 pmol/mol, and therefore other loss mechanisms must ex-ist. The decrease of nopinone from morning to afternoon is anti-correlated with increases in aerosol concentration over the same period. We conclude that the decrease of nopinone and pinonaldehyde through the day provides clear evidence of partitioning into the particle phase. This is consistent with observations by Kavouras et al. (1999), who found nopinone in both the gas and the particle phase in a forest environment. The signal detected at mass 113 (OX02, Fig. 2d) is repre-sentative of a whole class of compounds. These compounds Atmos. Chem. Phys., 5, 67–75, 2005 www.atmos-chem-phys.org/acp/5/67/
23 Figure 3. OX08 is an example oxidation product indicating heterogeneous chemistry: While rising ozone levels and increasing solar radiation increase its production, mixing ratios decrease after reaching a maximum at 1000 PST. In analogy to observations of nopinone mixing ratios we infer that partitioning into the particle phase is a likely cause for the unexpected decrease from morning to afternoon
Fig. 3. OX08 is an example oxidation product indicating heterogeneous chemistry: While rising ozone levels and increasing solar radiation
increase its production, mixing ratios decrease after reaching a maximum at 10:00 PST. In analogy to observations of nopinone mixing ratios we infer that partitioning into the particle phase is a likely cause for the unexpected decrease from morning to afternoon.
behave similarly, and have so far only been identified by their mass to charge ratios (see Table 1). Their diurnal and verti-cal profiles typiverti-cally share the following characteristics: (i) higher concentration above than within the canopy; (ii) sig-nificantly lower concentration at both the top and the bot-tom levels; and (iii) nighttime concentrations significantly lower than daytime concentrations. Because the concentra-tion maximum is spatially separated from any primary emis-sion source, these compounds must be oxidation products of primary biogenic compounds whose emissions are highest during daytime. Lower concentrations at the bottom level suggest efficient dry deposition of these compounds. How-ever, their vertical profiles are not consistent with the profiles observed for primary emissions such as MBO and monoter-penes even when considering a balance between soil depo-sition and direct biogenic emission: the spatial separation of the region of highest concentrations (e.g. 5–9 m for OX02, Fig. 2d) from primary emission sources (average tree height
<4.9 m, 80% of the trees below 6.4 m) is a significant piece of evidence that needs to be explained when considering their source. We do not think it is possible to explain the ob-served profile without assuming these compounds are oxi-dation products. However, possible primary emission cannot be completely ruled out for some of the “OX”-products listed in Table 1 because their maximum concentration was not clearly above the forest canopy which is the case for OX01, OX08 (see Fig. 3), OX09, and OX11-OX13.
In addition, another strong piece of evidence for the OX-products not being primary emission is provided by enclo-sure experiments that were also performed in summer 2003. Branches of the most abundant plant species were enclosed in a Teflon chamber and the chamber air was flushed completely approximately once per minute. While mixing ratios of primary emissions (e.g. methanol, monoterpenes, sesquiter-penes, MBO, etc.) were dramatically enhanced in the cham-ber to multiple times the concentration in ambient air, mixing ratios of oxidation products like OX02 did not exhibit signif-icant increases inside the chamber.
During night the production of this type of compounds continues, however, at a much slower rate; for comparison consider that the emission rate of monoterpenes during night is reduced too; nevertheless concentrations are much higher at night mainly due to reduced vertical mixing of the surface layer. The concentration of OX02 slightly increases during the day; a feature which is not shared by all compounds of this group. E.g. the mixing ratio of OX08 (Fig. 3) at 4– 8 m continuously decreases after 11:00 or 12:00 PST while OX02 is increasing. Similar to our argument for nopinone and pinonaldehyde, we infer that some of the oxidation prod-ucts (identified in Table 1) efficiently partition into the parti-cle phase.
Potential artifacts due to ozone or water in our inlet sys-tem must be considered. To make sure the sample flow path would be the same for each sampling height, we designed all five gradient inlets identically (same flow rate at all times, www.atmos-chem-phys.org/acp/5/67/ Atmos. Chem. Phys., 5, 67–75, 2005
72 R. Holzinger et al.: Observations of oxidation products
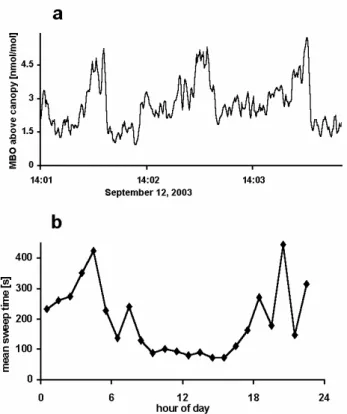
24 Figure 4. (a) Ramp structures are regularly observed in high time resolution measurements of MBO. Gusts caused by wind shear periodically sweep the forest canopy and are observed in the MBO data as sharp decreases in concentration (~14:01:40, 14:02:40, and 14:03:40). (b) Diurnal cycle of the median sweep time in summer 2003. During daytime the median sweep time is a reasonable measure for the turnover time of air in the canopy.
Fig. 4. (a) Ramp structures are regularly observed in high time
resolution measurements of MBO. Gusts caused by wind shear pe-riodically sweep the forest canopy and are observed in the MBO data as sharp decreases in concentration (∼14:01:40, 14:02:40, and 14:03:40). (b) Diurnal cycle of the median sweep time in summer 2003. During daytime the median sweep time is a reasonable mea-sure for the turnover time of air in the canopy.
same materials, filters, valves and length of tubing). During daytime ozone vertical gradients were small (less than 10%). The vertical gradients of water concentration were similar to those of primary emissions (e.g. monoterpenes), with high-est concentrations at the bottom level and sequentially lower concentrations at higher levels. The vertical gradients of ox-idation products (OX01-OX13, Table 1) were not correlated with water or ozone, indicating there are not artifacts in our profiles from either of these gases.
3.2 Emission and production
The discovery of high concentrations and large gradients of oxidation products in the forest canopy are important find-ings; they provide firm evidence of unmeasured emission of very reactive biogenic volatile organic compounds. In the following discussion we estimate production rates for the ox-idation products, and we also assess emission rates of the un-derlying VR-BVOCs that are needed to explain the observed oxidation products.
In order to calculate an emission or production rate from a gradient profile, we used a simplified surface renewal model
(Paw U et al., 1995). The surface renewal method, specif-ically based on the coherent structure/ramp repetition dura-tion and amplitude of ramp patterns for any scalar above a rough surface, has been tested numerous times, e.g. Spano et al. (2000), Zapata and Martinez-Cob (2002).
If chemical or physical loss is negligible on time scales of air mixing through the canopy the production rate (PV OC)of
a trace gas can be calculated according to
PV OC =
EAV OC
tmix
, (1)
where tmix is the mean mixing time of the air in the
gradi-ent profile and EAV OCis the excess amount of the trace gas
observed within the profile. The excess amount per unit of surface area is calculated according to
EAV OC = h Z 0 [V OC] dz − h [V OC]B , (2)
where h is the cut off height above the canopy (highest mea-surement level, 12.5 m); [VOC] is the concentration of the trace gas at height z; and [VOC]Bis the background
concen-tration measured at 12.5 m. However, some of the oxidation products OX01-OX13 were still significantly above the local background at 12.5 m (see Fig. 2d); in these cases the 1.1 m level has been used as local background whenever the con-centration was lower than at the 12.5 m level. This simple model is a reasonable approach for calculating production rates from vertical gradient data as presented here which are averaged over many similar days.
We assumed that tmix should equal the average turnover
time (or interval between sweeps) of air within the canopy. Figure 4a shows the evolution of MBO concentration over 3 min during which typical ramp structures have been ob-served. Ramp structures occur over rough surfaces for any scalar which is exchanged or locally produced. In the case of compounds emitted from forests a ramp feature is charac-terized by a gradual rise in concentration followed by a rel-atively sharp drop. These structures are associated with tur-bulent coherent structures which scale with wind shear at the canopy top (Chen and Blackwelder, 1978); the wind shear causes updrafts at lower heights which, in return, causes in-stability unwinding in periodic gusts or sweeps. In many cases this is the prevailing mechanism for gas exchange in the canopy. Paw U et al. (1993) found that the average sweep time is a function of the canopy shear scale (average wind speed at canopy height divided by canopy height). We as-sumed tmix could be equated to the median value of the
in-terval between scalar ramps, obtained using structure func-tion analysis (Snyder et al., 1996) of the turbulent traces of temperature. The median ramp repetition intervals of ap-proximately 1.5 minutes during the day, and 3–7 min at night (calculated using structure function analysis, Fig. 4b) were generally consistent with estimates of the repetition interval Atmos. Chem. Phys., 5, 67–75, 2005 www.atmos-chem-phys.org/acp/5/67/
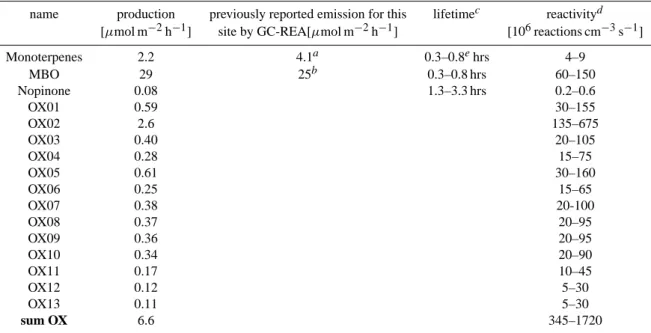
Table 2. Production/emission, lifetime, and reactivity of primary emissions and oxidation products.
name production previously reported emission for this lifetimec reactivityd [µmol m−2h−1] site by GC-REA[µmol m−2h−1] [106reactions cm−3s−1]
Monoterpenes 2.2 4.1a 0.3–0.8ehrs 4–9 MBO 29 25b 0.3–0.8 hrs 60–150 Nopinone 0.08 1.3–3.3 hrs 0.2–0.6 OX01 0.59 30–155 OX02 2.6 135–675 OX03 0.40 20–105 OX04 0.28 15–75 OX05 0.61 30–160 OX06 0.25 15–65 OX07 0.38 20-100 OX08 0.37 20–95 OX09 0.36 20–95 OX10 0.34 20–90 OX11 0.17 10–45 OX12 0.12 5–30 OX13 0.11 5–30 sum OX 6.6 345–1720
aSchade et al. (1999), daytime average of the sum of 1-3-carene, α-pinene and limonene, July to October 1998. bSchade and Goldstein (2001), daytime averages, summer 1999.
cWith rate constants at 298 K (see Fuentes et al. (2000); Atkinson (2000) and references therein) and daytime OH concentrations of 5– 13×106molecules per cm3(Dreyfus et al., 2002).
dIn the case of OX01-OX13 reactivity refers to the reactivity of the precursor compounds. The range reflects oxidation product yields of 10–50%.
eassuming α-pinene, β-pinene and 3-carene at a ratio of 7:9:4; these compounds constitute over 60% of total monoterpenes (Lee et al., 2004).
of turbulent coherent structures using estimated wind shear and Paw U et al. (1993), thus lending confidence to these estimates from two independent techniques.
To test our approach (Eqs. 1 and 2) we calculated emis-sions of total monoterpenes and MBO, for comparison with eddy-flux measurements. During daytime when most emis-sion occurs we found reasonable agreement of ±30% be-tween the two methods. The fluxes of total monoterpenes and MBO obtained by the two independent methods are in agreement with previous measurements at the site (Schade and Goldstein, 2001; Schade et al., 2000; Schade et al., 1999). These comparisons show that our adapted surface re-newal approach yields reliable results, however, it remains disputable whether the accuracy is +/−30% (our estimate) or slightly higher or lower.
We then used averages of the whole 47-day dataset (10:00–16:00 PST) to calculate production rates for the ob-served oxidation products (Table 2). In order to account for the potential underestimation of compounds with masses above 140 amu we adjusted the mixing ratios according to the range of accuracy given in Table 1: e.g. a mixing ratio of 60 pmol/mol was measured for OX10 (145 amu); in Table 1 we stated a accuracy of +80% and −30%; so we would use a mixing ratio of 75 pmol/mol (i.e. [60×1.8+60×0.7]/2) to calculate the production according to Eqs. (1) and (2).
The production for the individual oxidation products ranges from 0.1 to 2.6 µmol m−2h−1; together they sum up to 6.6 µmol m−2h−1. The actual production rate for these oxidation products may be considerably higher if their life-times are in the range of tmix. Nevertheless, the value of
6.6 µmol m−2h−1 is at least 3 times the emission of total monoterpenes measured above the canopy; the underlying VR-BVOC emission must be at least that high. It is, how-ever, unrealistic to assume that all (100%) of the VR-BVOC emission is converted into the measured oxidation products. As discussed above the oxidation products are deposited to the soil and they may be lost onto particles; furthermore, many reaction pathways may yield products that could not be detected with our current instrumentation. We assume a more realistic photochemical production yield would be 10–50% for the measured oxidation products. Given this yield range, the underlying VR-BVOC emission must be 13– 66 µmol m−2h−1, which on a molar basis is 6–30 times the emission of total monoterpenes measured above the canopy. Presumably the VR-BVOCs are terpenoid compounds and therefore contain at least 10 carbon atoms per molecule. Given that average daytime CO2flux was 28 mmol m−2h−1,
VR-BVOC emission would be 0.5–2.4% of the net C uptake as CO2. On a carbon basis, the VR-BVOCs exceed the
emis-sion of MBO (0.5% of net uptake of CO2)and constitute the
largest class of biogenic emissions at our site.
74 R. Holzinger et al.: Observations of oxidation products 3.3 Reactivity
Using typical mixing ratios given in Table 1 and Lamanna and Goldstein (1999), and lifetimes based on estimated daytime OH concentrations of 0.5–1.3×10⁷molecules cm−3
(Dreyfus et al., 2002) we calculated the total reactivity of commonly measured compounds to be of order 8.5– 22×107reactions cm−3s−1; with MBO, isoprene+products, monoterpenes, acetaldehyde, and methanol constituting about 98% of this reactivity (see also Table 2). The re-activity of the VR-BVOCs must equal the production rate of the oxidation products OX01-OX13 divided by the yield. We calculated their area-specific reactivity and divided by the canopy height of 6.5 m to convert it to a volumetric ba-sis. Conservatively assuming a yield of 10–50%, the reac-tivity of the VR-BVOCs is 3.5–17×108reactions cm−3s−1, which is about 2–10 times the reactivity of the sum of all other compounds. Kurpius and Goldstein (2003) in-ferred that during summer days ∼20 µmol m−2h−1 of the
total ozone flux into the ecosystem was due to chemical loss in the forest canopy. To maintain this flux a reactiv-ity of 5.25×10⁸reactions cm−3s−1is needed throughout the canopy, which is consistent with our results.
Ozone chemistry must play an important role in the for-mation of the observed oxidation products. Typical lev-els of 50–100 nmol/mol O3 during the day result in
at-mospheric lifetimes of many reactive terpenes of less than one minute; some of these have been qualitatively identi-fied as biogenic emission from local plant species (Gold-stein et al., 2004). Conversely, estimated OH levels of 0.5– 1.3×10⁷molecules cm−3(Dreyfus et al., 2002) result in life-times no shorter than 5 minutes for the most reactive com-pounds. Although we argue that estimated OH levels above the canopy are too low to cause observed levels of oxida-tion products, OH-reacoxida-tions certainly contribute to the short lifetime of unmeasured precursor compounds. Furthermore, according to (Paulson et al., 1999) reactions of ozone with alkenes produce OH-radicals; and in this way OH reactions can play a more significant role by amplifying the ozone ini-tiated degradation process.
4 Conclusions
Emission of VR-BVOC has been previously reported: Ci-ccioli et al. (1999) observed β-caryophyllene emissions in plant enclosures which were not observable above the for-est canopy presumably because of their short lifetime with respect to reaction with ozone. The novelty we are report-ing here is the magnitude of VR-BVOC emission. Substan-tial VR-BVOC emissions have been postulated due to mea-surements that were otherwise hard to explain. Faloona et al. (2001) observed elevated OH concentrations at night cor-related with O3mixing ratios in a northern Michigan mixed
deciduous forest in 1998, and suggested the OH was likely
produced from reactions of O3 with unmeasured terpenes.
O’Dowd et al. (2002) suggested new particle growth mea-sured in a boreal forest in Finland in 2000 occurred from condensation or coagulation of terpene oxidation products. Most recently, Di Carlo et al. (2004) showed that the total OH reactivity above a northern Michigan deciduous forest in summer 2000 exceeded what could be explained by known VOCs, and the excess increased exponentially with temper-ature inferring that unknown biogenic terpenes were likely responsible. In light of our observations we infer that in each of these cases VR-BVOC could indeed be responsi-ble. These observations suggest that our findings will hold for other ecosystems, thus global terpene emission and sec-ondary organic aerosol formation likely is larger than previ-ously assumed.
Acknowledgements. We want to thank all reviewers for their time
and constructive comments. We were pleased at the amount of careful consideration and discussion that was generated from our novel observations and interpretations (see http://overview.sref.org/ 1680-7375/acpd/2004-4-5345).
This research was funded by the National Science Foundation Atmospheric Chemistry Program (award ATM-0119510), the California Air Resources Board (ARB contract numbers 98-328 and 00-732), and the University of California Agricultural Ex-periment Station. We thank M. McKay, B. Heald, D. Rambeau, and the Blodgett Forest crew for operational support, and Sierra Pacific Industries for use of their land and assistance in field site operations. We also thank R. Cohen, P. Crutzen, and I. Faloona for insightful comments on drafts of this article. Partial support for K. Paw U came from the Western Regional Center (WESTGEC) of the National Institute for Global Environmental Change (NIGEC) through the Environmental Sciences Division, PER program, of the U.S. Department of Energy (DOE) (Cooperative Agreement No. DE-FC03-90ER61010). Any opinions, findings and conclusions or recommendations expressed herein are those of the authors and do not necessarily reflect the view of the DOE.
Edited by: A. B. Guenther
References
Atkinson, R.: Atmospheric chemistry of VOCs and NOx, Atmos. Environ., 34 (12–14), 2063–2101, 2000.
Bauer, M. R., Hultman, N. E., Panek, J. A., and Goldstein, A. H.: Ozone deposition to a ponderosa pine plantation in the Sierra Nevada Mountains (CA): A comparison of two different climatic years, J. Geophys. Res., 105 (D17), 22 123–22 136, 2000. Chen, C. H. P. and Blackwelder, R. F.: Large-Scale Motion in a
Turbulent Boundary-Layer - Study Using Temperature Contam-ination, J. Fluid Mech., 89 (NOV), 1–31, 1978.
Ciccioli, P., Brancaleoni, E., Frattoni, M., Di Palo, V., Valentini, R., Tirone, G., Seufert, G., Bertin, N., Hansen, U., Csiky, O., Lenz, R., and Sharma, M.: Emission of reactive terpene compounds from orange orchards and their removal by within-canopy pro-cesses, J. Geophys. Res., 104 (D7), 8077–8094, 1999.
Di Carlo, P., Brune, W. H., Martinez, M., Harder, H., Lesher, R., Ren, X., Thornberry, T., Carroll, M. A., Young, V., Shepson, P.
B., Riemer, D., Apel, E., and Campbell, C.: Missing OH Re-activity in a Forest: Evidence for Unknown Reactive Biogenic VOCs, Science, 304, 722–725, 2004.
Dillon, M. B., Lamanna, M. S., Schade, G. W., Goldstein, A. H., and Cohen, R. C.: Chemical evolution of the Sacramento urban plume: Transport and oxidation, J. Geophys. Res., 107 (D5-6), doi:10.1029/2001JD000969, 2002.
Dreyfus, G. B., Schade, G. W., and Goldstein, A. H.: Observational constraints on the contribution of isoprene oxidation to ozone production on the western slope of the Sierra Nevada, California, J. Geophys. Res., 107 (D19), doi:10.1029/2001JD001490, 2002. Faloona, I., Tan, D., Brune, W., Hurst, J., Barket, D., Couch, T. L., Shepson, P., Apel, E., Riemer, D., Thornberry, T., Carroll, M. A., Sillman, S., Keeler, G. J., Sagady, J., Hooper, D., and Pater-son, K.: Nighttime observations of anomalously high levels of hydroxyl radicals above a deciduous forest canopy, J. Geophys. Res., 106 (D20), 24 315–24 333, 2001.
Fuentes, J. D., Lerdau, M., Atkinson, R., Baldocchi, D., Botten-heim, J. W., Ciccioli, P., Lamb, B., Geron, C., Gu, L., Guenther, A., Sharkey, T. D., and Stockwell, W.: Biogenic hydrocarbons in the atmospheric boundary layer: A review, B. Am. Meteorl. Soc., 81 (7), 1537–1575, 2000.
Goldstein, A. H., Hultman, N. E., Fracheboud, J. M., Bauer, M. R., Panek, J. A., Xu, M., Qi, Y., Guenther, A. B., and Baugh, W.: Effects of climate variability on the carbon dioxide, water, and sensible heat fluxes above a ponderosa pine plantation in the Sierra Nevada (CA), Agr. Forest Meteorol., 101 (2-3), 113–129, 2000.
Goldstein, A. H., McKay, M., Kurpius, M. R., Schade, G. W., Lee, A., Holzinger, R., and Rasmussen, R.: Forest thinning experi-ment confirms ozone deposition to forest canopy is dominated by reaction with biogenic VOCs, Geophys. Res. Lett., 31 (L22106), doi:10.1029/2004GL021259, 2004.
Hakola, H., Arey, J., Aschmann, S. M., and Atkinson, R.: Product Formation from the Gas-Phase Reactions of Oh Radicals and O3 with a Series of Monoterpenes, J. Atmos. Chem., 18 (1), 75–102, 1994.
Hatakeyama, S., Izumi, K., Fukuyama, T., Akimoto, H., and Washida, N.: Reactions of Oh with Alpha-Pinene and Beta-Pinene in Air - Estimate of Global Co Production from the Atmo-spheric Oxidation of Terpenes, J. Geophys. Res., 96 (D1), 947– 958, 1991.
Kavouras, I. G., Mihalopoulos, N., and Stephanou, E. G.: For-mation and gas/particle partitioning of monoterpenes photo-oxidation products over forests, Geophys. Res. Lett., 26 (1), 55– 58, 1999.
Kurpius, M. R. and Goldstein, A. H.: Gas-phase chemistry dom-inates O-3 loss to a forest, implying a source of aerosols and hydroxyl radicals to the atmosphere, Geophys. Res. Lett., 30 (7), doi:10.1029/2002GL016785, 2003.
Lamanna, M. S. and Goldstein, A. H.: In situ measurements of C-2-C-10 volatile organic compounds above a Sierra Nevada pon-derosa pine plantation, J. Geophys. Res., 104 (D17), 21 247– 21 262, 1999.
Lee, A., Schade, G. W., Holzinger, R., and Goldstein, A. H.: A comparison of new measurements of total monoterpene flux with improved measurements of speciated monoterpene flux, Atmos. Chem. Phys. Discuss., 4, 7819–7835, 2004,
SRef-ID: 1680-7375/acpd/2004-4-7819.
Lindinger, W., Hansel, A., and Jordan, A.: On-line monitoring of volatile organic compounds at pptv levels by means of proton-transfer-reaction mass spectrometry (PTR-MS) - Medical appli-cations, food control and environmental research, Int. J. Mass Spectrom., 173 (3), 191–241, 1998.
O’Dowd, C. D., Aalto, P., Hameri, K., Kulmala, M., and Hoff-mann, T.: Aerosol formation – Atmospheric particles from or-ganic vapours, Nature, 416 (6880): 497–498, 2002.
Paulson, S. E., Chung, M. Y., and Hasson, A. S.: OH radical forma-tion from the gas-phase reacforma-tion of ozone with terminal alkenes and the relationship between structure and mechanism, J. Phys. Chem. A, 103 (41), 8125–8138, 1999.
Paw U, K. T., Brunet, Y., Collineau, S., Shaw, R. H., Maitani, T., Qui, J., and Hipps, L.: Corrigendum: On Coherent Structures in Turbulence above and within Agricultural Plant Canopies, Agr. Forest Meteorol., 63 (1-2), 127–127, 1993.
Paw U, K. T., Qiu, J., Sun, H. B., Watanabe, T., and Brunet, Y.: Sur-face Renewal Analysis - a New Method to Obtain Scalar Fluxes, Agr. Forest Meteorol., 74 (1-2), 119–137, 1995.
Schade, G. W., and Goldstein, A. H.: Fluxes of oxygenated volatile organic compounds from a ponderosa pine plantation, J. Geo-phys. Res., 106 (D3), 3111–3123, 2001.
Schade, G. W. and Goldstein, A. H.: Increase of monoter-pene emissions from a pine plantation as a result of mechanical disturbances, Geophys. Res. Lett., 30 (7), doi:10.1029/2002GL016138, 2003.
Schade, G. W., Goldstein, A. H., Gray, D. W., and Lerdau, M. T.: Canopy and leaf level 2-methyl-3-buten-2-ol fluxes from a pon-derosa pine plantation, Atmos. Environ., 34 (21), 3535–3544, 2000.
Schade, G. W., Goldstein, A. H., and Lamanna, M. S.: Are monoter-pene emissions influenced by humidity?, Geophys. Res. Lett., 26 (14), 2187–2190, 1999.
Snyder, R. L., Spano, D., and Paw U, K. T.: Surface renewal analy-sis for sensible and latent heat flux density, Bound.-Lay. Meteo-rol., 77 (3-4), 249–266, 1996.
Spano, D., Snyder, R. L., Duce, P., and Paw U, K. T.: Estimating sensible and latent heat flux densities from grapevine canopies using surface renewal, Agr. Forest Meteorol., 104 (3), 171–183, 2000.
Zapata, N. and Martinez-Cob, A.: Evaluation of the surface renewal method to estimate wheat evapotranspiration, Agr. Water Man-age., 55 (2), 141–157, 2002.