HAL Id: hal-01381798
https://hal.archives-ouvertes.fr/hal-01381798
Submitted on 30 Oct 2020
HAL is a multi-disciplinary open access
archive for the deposit and dissemination of
sci-entific research documents, whether they are
pub-lished or not. The documents may come from
teaching and research institutions in France or
abroad, or from public or private research centers.
L’archive ouverte pluridisciplinaire HAL, est
destinée au dépôt et à la diffusion de documents
scientifiques de niveau recherche, publiés ou non,
émanant des établissements d’enseignement et de
recherche français ou étrangers, des laboratoires
publics ou privés.
during the VAHINE mesocosm experiment in the New
Caledonian lagoon
Ilana Berman-Frank, Dina Spungin, Eyal Rahav, France van Wambeke,
Kendra Turk-Kubo, Thierry Moutin
To cite this version:
Ilana Berman-Frank, Dina Spungin, Eyal Rahav, France van Wambeke, Kendra Turk-Kubo, et al..
Dynamics of transparent exopolymer particles (TEP) during the VAHINE mesocosm experiment in the
New Caledonian lagoon. Biogeosciences, European Geosciences Union, 2016, 13 (12), pp.3793-3805.
�10.5194/bg-13-3793-2016�. �hal-01381798�
www.biogeosciences.net/13/3793/2016/ doi:10.5194/bg-13-3793-2016
© Author(s) 2016. CC Attribution 3.0 License.
Dynamics of transparent exopolymer particles (TEP) during the
VAHINE mesocosm experiment in the New Caledonian lagoon
Ilana Berman-Frank1, Dina Spungin1, Eyal Rahav1,2, France Van Wambeke3, Kendra Turk-Kubo4, and Thierry Moutin3
1The Mina and Everard Goodman Faculty of Life Sciences, Bar-Ilan University, Ramat Gan, 5290002, Israel 2National Institute of Oceanography, Israel Oceanographic and Limnological Research, Haifa, 31080, Israel
3Aix Marseille Université, CNRS/INSU, Université de Toulon, IRD, Mediterranean Institute of Oceanography (MIO)
UM110, 13288, Marseille, France
4Ocean Sciences Department, University of California, Santa Cruz, 1156 High Street, Santa Cruz, CA 95064, USA
Correspondence to:Ilana Berman-Frank (ilana.berman-frank@biu.ac.il)
Received: 29 November 2015 – Published in Biogeosciences Discuss.: 18 January 2016 Revised: 1 May 2016 – Accepted: 5 May 2016 – Published: 1 July 2016
Abstract. In the marine environment, transparent exopoly-meric particles (TEP) produced from abiotic and biotic sources link the particulate and dissolved carbon pools and are essential vectors enhancing vertical carbon flux. We characterized spatial and temporal dynamics of TEP dur-ing the VAHINE experiment that investigated the fate of diazotroph-derived nitrogen and carbon in three replicate dis-solved inorganic phosphorus (DIP)-fertilized 50 m3 enclo-sures in the oligotrophic New Caledonian lagoon. During the 23 days of the experiment, we did not observe any depth-dependent changes in TEP concentrations in the three sam-pled depths (1, 6, 12 m). TEP carbon (TEP-C) content av-eraged 28.9 ± 9.3 and 27.0 ± 7.2 % of total organic car-bon (TOC) in the mesocosms and surrounding lagoon re-spectively and was strongly and positively coupled with TOC during P2 (i.e., days 15–23). TEP concentrations in the mesocosms declined for the first 9 days after DIP fer-tilization (P1 = days 5–14) and then gradually increased dur-ing the second phase. Temporal changes in TEP concentra-tions paralleled the growth and mortality rates of the diatom– diazotroph association of Rhizosolenia and Richelia that pre-dominated the diazotroph community during P1. By P2, in-creasing total primary and heterotrophic bacterial produc-tion consumed the supplemented P and reduced availability of DIP. For this period, TEP concentrations were negatively correlated with DIP availability and turnover time of DIP (TDIP), while positively associated with enhanced alkaline
phosphatase activity (APA) that occurs when the microbial
populations are P stressed. During P2, increasing bacterial production (BP) was positively correlated with higher TEP concentrations, which were also coupled with the increased growth rates and aggregation of the unicellular cyanobacte-rial Group C (UCYN-C) diazotrophs that bloomed during this period. We conclude that the composite processes re-sponsible for the formation and breakdown of TEP yielded a relatively stable TEP pool available as both a carbon source and facilitating aggregation and flux throughout the experi-ment. TEP were probably mostly influenced by abiotic phys-ical processes during P1, while biologphys-ical activity (BP, dia-zotrophic growth and aggregation, export production) mainly impacted TEP concentrations during P2 when DIP availabil-ity was limited.
1 Introduction
The cycling of carbon (C) in the oceans is a complex inter-play between physical, chemical, and biological processes that regulate the input and the fate of carbon within the ocean. An essential process driving the flux of carbon and other or-ganic matter to depth, and enabling long-term sequestration and removal of carbon from the atmosphere, is the biological pump that drives organic C formed during photosynthesis to the deep ocean. This process, termed export production (Ep-pley and Peterson, 1979), is facilitated via physical inputs of “new” nutrients (e.g., nitrogen, phosphorus, silica, trace
metals) into the euphotic zone from either external sources (deep mixing of upwelled water, river discharge, dust depo-sition, and anthropogenic inputs) or via biological processes. One such process is microbial N2fixation that converts
bi-ologically unavailable dinitrogen (N2) gas into bioavailable
forms of nitrogen and enhances the productivity of olig-otrophic oceanic surface waters that are often limited by ni-trogen (Capone, 2001; Falkowski, 1997).
Marine N2fixation is performed by diverse prokaryotic
or-ganisms comprised predominantly of autotrophic cyanobac-teria and heterotrophic baccyanobac-teria (Zehr and Kudela, 2011). To supply the energetically expensive process of converting N2
to ammonia (Mulholland and Capone, 2000; Postgate and Eady, 1988; Stam et al., 1987), these organisms must obtain energy from either photosynthesis (cyanobacteria) or from bioavailable organic carbon compounds within the aquatic milieu (heterotrophic bacteria and mixotrophs). The total organic carbon (TOC) in the ocean contains dynamic par-ticulate organic carbon (POC) and dissolved organic car-bon (DOC) pools. These are supplied by biotic sources and are broken down into organic C-containing marine micro-gels which include transparent polymeric particles (TEP). TEP are predominantly acidic polysacchridic organic parti-cles ranging in size from ∼ 0.45 to > 300 µm and are found in both marine and freshwater habitats (Passow, 2002). Both bi-otic and abibi-otic processes form aquatic TEP that are routinely detected by staining with Alcian Blue (Alldredge et al., 1993; Passow and Alldredge, 1995). Abiotic TEP occur by coagu-lation of colloidal precursors in the pool of dissolved organic matter (DOM) and from planktonic debris (Passow, 2002; Verdugo and Santschi, 2010) that may be stimulated by tur-bulence or by bubble adsorption (Logan et al., 1995; Passow, 2002; Zhou et al., 1998). Biotically TEP form from extra-cellular secretion or mucilage in algae and bacteria and from grazing and microbial breakdown of larger marine snow par-ticles (reviewed in Bar-Zeev et al., 2015; Passow, 2002).
TEP are light and buoyant (Azetsu-Scott and Passow, 2004); yet, once formed, TEP sticky nature enhances and consolidates the formation of larger aggregates such as ma-rine/lake snow, providing favorable environments for diverse microorganisms (Engel, 2004; Passow, 2002). Sedimentation of TEP-associated hot spots from the surface are important for transporting particulate organic material and microorgan-isms to deeper waters (Azam and Malfatti, 2007; Bar-Zeev et al., 2009; Smith and Azam, 1992). During sedimentation, TEP can also function as a direct source of carbon and other nutrients for higher trophic level organisms such as protists, micro-zooplankton, and nekton (Engel, 2004; Passow, 2002). TEP production can be enhanced in late phases of al-gal blooms and in senescent or nutrient-stressed phytoplank-ton (Berman-Frank et al., 2007; Engel, 2004; Grossart et al., 1997; Passow, 2002). Thus, TEP in oligotrophic wa-ters provide a source of available carbon to fuel microbial food webs (Azam and Malfatti, 2007) that typically succeed autotrophic blooms. TEP-based aggregates or
marine-snow-containing TEP typically have high carbon (C) : nitrogen (N) ratios (Berman-Frank and Dubinsky, 1999; Wood and Van Valen, 1990), which can also fuel N2 fixation by
het-erotrophic diazotrophs (Benavides et al., 2015; Rahav et al., 2013).
The VAHINE project was designed to examine the fate/s of “newly” fixed N by diazotrophs or diazotroph-derived N in the pelagic food web using large mesocosms in the oligotrophic tropical lagoon of New Caledonia where di-verse diazotrophic populations have been observed (Bie-gala and Raimbault, 2008; Bonnet et al., 2016b; Dupouy et al., 2000; Garcia et al., 2007; Rodier and Le Borgne, 2008, 2010). One of the major questions addressed during VAHINE was whether diazotroph blooms significantly mod-ify the stocks, fluxes, and ratios of biogenic elements (C, N, P, Si) and the efficiency of carbon export. To this end, the three large-volume (∼ 50 m3) mesocosms containing am-bient lagoon waters were fertilized with 0.8 µmol L−1 dis-solved inorganic phosphorus (DIP), and multiple parame-ters were measured inside and outside of the mesocosms for 23 days (details of parameters and experimental setup in Bonnet et al., 2016b). Within the VAHINE framework, our specific objectives were as follows: (1) to examine the spa-tial and temporal dynamics of TEP; (2) to determine whether TEP content was regulated by nutrient status in the meso-cosms – specifically DIP availability; (3) to examine the rela-tionship between TEP content, particulate and dissolved car-bon, and primary or heterotrophic bacterial production; and (4) to elucidate whether TEP provided a source of energy for diazotrophs/bacteria/mixotrophs in mesocosms.
2 Methods
2.1 Study site, mesocosm description, and sampling strategy
Three large-volume (∼ 50 m3) mesocosms were deployed at the exit of the oligotrophic New Caledonian lagoon (22◦29.100S–166◦26.900E), from 13 January 2013 (day 1) to 4 February 2013 (day 23). The complete description of the mesocosm design and deployment, as well as the sam-pling strategy, is detailed in Bonnet et al. (2016b). The meso-cosms were supplemented with 0.8 µmol L−1KH2PO4
(here-after referred to as DIP fertilization) between day 4 and day 5 of the experiment to promote N2fixation. Samples were
col-lected during the early morning of each day for 23 days with a clean Teflon pumping system from three selected depths (1, 6, 12 m) in each mesocosm (M1, M2, and M3) and outside (hereafter called “lagoon waters” – O). Based on the results of different biogeochemical and biological parameters dur-ing VAHINE (Berthelot et al., 2015; Bonnet et al., 2016a; Turk-Kubo et al., 2015), three specific periods were dis-cerned (see detailed description in Sect. 3.1) within which we have also investigated TEP dynamics: days 2–4 (P0)
are the pre-fertilization days when the DIP concentrations were 0.02–0.05 µmol L−1PO3−4 and combined dissolved in-organic nitrogen concentrations were extremely low; days 5–14 (P1); after fertilization on day 5, the PO3−4 concen-trations were ∼ 0.8 µmol L−1 and diazotrophic populations were dominated by diatom–diazotroph associations. The sec-ond stage of the experiment (P2) from days 15 to 23 was characterized by simultaneous increase in primary and bacte-rial production as well as in N2fixation rates, which averaged
27.7 nmol N L−1d−1(Berthelot et al., 2015) and diazotrophic populations comprised primarily of the unicellular UCYN-C (Turk-Kubo et al., 2015).
2.2 TEP quantification
Water samples (100 mL) were gently (< 150 mbar) filtered through 0.45 µm polycarbonate filters (GE Water & Pro-cess Technologies). Filters were then stained with a solu-tion of 0.02 % Alcian Blue (AB) and 0.06 % acetic acid (pH of 2.5). The excess dye was removed by a quick deion-ized water rinse. Filters were then immersed in sulfuric acid (80 %) for 2 h, and the absorbance at 787 nm was measured spectrophotometrically (CARY 100, equipped with an in-tegrated sphere, Varian). AB was calibrated using different volumes of purified polysaccharide GX (Passow and All-dredge, 1995). TEP concentrations (µg xanthan gum [GX] equivalents L−1.) were measured according to Passow and Alldredge (1995). Total TEP content in the mesocosms was calculated by integrating the weighted average of the TEP concentrations per depth and multiplying it by the specific volume of each mesocosm. To estimate the role of TEP in C cycling, the total amount of TEP-C was calculated for each mesocosm, using the volumetric TEP concentrations at each depth, the specific volume per mesocosm, and the conversion of GX equivalents to carbon, applying the revised factor of 0.63 based on empirical experiments from both natural sam-ples from different oceanic areas and phytoplankton cultures (Engel, 2004).
2.3 Total organic carbon (TOC), particulate organic carbon (POC), dissolved organic carbon (DOC)
Samples for TOC concentrations were collected in duplicate from 6 m in each mesocosm and in lagoon waters in pre-combusted sealed glassware flasks, acidified with H2PO4and
stored in the dark at 4◦C until analysis. Samples were
ana-lyzed on a Shimadzu TOC-V analyzer with a typical preci-sion of 2 µmol L−1. Samples for POC concentrations were collected by filtering 2.3 L of seawater through a precom-busted GF/F filter (450◦C for 4 h), combusted and analyzed on an EA 2400 CHN analyzer. DOC concentrations were cal-culated as the difference between TOC and POC concentra-tions. Fully detailed methodologies and data are available in Berthelot et al. (2015).
2.4 Dissolved inorganic phosphorus (DIP) and alkaline phosphatase activity (APA)
The determination of DIP concentrations is detailed in Berth-elot et al. (2015). Samples for DIP were collected from each of the three depths in M1, M2, and M3 and lagoon waters (O) in 40 mL glass bottles, and stored in −20◦C until analysis. DIP concentration was determined using a segmented flow analyzer according to Aminot and Kérouel (2007). The alka-line phosphatase activity (APA) was measured from the same depths and sites using the analog substrate methylumbellif-erone phosphate (MUF-P, 1 µM final concentration; SIGMA) (Hoppe, 1983). Full details of the measurements and analy-ses are described in Van Wambeke et al. (2016).
2.5 Chlorophyll a (Chl a), primary production (PP), and DIP turnover time
Chlorophyll a (Chl a) concentrations were determined by the non-acidification method as described in Berthelot et al. (2015). Primary production (PP) rates and DIP turnover time (TDIP, i.e., the ratio of PO−34 concentration and uptake)
were measured using the 14C /33P dual labeling method (Duhamel et al., 2006). 60 mL bottles were amended with
14C and 33P and incubated for 3–4 h under ambient light
and temperature. This was followed by the addition of 50 µL of KH2PO4solution (10 mmol L−1) to stop33P assimilation.
Samples were then kept in the dark to stop14C uptake. Sam-ples were filtered on 0.2 µm polycarbonate membrane filters, and counts were done using a Packard Tri-Carb® 2100TR scintillation counter. PP and TDIPwere calculated according
to Moutin et al. (2002).
2.6 Bacterial production (BP)
Heterotrophic bacterial production (BP) was estimated using the 3H-leucine incorporation technique (Kirchman, 1993), adapted to the centrifuge method (Smith and Azam, 1992). The complete methodology including enumeration of het-erotrophic bacterial abundances (BA) by flow cytometry is detailed in Van Wambeke et al. (2016).
2.7 N2fixation, diazotrophic abundance, and growth
rates
N2 fixation rates were determined daily on ambient waters
from mesocosms and the lagoon. Samples were spiked with 99 %15N2-enriched seawater (Mohr et al., 2010), incubated
in situ under ambient light and seawater temperatures as de-tailed in Berthelot et al. (2015) and Bonnet et al. (2016a).
Data and protocols of sampling for diazotrophic abun-dance and calculation of their respective growth rates are detailed fully in Turk-Kubo et al. (2015). Briefly, samples (from 6 m only) were collected every other day from the mesocosms, and from the lagoon waters. DNA was extracted and nine diazotrophic phylotypes were identified using
quan-titative polymerase chain reactions (qPCRs). The targeted diazotrophs were two unicellular diazotrophic symbionts of different Braarudosphaera bigelowii strains, UCYN-A1, UCYN-A2; free-living unicellular diazotroph cyanobacte-rial phylotypes B (Crocosphaera sp.), and UCYN-C (UCYN-Cyanothece sp. and relatives); Trichodesmium spp.; and three diatom–diazotroph associations (DDAs), Richelia as-sociated with Rhizosolenia (Het-1), Richelia asas-sociated with Hemiaulus (Het-2), Calothrix associated with Chaetoceros (Het-3), and a widespread gamma-proteobacterial phylotype γ-24774A11. Abundances are reported as nifH copies L−1as the number of nifH copies per genome in these diazotrophs is uncertain. Growth and mortality rates were calculated for in-dividual diazotrophs inside the mesocosms when abundances were higher than the limit of quantification for two consecu-tive sampling days as detailed in Turk-Kubo et al. (2015). 2.8 Microscopic analyses
The detailed method for sampling for microscopic analy-ses is described in Bonnet et al. (2016a). Phytoplankton were visualized using a Zeiss Axioplan (Zeiss, Jena, 6 Ger-many) epifluorescence microscope fitted with a green (510– 560 nm) excitation filter, which targeted the Richelia and the UCYN phycoerythrin-rich cells. The diatom-diazotroph as-sociation Rhizosolenia–Richelia were imaged in bright-field microscopy.
2.9 Statistical analyses
Statistical analyses were carried out with XLSTAT, a Mi-crosoft Office Excel based software. A Pearson correlation coefficient test was applied to examine the association be-tween two variables (TEP vs. physical, chemical, or physi-ological variable) after linear regressions or log transforma-tion of the data. The nonparametric Kruskal–Wallis one-way analysis of variance was applied to compare between TEP dynamics from each of the different phases. A confidence level of 95 % (α − 0.05) was used. More details can be found in the supporting information.
3 Results and discussion
3.1 General context and spatial and temporal dynamics of TEP
The VAHINE experiment was designed to induce and follow diazotrophic blooms and their fate within an oligotrophic en-vironment (Bonnet et al., 2016b). Our specific objectives of investigating TEP dynamics were thus examined within the general context and aims of the large experiment. The first stage of the experiment involved the enclosure of the lagoon waters and 3 days of equilibration of the system (P0 – pre-fertilization days 2–4). At this initial stage the total Chl a concentrations averaged around 0.2 µg L−1in the lagoon
wa-ter and in the mesocosms and the phytoplankton consisted of diverse representatives from the cyanobacteria (Prochloro-coccus, Synechococcus), and diatoms such as Pseudosolenia calcar-avis(Leblanc et al., 2016). During P0, the most abun-dant members of the diazotrophic community in the lagoon waters were Richelia–Rhizosolenia (Het-1), the unicellular UCYN-A1, UCYN-A2, UCYN-C, and the filamentous Tri-chodesmium(Turk-Kubo et al., 2015).
Fertilization of the mesocosms with DIP on day 4 stim-ulated a two-stage response by the diazotrophic commu-nity that was further reflected by many of the measured chemical and biological parameters (Berthelot et al., 2015; Bonnet et al., 2016a, b; Turk-Kubo et al., 2015). Af-ter fertilization, from day 5 through day 14 (P1), exclud-ing a significant increase in N2 fixation rates, the
func-tional community-wide biological responses (Chl a, PP, BP, BA) remained relatively low and similar to the values for P0 and for P1 in the outside lagoon waters (Berthelot et al., 2015; Leblanc et al., 2016; Van Wambeke et al., 2016). The autotrophic community during P1 was comprised of picophytoplankton such as Prochlorococcus Synechococ-cus, micro- and nanophytoplankton including dinoflagel-lates, and a diverse diatom community (Chaetoceros, Lepto-cylindrus, Cerataulina, Guinardia, and Hemiaulus) (Leblanc et al., 2016). Diatom-diazotroph associations (DDAs), pre-dominantly Richelia–Rhizosolenia (Het-1), dominated the diazotroph community in the mesocosms (Turk-Kubo et al., 2015), although it still only contributed from 2 to ∼ 8 % of the total diatom biomass in P0 and P1 respectively (Leblanc et al., 2016). These DDAs were succeeded during the last 9 days (day 15 to 23 termed P2) by a large bloom of unicellular diazotrophs characterized predominantly as UCYN-C (Turk-Kubo et al., 2015).
The final stage of the experiment (P2, days 15–23) was characterized by significantly enhanced values for many bi-ological parameters including N2 fixation rates, Chl a, PP,
BA, BP, and particulate organic carbon and nitrogen com-pared to their respective average values in P1 (Bonnet et al., 2016a; Leblanc et al., 2016; Van Wambeke et al., 2016). In all three mesocosms, a significant bloom of UCYN-C de-veloped (day 11 – M1, day 13 – M2, day 15 – M3) and remained dominant representatives of the diazotroph com-munity until day 23 (Turk-Kubo et al., 2015). The ambi-ent autotrophic community responded to the input of new N, and the transfer of diazotroph-derived N was demon-strated and seen in increasing abundance of Synechococ-cus, picoeukaryotes, and the non-diazotrophic diatoms Nav-iculaand Chaetoceros spp. (Bonnet et al., 2016a; Leblanc et al., 2016; Van Wambeke et al., 2016). Thus the extremely high N2fixation rates during this experiment provided
suffi-cient new N to yield high Chl a concentrations (> 1.4 µg L−1) and rates of PP (> 2 µmol C L−1d−1) (Berthelot et al., 2015).
Dynamics of TEP
TEP concentrations for the entire experimental period ranged from ∼ 22 to 1200 µg GX L−1. In each mesocosm and in the lagoon waters (O), the TEP concentrations were similar for the three sampled depths within the 15 m water column, with an overall average of 350 ± 180 µg GX L−1 (Fig. S1 in the Supplement). Temporally, TEP concentrations generally fol-lowed the three distinct periods (P0, P1, P2) that coincided with the described experimental phases characterized from the diazotrophic populations and the biogeochemical and biological (production) parameters (Berthelot et al., 2015; Bonnet et al., 2016a; Leblanc et al., 2016; Turk-Kubo et al., 2015; Van Wambeke et al., 2016) (Figs. 1, S1). Fol-lowing the enclosure of the lagoon water in the mesocosms (day 2), TEP concentrations increased from the lowest volu-metric concentrations (averaging ∼ 50 µg GX L−1) measured on day 2 to reach maximum concentrations in each of the mesocosms (average of ∼ 800 µg GX L−1) on day 5, ∼ 15 h after the mesocosms were fertilized with DIP (Figs. S1, 1a). From day 5 to day 14 (P1) average TEP content in M2 and M3 decreased slightly yet significantly (p < 0.05) with the major decline in all mesocosms measured from day 5 to day 6 (Figs. 1, S1, Table S1 in the Supplement). From day 15 to 23 (P2) TEP concentrations in all mesocosms increased gradually (p < 0.05) over the subsequent 9 days to reach 381 ± 39 µg GX L−1on day 23 (Fig. 1, Table S1).
TEP concentrations in the lagoon waters were compared with those in the mesocosms. These showed a similar pat-tern of increase in TEP during P0 and P2, while the grad-ual decline in TEP concentrations during P1 was not statisti-cally significant as observed in the mesocosms (Figs. 1, S1). In the lagoon waters, average TEP concentrations over the whole experimental period, day 2 to day 23, were 335 ± 56 µg GX L−1. While temporal variations in the three meso-cosms were generally statistically significant (Fig. 1, Ta-ble S1), the total TEP content calculated for each mesocosm and for an equivalent volume of lagoon water based on aver-age mesocosm volume did not differ significantly when we assessed all data obtained during P1 and P2 (Fig. 2, p > 0.05, Kruskal–Wallis analyses of variance). The lack of significant differences in total TEP content in the mesocosms through-out the experiment could reflect the contrasting processes of formation and breakdown that together maintain a relatively stable pool of available TEP.
Mechanical processes such as wave turbulence and tidal effects can influence TEP formation and breakdown (and resulting content) (Passow, 2002; Stoderegger and Herndl, 1999). Our results indicate no obvious effects of these param-eters on TEP content as these were similar in the enclosed mesocosms and the outside lagoon (Figs. 1, 2). The differ-ence between the TEP in the mesocosms and the lagoon wa-ter is significantly different immediately afwa-ter P addition and only during P1 after P addition and subsequent utilization when declining P availability was correlated with increased
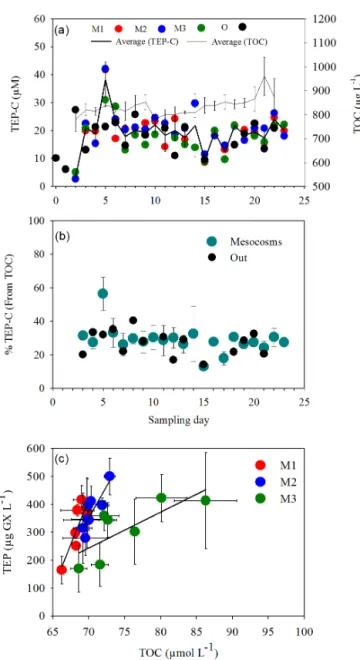
Figure 1. Temporal changes in transparent exopolymeric parti-cle (TEP) concentrations (µg GX L−1) during the VAHINE meso-cosm experiment. Data shown are from daily sampling of three depths (1, 6, 12 m) in each mesocosm. Data were analyzed accord-ing to the characterized phases of the experiment based on the di-azotrophic communities that developed in the mesocosms (Turk-Kubo et al., 2015) and biogeochemical characteristics (Bonnet et al., 2016a). (a) Mesocosm 1 (M1), (b) Mesocosm 2 (M2), (c) Meso-cosm 3 (M3), (d) samples from the lagoon waters outside of the mesocosms (O). Phases: P0 denotes days 2–4, P1 denotes days 5– 14, P2 denotes days 15–23. Linear regressions (Pearson) of TEP for each of the phases are designated by a solid line, only when significant. Pearson correlation coefficients and significant values (p < 0.05) are represented in bold in Table S1.
Figure 2. Total content of transparent exopolymeric particles (TEP) per mesocosm and in the lagoon waters surrounding the meso-cosms. The average amount in g GX mesocosm−1for the two pe-riods of the experiment after DIP fertilization was calculated from the total daily amount based on concentrations measured at three depths and integrated for the specific volume per mesocosm or for an equivalent volume of lagoon water. Averages are represented in box plots as a function of two different phases: P1 = days 5–14 and P2 = days 15–23. Red, blue, green, and black denote Mesocosm 1 – M1, Mesocosm 2 – M2, Mesocosm 3 – M3, and outside lagoon – O, respectively. Straight lines within the boxes mark the median. No significant differences were observed between the phases or be-tween the three mesocosms and the outside lagoon (Kruskal–Wallis nonparametric analysis of variance; p > 0.05).
TEP concentrations in the mesocosms. TEP concentrations from the lagoon water during P1 did not show any signif-icant trend (Figs. 1, S1). In the mesocosms, the signifsignif-icant decline in TEP in the first days after P addition is probably due to two factors: (a) phytoplankton relieved of P stress will produce fewer TEP and increase growth rates; (b) bacteria will utilize the added P as well as TEP and other organic C sources to grow, so a higher TEP consumption and therefore a more significant decline in the mesocosms compared to the outside lagoon (see below Sect. 3.2).
The relative uniformity and stability of TEP within the 15 m water column of both the mesocosms and the lagoon waters reflects the homogeneity of the shallow lagoon sys-tem. The variability between the three depths was statistically insignificant in many of the other physical, chemical, and bi-ological features of the mesocosms and the lagoon waters for temperature, salinity, inorganic nutrients (N, P, Si), POC, PON, POP, DOC, Chl a, and primary production and het-erotrophic bacterial production (Berthelot et al., 2015; Bon-net et al., 2016a, b; Van Wambeke et al., 2016). In contrast to some marine systems where TEP concentrations were corre-lated with the vertical distribution of Chl a or POC (Bar-Zeev et al., 2009, 2011; Engel, 2004; Ortega-Retuerta et al., 2009; Passow, 2002), the results we obtained here showed no cor-relation to the vertical (i.e. depth-related) autotrophic sig-natures. Moreover, the similar TEP concentrations at 1, 6, and 15 m do not support a subsurface maxima in TEP con-centrations, stimulated by abiotic aggregation, at the sea-surface top layer as has been reported at 1 m depth in dif-ferent oceanic areas (Wurl et al., 2011). Abiotic processes of formation and breakdown can be influential; yet here we do not see a depth-correlated specific abiotic driver and TEP
were evenly distributed within the 15 m water column for all mesocosms (Fig. S1).
3.2 DIP availability, APA, and TEP content
The average TEP concentrations we measured in the New Caledonian waters are comparable to TEP concentrations reported from other marine environments such as the east-ern temperate–subarctic North Atlantic (Engel, 2004), the Ross Sea (Hong et al., 1997), western Mediterranean – Gulf of Cadiz and the Straits of Gibraltar (García et al., 2002; Prieto et al., 2006), the Gulf of Aqaba (northern Red Sea) (Bar-Zeev et al., 2009), in the northern Adriatic Sea (Radi´c et al., 2005), and in the New Caledonian lagoon (Mari et al., 2007; Rochelle-Newall et al., 2008).
While prediction as to the expected TEP concentrations with trophic or productive status is difficult (Beauvais et al., 2003), decreasing availability of dissolved nutrients such as nitrate and phosphate has been correlated with enriched TEP concentrations in both cultured phytoplankton and nat-ural marine systems (Bar-Zeev et al., 2011; Brussaard et al., 2005; Engel et al., 2002; Urbani et al., 2005). In P-limited systems, low Chl a concentrations often reflect the nutrient-stressed phytoplankton. As long as light and CO2are
avail-able, limitation of essential nutrients results in an uncoupling between carbon fixation and growth during which the ex-cess photosynthate can be used to produce carbon-rich com-pounds including TEP (Berman-Frank and Dubinsky, 1999; Mari et al., 2001; Rochelle-Newall et al., 2008). Moreover, as DIP availability declines, cells activate P-acquisition path-ways and enzymes such as APA to access P from other sources. Thus, and based on previous data (Bar-Zeev et al., 2011), we hypothesized that TEP content would be neg-atively correlated with autotrophic biomass (Chl a) and PP and positively correlated with APA.
Mesocosm fertilization on the evening of day 4 enriched the system with tenfold higher DIP concentrations that were available for microbial utilization throughout the following 8–10 days (Berthelot et al., 2015; Bonnet et al., 2016b; Leblanc et al., 2016; Van Wambeke et al., 2016). Thus, when DIP concentrations were relatively sufficient during P1, no statistically significant relationship was observed between TEP and POP, DIP, TDIP, Chl a, or PP (Table S2). This
situ-ation changed with the declining availability of DIP and the shift in the response of the system during P2 from day 15 to 23. During P2, high TEP concentrations were associated with decreasing DIP for each of the mesocosms, with an overall negative correlation (R2=0.23, n = 23, p = 0.02) (Fig. 3a). A similar negative trend was obtained between TEP and the turnover time of DIP (TDIP) (R2=0.28, n = 26, p = 0.006)
(Fig. 3b).
In the Southwest Pacific Ocean, the critical DIP turnover time (TDIP) required for single filaments of Trichodesmium
to grow is 2 days (Moutin et al., 2005). Here TDIP values
Figure 3. Relationships between the concentration of transparent exopolymeric particles (TEP), (µg GX L−1) and (a) dissolved inorganic phosphorus DIP (µmol L−1), (b) turnover time of DIP – TDIP(days), and (c) alkaline phosphatase activity (APA) (nmol L−1h−1) in the three
mesocosms (M1– red; M2– blue; M3– green) during phase 2 (days 15–23). For (a) and (b) Pearson linear regressions yielded an R2of 0.54, n =23 (TEP / DIP), and an R2of 0.52, n = 26 (TEP / TDIP), and for (c) log-transformed (log(TEP) / log(APA)) with an R2of 0.68, n = 25.
All correlations were significant (p < 0.05). Error bars represent ±1 standard deviation.
reached on day 14 in M1, day 19 for M2, and on day 21 for M3. The average TDIP values during P2 were
signifi-cantly different in each mesocosm, TDIPof 0.5, 1.8, 3.9 days
for M1, M2, M3, respectively (Berthelot et al., 2015). Al-though turnover rates alone do not indicate P deficiency, increasing APA suggests that the cells were responding to P stress. APA increased rapidly in both M1 and M2 from day 18 (average for M1 and M2 during P2 ∼ 8 ± 6 nmol MUF − P hyd L−1h−1) and after day 21 in M3, illustrating a bi-ological response of the microbial community to P stress (Van Wambeke et al., 2016). We did not specifically mea-sure TEP production by autotrophic or heterotrophic plank-ton; yet, the significant (although indirect relationship) neg-ative correlation of TEP with DIP concentrations and TDIP
(Fig. 3a, b) suggests that microbial responses to decreased DIP availability resulted from either (1) an increase in TEP synthesis through higher polysaccharide production rather than biomass which requires higher nutrients (Berman-Frank and Dubinsky, 1999; Wood and Van Valen, 1990) or (2) nu-trient limitation, inducing greater breakdown of biomass and particulate organic matter (POM) (maybe via programmed cell death) and subsequent abiotic formation of TEP. We ob-tained a significant semi-logarithmic relationship between TEP and APA (R2=0.33, n = 25, p = 0.002) (Fig. 3c), which implies active TEP formation when DIP concentra-tions are reduced and APA increases until a saturating point, whereby any further increases in APA do not appear to im-pact TEP concentrations (Fig. 3c). This relationship may not always be valid, as APA in the lagoon waters was consis-tently higher at 1 m than APA measured at 6 and 12 m depths (Van Wambeke et al., 2016); yet TEP concentrations were uniform at all depths (Fig. S1).
3.3 TEP and carbon pools
The size range of TEP spans particles from 0.45 to 300 µm (Alldredge et al., 1993; Bar-Zeev et al., 2015). TEP precur-sors (0.05–0.45 µm size) are formed and broken down in the
DOC pool and thus essentially “TEP establish a bridge be-tween the dissolved organic matter and the POM pool” (En-gel, 2004). Our data show a generally stable contribution of TEP to the TOC pool. Excluding day 5, where TEP-C comprised 56.5 ± 8 % of TOC, the percentage of TEP-C was 28.9 ± 9.3 % and 27.0 ± 7.2 % of the TOC in all mesocosms and in the lagoon waters, respectively (Fig. 4a, b).
TEP concentrations can be directly and positively cor-related with POC (Engel, 2004) and with DOC (Ortega-Retuerta et al., 2009); yet, TEP concentrations can also be negatively related to POC, indicative of low TEP pro-duction when POC concentrations are high (Bar-Zeev et al., 2011). In the mesocosms, a significant positive corre-lation between TEP concentrations and TOC was obtained for all three mesocosms only during P2 (R2=0.75, 0.73, 0.58 and p < 0.05 for M1, M2, M3 respectively) (Fig. 4c, Table S2). This period coincided with the largest gain in to-tal autotrophic and heterotrophic biomass and elevated N2
fixation, PP, and BP rates (Berthelot et al., 2015; Bonnet et al., 2016a; Van Wambeke et al., 2016).
Although TEP were significantly and positively correlated with TOC in the mesocosms during P2, this was not the case in the lagoon water (outside the mesocosms) (Table S2) or with either POC or DOC in any mesocosm for either P1 or P2 (Table S2). The absence of any significant cor-relation between TEP and POC was surprising as TEP are part of the POC pool comprising 40–60 % of the particu-late combined carbohydrates in POC (Engel, 2004; Engel et al., 2012). Furthermore, we did not obtain any signifi-cant correlations of TEP and specific components of the dis-solved organic matter such as fluorescent disdis-solved organic matter (FDOM) or chromophoric dissolved organic matter (CDOM) that was coupled to the dynamics of N2 fixation
in the mesocosms (Tedetti et al., 2016). The lack of signifi-cant correlation could partially reflect methodological issues. In this experiment (and operationally according to published protocol; Passow and Alldredge, 1995), TEP were measured on 0.45 µm filters; therefore Alcian Blue stained particles
Figure 4. (a) Temporal dynamics of TEP carbon concentrations (TEP-C, µM) in relationship to the average total organic carbon (TOC) (µg L−1) (thin black line) in the mesocosms (M1 – red dots, M2 – blue dots, M3 – green dots, and black dots – outside wa-ters (O). The black solid line designates TEP-C averaged for the three mesocosms (thick black line). TEP-C was measured from 6 m depths and calculated according to Engel (2000). (b) Tempo-ral changes in the percentage of TEP-C in TOC (%) in mesocosms (green dots), and the percentage of TEP-C in the lagoon waters (Out), (black dots). (c) Relationship between TEP concentrations (µg GX L−1) and TOC (µmole L−1), during phase 2 (days 15–23) for Mesocosm 1 (M1, red dots), Mesocosm 2 (M2, blue dots), Mesocosm 3 (M3, green dots). Significant correlations were ob-served (Pearson) for all mesocosms. R2=0.75 – M1, 0.73 – M2, and 0.58 – M3 respectively, n = 7–8, p < 0.05. All statistics are detailed in Table S2, (p = 0.05, n = 7–8). Error bars represent ±1 standard deviation.
included particles > 0.45 µm, while POC was measured on GF/F (nominal pore size 0.7 µm). DOC is typically consid-ered for the < 0.45 µm fraction (Thurman, 1985), although here no direct measurements of DOC were made and DOC was obtained by subtracting POC from TOC. Thus, DOC ac-tually covered the < 0.7 µm fraction. Our methodology there-fore precluded determination of the smaller TEP precursors that would contribute to the DOC and colloidal pools (Villa-corte et al., 2015). As such we probably overestimated TEP relative to POC and at the same time underestimated TEP contribution to the DOC pool (Bar-Zeev et al., 2009). The lacking correspondence between TEP concentrations and the pools of POC and DOC may also result from the uncou-pling between formation and breakdown processes. Abiotic processes will modify relationships obtained between biotic TEP production and recycling (Wurl et al., 2011). Thus, it is feasible that especially during P1, abiotic factors predom-inated breaking down larger TEP particles into smaller TEP precursors that would be mobilized to the DOC pool, and would thus maintain a relatively stable TEP pool although we observed a positive increase in TEP with increased blooms of DDAs (see below Sect. 3.4.1).
3.4 Production and utilization of TEP by primary and bacterial populations
Typically, TEP are formed by diverse algal and bacterial species (Mari and Burd, 1998), yet are utilized mostly by bacteria and grazers as a rich C source (Azam and Mal-fatti, 2007; Bar-Zeev et al., 2015; Engel and Passow, 2001). Throughout this experiment (P1 and P2 stages) TEP were not significantly correlated to parameters related to autotrophic production such as total Chl a, PP, non-diazotrophic diatom, or cyanobacterial abundance, or the growth and mortality rates of these populations (Table S2). Furthermore, during P1, no significant relationship between TEP and BA (total or specific for high and low nucleic acid bacteria – HNA or LNA respectively), BP, or division rates was noted in any of the mesocosms (Table S2).
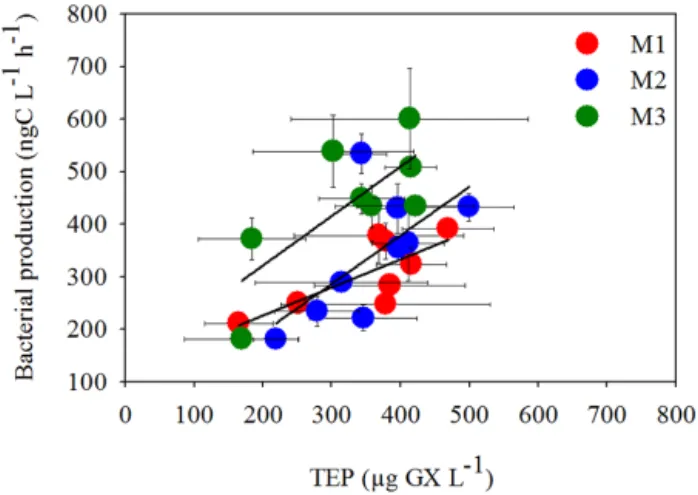
This changed during P2 when TEP were positively cor-related to the increasing BP for all three mesocosms (Pear-son’s correlation coefficient R2=0.63, 0.66, 0.69 for M1, M2, and M3 respectively, p < 0.05) (Fig. 5). This contrasted with the relationship in the lagoon water outside the meso-cosms where no significant correlation between TEP and BP was noted (Table S2). During P2, TEP were also strongly and positively correlated to TOC, which significantly increased over this time period (Fig. 4c) due to the high production rates of both photosynthetic and heterotrophic bacterial pop-ulations. However, although BP and PP were positively as-sociated during P2 (log–log transformation, Fig. 5 and in Van Wambeke et al., 2016), we found no direct correlation between TEP and PP for either linear (Table S2) or log-transformed regression (not shown). This coupling between PP and BP, while a concurrent association between TEP and
Figure 5. Relationship between heterotrophic bacterial production (BP) (ng C L−1h−1) and TEP concentrations (µg GX L−1) during phase 2 (days 15–23) when BP increased following the enhanced PP (Van Wambeke et al., 2016), for Mesocosm 1 (M1, red dots), Mesocosm 2 (M2, blue dots), Mesocosm 3 (M3, green dots). Pear-son’s linear regressions yielded R2=0.57 for M1, 0.42 for M2, and 0.56 for M3 respectively. Significant correlations were observed for all mesocosms and are detailed in Table S2. Error bars represent ±1 standard deviation.
BP occurred during P2, indicates TEP may have been uti-lized by bacteria as a carbon source (Azam, 1998; Ziervogel et al., 2014) or provided a suitable niche for aggregation and proliferation of heterotrophic bacteria.
TEP and diazotrophic populations
Overall N2 fixation rates were not significantly correlated
with TEP concentrations at any time throughout the exper-iment (Table S2); neither could we discern any direct evi-dence of TEP providing a carbon source for heterotrophic diazotrophs as was found previously in the Gulf of Aqaba where these organisms contributed greatly to the N2
fixa-tion rates (Rahav et al., 2015). Indeed, no relafixa-tionship was found between TEP concentrations and the abundance or growth rates of the heterotrophic diazotrophs γ -24774A11 (Moisander et al., 2014). Although these organisms were present throughout the experiment, and increased ∼ fourfold from day 9 to 15 especially in M3, they contributed only a small fraction to the total diazotrophic biomass and N2
fixa-tion rates (Turk-Kubo et al., 2015).
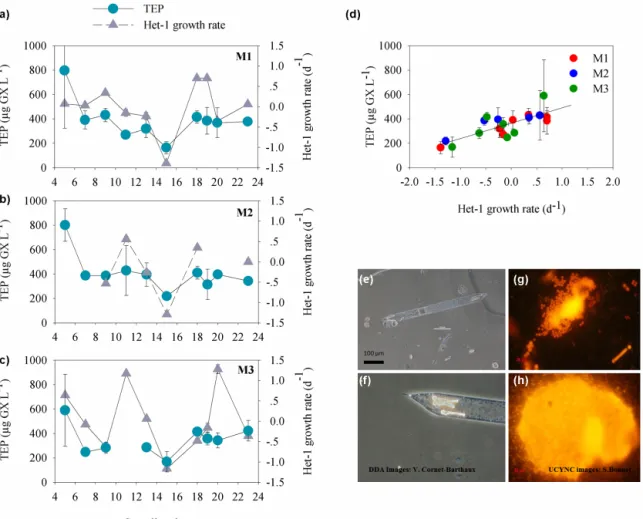
However, discerning individual diazotroph populations re-vealed some species-specific correspondence to TEP at cer-tain periods during the experiment. For example, through-out the experiment, net growth rates (i.e., based on differ-ences of nifH copies L−1 from day to day) of the DDA Richelia (Het-1) associated with Rhizosolenia (Turk-Kubo et al., 2015) temporally paralleled TEP concentrations in all mesocosms (Fig. 6a, b, c, e, f). During both P1 and P2, TEP concentrations were positively correlated with the net growth rates of Het-1 (R2=0.6, P = 0.0001, n = 19 for all
meso-cosms) (Fig. 6d). Although the DDAs dominated the dia-zotroph community during P1 (primarily Het-1), their over-all contribution to diatom biomass in the mesocosm was low, with only 2–8 % of all diatom biomass (Leblanc et al., 2016). We did not observe an overall relationship between TEP and total diatom biomass throughout VAHINE although di-atoms are well known for their TEP production especially when nutrients are limiting and growth rates decline (Fukao et al., 2010; Urbani et al., 2005). Thus, the positive associa-tion between TEP and the growth rates of Het-1 and not of the other DDAs Het-2 and Het-3 is intriguing.
TEP were also associated with the growth rates of the uni-cellular UCYN-C diazotrophs that bloomed during P2 and dominated the N2fixation rates of this period (Berthelot et
al., 2015; Turk-Kubo et al., 2015). During P2, UCYN-C net growth rates were positively correlated with increasing TEP concentrations (R2=0.65, 0.83, 0.88 for M1, M2, M3 re-spectively, p < 0.05). Furthermore, UCYN-C probably pro-duced an organic matrix possibly also comprised of TEP that aided the formation of large aggregates (100–500 µm) (Fig. 6g, h). These aggregates were predominantly respon-sible for the enhanced export production (22.4 ± 5 % of ex-ported POC) (Bonnet et al., 2016a; Knapp et al., 2015). High TEP content was obtained from sediment traps on days 15 and 16 (Fig. S1), corresponding to the height of the UCYN-C bloom in the mesocosms (Turk-Kubo et al., 2015) and sub-stantiating the role of TEP in facilitating export flux in the New Caledonian lagoon (Mari et al., 2007).
4 Conclusions
Although physically separated from the surrounding lagoon, TEP formation and breakdown was difficult to tease out in the VAHINE mesocosms where abiotic drivers (turbulence, shear forces, chemical coagulation) and biotic processes (al-gal and bacterial production and utilization) maintained an apparently constant pool of TEP within the TOC. Total TEP content was generally stable throughout the experimental pe-riod of 23 days and comprised ∼ 28 % of the TOC in the mesocosms and lagoon, with uniform distribution in the three sampled depths of the 15 m deep-water column.
TEP concentrations appeared to be impacted indirectly via changes in DIP availability as it was biologically con-sumed in the mesocosms after fertilization. Thus, declin-ing P availability (low DIP, rapid TDIP, and increased APA)
was associated with higher TEP content in all mesocosms. TEP concentrations were also positively associated with net growth rates of two important diazotrophic groups: the DDA Richelia–Rhizosolenia(Fig. 6e, f), during P1 and P2 (exclud-ing days 21–23); and UCYN-C diazotrophs which bloomed during P2. High TEP content in the sediment traps dur-ing the UCYN-C bloom indicates that TEP may have been part of the organic matrix associated with the large
aggre-Figure 6. Temporal changes in TEP concentrations and Het-1 net growth rates (d−1), (gray triangles) for (a) Mesocosm 1 (M1), (b) Meso-cosm 2 (M2), and (c) MesoMeso-cosm 3 (M3). TEP concentrations were averaged from the three depths sampled per mesoMeso-cosm (green circles). Het-1 net growth rates were calculated based on changes of nifH copies L−1(Turk-Kubo et al., 2015) measured every other day. (d) Re-lationship between TEP concentrations (µg GX L−1) and Het-1 growth rate (d−1) for all three mesocosms. Significant correlations were observed (Pearson) from all mesocosms together. R2=0.60, p = 0.0001, n = 19. Error bars represent ±1 standard deviation. (e, f) Epi-fluorescent microscopical images of the diatom–diazotroph association Richelia–Rhizosolenia identified by Het-1 abundance. Images by V. Cornet-Barthaux. (g, h) The diazotroph UCYN-C which bloomed and formed large aggregates (comprised also of TEP) that enhanced vertical flux and export production during P2. Images by S. Bonnet.
gates of UCYN-C that were exported to the sediment traps (Fig. 6g, h).
TEP may have also provided bacteria with a rich organic carbon source, especially during P2 when higher BP (stimu-lated by the higher PP) was positively corre(stimu-lated with higher TEP concentrations. High production of TEP also occurred in the lagoon water outside the mesocosms on day 23 during the decline of a short-lived dense surface bloom of the dia-zotrophic Trichodesmium (Spungin et al., 2016). Our results emphasize the complexities of the natural system and suggest that to understand the role of compounds such as TEP, and their contribution to the DOC and POC pools, a wider per-spective and range of methodologies should be undertaken to examine and characterize the different components of marine
gels (not only carbohydrate-based) (Bar-Zeev et al., 2015; Verdugo, 2012).
The Supplement related to this article is available online at doi:10.5194/bg-13-3793-2016-supplement.
Author contributions. Ilana Berman-Frank conceived and designed the investigation of TEP dynamics within the VAHINE project. Thierry Moutin, France Van Wambeke, Ilana Berman-Frank, Dina Spungin, and Eyal Rahav participated in the experiment and per-formed analyses of samples and data; Kendra Turk-Kubo analyzed diazotrophic populations. Ilana Berman-Frank and Dina Spungin wrote the manuscript with contributions from all co-authors.
Acknowledgements. Many thanks to Sophie Bonnet who created, designed, and successfully executed the VAHINE project. The par-ticipation of Ilana Berman-Frank, Dina Spungin, and Eyal Rahav in the VAHINE experiment was supported by the German-Israeli Re-search Foundation (GIF), project number 1133-13.8/2011, through a collaborative grant (no. 2012/3-9246) to Ilana Berman-Frank and Sophie Bonnet and C. Dupouy from the Israel Ministry of Science and Technology (MOST) and the High Council for Science and Technology (HCST) France, and a grant (no. 2008048) from the United States-Israel Binational Science Foundation (BSF) to Ilana Berman-Frank. Funding for this research was provided by the Agence Nationale de la Recherche (ANR starting grant VAHINE ANR-13-JS06-0002), INSU-LEFE-CYBER program, GOPS, IRD, and M.I.O. The authors thank the captain and crew of the R/V Alis, the SEOH divers service from the IRD research center of Noumea (E. Folcher, B. Bourgeois, and A. Renaud) and from the Observatoire Océanologique de Villefranche-sur-mer (OOV, J. M. Grisoni), and the technical service and support of the IRD research center of Noumea. Thanks are also expressed to C. Guieu, F. Louis, and J. M. Grisoni from OOV for mesocosm design and deployment advice. Special thanks to H. Berthelot and all other participants and principal investigators of the project for the joint efforts and for making their data available for further analyses and to the reviewers who helped improve the manuscript. This work is in partial fulfillment of the requirements for a PhD thesis for Dina Spungin at Bar Ilan University.
Edited by: S. Bonnet
References
Alldredge, A. L., Passow, U., and Logan, B. E.: The abundance and significance of a class of large, transparent organic particles in the ocean., Deep-Sea Res., 40, 1131–1140, 1993.
Aminot, A. and Kérouel, R.: Dosage automatique des nutriments dans les eaux marines: Méthodes en flux continu, Editions Quae, Netherlands, 2007.
Azam, F.: Microbial control of oceanic carbon flux: The plot thick-ens, Science, 280, 694–696, 1998.
Azam, F. and Malfatti, F.: Microbial structuring of marine ecosys-tems, Nat. Rev. Microbiol., 5, 782–791, 2007.
Azetsu-Scott, K. and Passow, U.: Ascending marine particles: sig-nificance of transparent exopolymer particles (TEP) in the upper ocean, Limnol. Oceanogr., 49, 741–748, 2004.
Bar-Zeev, E., Berman-Frank, I., Liberman, B., Rahav, E., Passow, U., and Berman, T.: Transparent exopolymer particles: Potential agents for organic fouling and biofilm formation in desalination and water treatment plants, Desalination and Water Treatment, 3, 136–142, 2009.
Bar-Zeev, E., Berman, T., Rahav, E., Dishon, G., Herut, B., Kress, N., and Berman-Frank, I.: Transparent exopolymer particle (TEP) dynamics in the eastern Mediterranean Sea, Mar. Ecol.-Prog. Ser., 431, 107–118, doi:10.3354/meps09110, 2011. Bar-Zeev, E., Passow, U., Romero-Vargas Castrilloìn, S., and
Elim-elech, M.: Transparent exopolymer particles: from aquatic envi-ronments and engineered systems to membrane biofouling, Env-iron. Sci. Technol., 49, 691–707, 2015.
Beauvais, S., Pedrotti, M. L., Villa, E., and Lemee, R.: Transpar-ent exopolymer particle (TEP) dynamics in relation to trophic and hydrological conditions in the NW Mediterranean Sea, Mar. Ecol.-Prog. Ser., 262, 97–109, 2003.
Benavides, M., Moisander, P. H., Berthelot, H., Dittmar, T., Grosso, O., and Bonnet, S.: Mesopelagic N2 Fixation
Re-lated to Organic Matter Composition in the Solomon and Bis-marck Seas (Southwest Pacific), PLoS ONE, 10, e0143775, doi:10.1371/journal.pone.0143775, 2015.
Berman-Frank, I. and Dubinsky, Z.: Balanced growth in aquatic plants: Myth or reality? Phytoplankton use the imbalance be-tween carbon assimilation and biomass production to their strate-gic advantage, Bioscience, 49, 29–37, 1999.
Berman-Frank, I., Rosenberg, G., Levitan, O., Haramaty, L., and Mari, X.: Coupling between autocatalytic cell death and trans-parent exopolymeric particle production in the marine cyanobac-terium Trichodesmium, Environ. Microbiol., 9, 1415–1422, 2007.
Berthelot, H., Moutin, T., L’Helguen, S., Leblanc, K., Hélias, S., Grosso, O., Leblond, N., Charrière, B., and Bonnet, S.: Dinitro-gen fixation and dissolved organic nitroDinitro-gen fueled primary pro-duction and particulate export during the VAHINE mesocosm experiment (New Caledonia lagoon), Biogeosciences, 12, 4099– 4112, doi:10.5194/bg-12-4099-2015, 2015.
Biegala, I. C. and Raimbault, P.: High abundance of diazotrophic picocyanobacteria (< 3 µm) in a Southwest Pacific coral lagoon, Aquat. Microb. Ecol., 51, 45–53, 2008.
Bonnet, S., Berthelot, H., Turk-Kubo, K., Fawcett, S., Rahav, E., L’Helguen, S., and Berman-Frank, I.: Dynamics of N2
fixa-tion and fate of diazotroph-derived nitrogen in a low-nutrient, low-chlorophyll ecosystem: results from the VAHINE mesocosm experiment (New Caledonia), Biogeosciences, 13, 2653–2673, doi:10.5194/bg-13-2653-2016, 2016a.
Bonnet, S., Moutin, T., Rodier, M., Grisoni, J.-M., Louis, F., Folcher, E., Bourgeois, B., Boré, J.-M., and Renaud, A.: In-troduction to the project VAHINE: VAriability of vertical and tropHIc transfer of diazotroph derived N in the south wEst Pa-cific, Biogeosciences, 13, 2803–2814, doi:10.5194/bg-13-2803-2016, 2016b.
Brussaard, C., Mari, X., Van Bleijswijk, J., and Veldhuis, M.: A mesocosm study of Phaeocystis globosa (Prymnesiophyceae) population dynamics: II. Significance for the microbial commu-nity, Harmful Algae, 4, 875–893, 2005.
Capone, D. G.: Marine nitrogen fixation: what’s the fuss?, Curr. Opin. Microbiol., 4, 341–348, 2001.
Duhamel, S., Zeman, F., and Moutin, T.: A dual-labeling method for the simultaneous measurement of dissolved inorganic car-bon and phosphate uptake by marine planktonic species, Limnol. Oceanogr., 4, 416–425, 2006.
Dupouy, C., Neveux, J., Subramaniam, A., Mulholland, M. R., Montoya, J. P., Campbell, L., Capone, D. G., and Carpenter, E. J.: Satellite captures Trichodesmium blooms in the SouthWestern Tropical Pacific, EOS T. Am. Geophys. Un., 81, 13–16, 2000. Engel, A.: The role of transparent exopolymer particles (TEP) in the
increase in apparent particle stickiness (α) during the decline of a diatom bloom, J. Plankton Res., 22, 485–497, 2000.
Engel, A.: Distribution of transparent exopolymer particles (TEP) in the northeast Atlantic Ocean and their potential significance for aggregation processes, Deep-Sea Res. Pt. I, 51, 83–92, 2004.
Engel, A. and Passow, U.: Carbon and nitrogen content of transpar-ent exopolymer particles (TEP) in relation to their Alcian Blue adsorption, Mar. Ecol.-Prog. Ser., 219, 1–10, 2001.
Engel, A., Goldthwait, S., Passow, U., and Alldredge, A.: Tempo-ral decoupling of carbon and nitrogen dynamics in a mesocosm diatom bloom, Limnol. Oceanogr., 47, 753–761, 2002.
Engel, A., Harlay, J., Piontek, J., and Chou, L.: Contribution of com-bined carbohydrates to dissolved and particulate organic carbon after the spring bloom in the northern Bay of Biscay (North-Eastern Atlantic Ocean), Cont. Shelf Res., 45, 42–53, 2012. Eppley, R. W. and Peterson, B. J.: Particulate organic-matter flux
and planktonic new production in the deep ocean, Nature, 282, 677–680, doi:10.1038/282677a0, 1979.
Falkowski, P. G.: Evolution of the nitrogen cycle and its influence on the biological sequestration of CO2in the ocean, Nature, 387,
272–275, 1997.
Fukao, T., Kimoto, K., and Kotani, Y.: Production of transparent exopolymer particles by four diatom species, Fisheries Sci., 76, 755–760, 2010.
García, C., Prieto, L., Vargas, M., Echevarría, F., Garcia-Lafuente, J., Ruiz, J., and Rubin, J.: Hydrodynamics and the spatial dis-tribution of plankton and TEP in the Gulf of Cadiz (SW Iberian Peninsula), J. Plankton Res., 24, 817–833, 2002.
Garcia, N., Raimbault, P., and Sandroni, V.: Seasonal nitro-gen fixation and primary production in the Southwest Pa-cific: nanoplankton diazotrophy and transfer of nitrogen to picoplankton organisms, Mar. Ecol.-Prog. Ser., 343, 25–33, doi:10.3354/meps06882, 2007.
Grossart, H. P., Simon, M., and Logan, B. E.: Formation of macro-scopic organic aggregates (lake snow) in a large lake: The signif-icance of transparent exopolymer particles, plankton, and zoo-plankton, Limnol. Oceanogr., 42, 1651–1659, 1997.
Hong, Y., Smith, W. O., and White, A. M.: Studies on transparent exopolymer particles (TEP) produced in the ross sea (antarctica) and by Phaeocystis antarctica (prymnesiophyceae), J. Phycol., 33, 368–376, 1997.
Hoppe, H. G.: Significance of exoenzymatic activities in the ecology of brackish water: measurements by means of methylumbelliferyl-substrates, Mar. Ecol.-Prog. Ser., 11, 299– 308, 1983.
Kirchman, D. L.: Leucine incorporation as a measure of biomass production by heterotrophic bacteria, in: Current Methods in Aquatic Microbial Ecology, edited by: Kemp, P., Sherr, B. E., Sherr, E. B., and Cole, J. J., Lewis Publishers, Boca Raton, FL, USA, 509–512, 1993.
Knapp, A. N., Fawcett, S. E., Martínez-Garcia, A., Leblond, N., Moutin, T., and Bonnet, S.: Nitrogen isotopic evidence for a shift from nitrate- to diazotroph-fueled export production in VAHINE mesocosm experiments, Biogeosciences Discuss., 12, 19901– 19939, doi:10.5194/bgd-12-19901-2015, 2015.
Leblanc, K., Cornet, V., Caffin, M., Rodier, M., Desnues, A., Berth-elot, H., Turk-Kubo, K., and Heliou, J.: Phytoplankton commu-nity structure in the VAHINE MESOCOSM experiment, Biogeo-sciences Discuss., doi:10.5194/bg-2015-605, in review, 2016. Logan, B. E., Passow, U., Alldredge, A. L., Grossartt, H.-P., and
Si-mont, M.: Rapid formation and sedimentation of large aggregates is predictable from coagulation rates (half-lives) of transparent exopolymer particles (TEP), Deep-Sea Res. Pt. II, 42, 203–214, 1995.
Mari, X. and Burd, A.: Seasonal size spectra of transparent exopoly-meric particles (TEP) in a coastal sea and comparison with those predicted using coagulation theory, Mar. Ecol.-Prog. Ser., 163, 63–76, 1998.
Mari, X., Beauvais, S., Lemée, R., and Pedrotti, M. L.: Non-Redfield C : N ratio of transparent exopolymeric particles in the northwestern Mediterranean Sea, Limnol. Oceanogr., 46, 1831– 1836, 2001.
Mari, X., Kerros, M. E., and Weinbauer, M. G.: Virus attachment to transparent exopolymeric particles along trophic gradients in the southwestern lagoon of New Caledonia, Appl. Environ. Microb., 73, 5245–5252, doi:10.1128/aem.00762-07, 2007.
Mohr, W., Grosskopf, T., Wallace, D. W., and LaRoche, J.: Method-ological underestimation of oceanic nitrogen fixation rates, PLoS ONE, 5, e12583, doi:10.1371/journal.pone.0012583, 2010. Moisander, P. H., Serros, T., Paerl, R. W., Beinart, R. A., and Zehr,
J. P.: Gammaproteobacterial diazotrophs and nifH gene expres-sion in surface waters of the South Pacific Ocean, ISME J., 8, 1962–1973, 2014.
Moutin, T., Thingstad, T. F., Van Wambeke, F., Marie, D., Slawyk, G., Raimbault, P., and Claustre, H.: Does competition for nanomolar phosphate supply explain the predominance of the cyanobacterium Synechococcus?, Limnol. Oceanogr., 47, 1562– 1567, 2002.
Moutin, T., Van Den Broeck, N., Beker, B., Dupouy, C., Rimmelin, P., and Le Bouteiller, A.: Phosphate availability controls Tri-chodesmiumspp. biomass in the SW Pacific Ocean, Mar. Ecol.-Prog. Ser., 297, 15–21, 2005.
Mulholland, M. R. and Capone, D. G.: The nitrogen physiology of the marine N2-fixing cyanobacteria Trichodesmium spp., Trends
Plant Sci., 5, 148–153, 2000.
Ortega-Retuerta, E., Reche, I., Pulido-Villena, E., Agustí, S., and Duarte, C. M.: Uncoupled distributions of transparent exopoly-mer particles (TEP) and dissolved carbohydrates in the Southern Ocean, Mar. Chem., 115, 59–65, 2009.
Passow, U.: Transparent exopolymer particles (TEP) in aquatic en-vironments, Prog. Oceanogr., 55, 287–333, 2002.
Passow, U. and Alldredge, A. L.: A dye binding assay for the spec-trophotometeric measurement of transparent exopolymer parti-cles (TEP), Limnol. Oceanogr., 40, 1326–1335, 1995.
Postgate, J. R. and Eady, R. R.: The evolution of biological nitrogen fixation, in: Nitrogen Fixation: One Hundred Years After, edited by: Bothe, H., DeBruijn, F. J., Newton, W. E., Gustav Fischer, Stuttgart, 31–40, 1988.
Prieto, L., Navarro, G., Cozar, A., Echevarria, F., and García, C. M.: Distribution of TEP in the euphotic and upper mesopelagic zones of the southern Iberian coasts, Deep-Sea Res. Pt. II, 53, 1314– 1328, 2006.
Radi´c, T., Degobbis, D., Fuks, D., Radi´c, J., and Ðakovac, T.: Sea-sonal cycle of transparent exopolymer particles’ formation in the northern Adriatic during years with (2000) and without mucilage events (1999), Fresen. Environ. Bull., 14, 224–230, 2005. Rahav, E., Bar-Zeev, E., Ohayion, S., Elifantz, H., Belkin, N., Herut,
B., Mulholland, M. R., and Berman-Frank, I. R.: Dinitrogen fix-ation in aphotic oxygenated marine environments, Frontiers in Microbiology, 4, 227, doi:10.3389/fmicb.2013.00227, 2013. Rahav, E., Herut, B., Mulholland, M. R., Belkin, N., Elifantz, H.,
contribu-tion to dinitrogen fixacontribu-tion in the Gulf of Aqaba, Mar. Ecol.-Prog. Ser., 522, 67–77, 2015.
Rochelle-Newall, E., Torreton, J.-P., Mari, X., and Pringault, O.: Phytoplankton-bacterioplankton coupling in a subtropical South Pacific coral reef lagoon, Aquat. Microb. Ecol., 50, 221–229, 2008.
Rodier, M. and Le Borgne, R.: Population dynamics and en-vironmental conditions affecting Trichodesmium spp. (fila-mentous cyanobacteria) blooms in the south-west lagoon of New Caledonia, J. Exp. Mar. Biol. Ecol., 358, 20–32, doi:10.1016/j.jembe.2008.01.016, 2008.
Rodier, M. and Le Borgne, R.: Population and trophic dynamics of Trichodesmium thiebautiiin the SE lagoon of New Caledonia. Comparison with T. erythraeum in the SW lagoon, Mar. Pollut. Bull., 61, 349–359, doi:10.1016/j.marpolbul.2010.06.018, 2010. Smith, D. C. and Azam, F.: A simple, economic method for measur-ing bacterial protein synthesis rates in seawater usmeasur-ing3H-leucine, Marine Microbial Food Webs, 6, 107–114, 1992.
Spungin, D., Pfreundt, U., Berthelot, H., Bonnet, S., AlRoumi, D., Natale, F., Hess, W. R., Bidle, K. D., and Berman-Frank, I.: Mechanisms of Trichodesmium bloom demise within the New Caledonia Lagoon during the VAHINE mesocosm experiment, Biogeosciences Discuss., doi:10.5194/bg-2015-613, in review, 2016.
Stam, H., Stouthamer, A. H., and van Verseveld, H. W.: Hydrogen metabolism and energy costs of nitrogen fixation, FEMS Micro-biol. Rev., 46, 73–92, 1987.
Stoderegger, K. E. and Herndl, G. J.: Production of exopolymer par-ticles by marine bacterioplankton under contrasting turbulence conditions, Mar. Ecol.-Prog. Ser., 189, 9–16, 1999.
Tedetti, M., Marie, L., Röttgers, R., Rodier, M., Van Wambeke, F., Helias, S., Caffin, M., Cornet-Barthaux, V., and Dupouy, C.: Evolution of dissolved and particulate chromophoric materials during the VAHINE mesocosm experiment in the New Cale-donian coral lagoon (south-west Pacific), Biogeosciences, 13, 3283–3303, doi:10.5194/bg-13-3283-2016, 2016.
Thurman, E.: Organic Geochemistry of Natural Waters, Martinus Nijhoff/Dr W. Junk Publishers, Dordrecht, Netherlands, 1985. Turk-Kubo, K. A., Frank, I. E., Hogan, M. E., Desnues, A.,
Bon-net, S., and Zehr, J. P.: Diazotroph community succession during the VAHINE mesocosm experiment (New Caledonia lagoon), Biogeosciences, 12, 7435–7452, doi:10.5194/bg-12-7435-2015, 2015.
Urbani, R., Magaletti, E., Sist, P., and Cicero, A. M.: Extracellu-lar carbohydrates released by the marine diatoms Cylindrotheca closterium, Thalassiosira pseudonana and Skeletonema costa-tum: Effect of P-depletion and growth status, Sci. Total Environ., 353, 300–306, 2005.
Van Wambeke, F., Pfreundt, U., Barani, A., Berthelot, H., Moutin, T., Rodier, M., Hess, W. R., and Bonnet, S.: Heterotrophic bacte-rial production and metabolic balance during the VAHINE meso-cosm experiment in the New Caledonia lagoon, Biogeosciences, 13, 3187–3202, doi:10.5194/bg-13-3187-2016, 2016.
Verdugo, P.: Marine microgels, Annual Review of Marine Science, 4, 375–400, 2012.
Verdugo, P. and Santschi, P. H.: Polymer dynamics of DOC net-works and gel formation in seawater, Deep-Sea Res. Pt. II, 57, 1486–1493, 2010.
Villacorte, L. O., Ekowati, Y., Calix-Ponce, H. N., Schippers, J. C., Amy, G. L., and Kennedy, M. D.: Improved method for measur-ing transparent exopolymer particles (TEP) and their precursors in fresh and saline water, Water Res., 70, 300–312, 2015. Wood, A. and Van Valen, L.: Paradox lost? On the release of
energy-rich compounds by phytoplankton, Microbial Food Webs, 4, 103–116, 1990.
Wurl, O., Miller, L., and Vagle, S.: Production and fate of trans-parent exopolymer particles in the ocean, J. Geophys. Res., 116, C00H13, doi:10.1029/2011JC007342, 2011.
Zehr, J. P. and Kudela, R. M.: Nitrogen Cycle of the Open Ocean: From Genes to Ecosystems, Annual Review of Marine Science, 3, 197–225, 2011.
Zhou, J., Mopper, K., and Passow, U.: The role of surface-active carbohydrates in the formation of transparent exopolymer par-ticles by bubble adsorption of seawater, Limnol. Oceanogr., 43, 1860–1871, 1998.
Ziervogel, K., D’souza, N., Sweet, J., Yan, B., and Passow, U.: Natural oil slicks fuel surface water microbial activities in the northern Gulf of Mexico, Frontiers in Microbiology, 5, 188, doi:10.3389/fmicb.2014.00188, 2014.