HAL Id: hal-01278935
https://hal.archives-ouvertes.fr/hal-01278935
Submitted on 25 Feb 2016
HAL is a multi-disciplinary open access
archive for the deposit and dissemination of
sci-entific research documents, whether they are
pub-lished or not. The documents may come from
teaching and research institutions in France or
abroad, or from public or private research centers.
L’archive ouverte pluridisciplinaire HAL, est
destinée au dépôt et à la diffusion de documents
scientifiques de niveau recherche, publiés ou non,
émanant des établissements d’enseignement et de
recherche français ou étrangers, des laboratoires
publics ou privés.
Modelling full waveform Lidar data on forest structures
at plot level : a sensitivity analysis of forest and sensor
main characteristics on full-waveform simulated data
E. Grau, S. Durrieu, Cécile Antin, H. Debise, Grégoire Vincent, C. Lavalley,
M. Bouvier
To cite this version:
E. Grau, S. Durrieu, Cécile Antin, H. Debise, Grégoire Vincent, et al.. Modelling full waveform Lidar
data on forest structures at plot level : a sensitivity analysis of forest and sensor main characteristics
on full-waveform simulated data. SilviLaser 2015, Sep 2015, La Grande Motte, France. pp.146-148.
�hal-01278935�
Modelling full waveform Lidar data on forest structures at plot level: a sensitivity
analysis of forest and sensor main characteristics on full-waveform simulated data.
Eloi Grau
1,2, Sylvie Durrieu
2, Cécile Antin
3, Henri Debise
2, Grégoire Vincent
3, Claudia Lavalley
2,
Marc Bouvier
21CNES, UMR TETIS, 34196 Montpellier, France 2Irstea, UMR TETIS, 34196 Montpellier, France 3IRD, UMR AMAP, Montpellier, 34000 France
Highlights: Spatial full-waveform Lidar signal sensitivity to both forest and sensor characteristics was
studied using DART Radiative Transfer model. The study focuses on testing various approaches to
simulate forest canopies. A sensitivity study of main forest and instrumental parameters on a new set
of Lidar metrics is presented.
Key words: full-waveform, simulation, radiative transfer, sensitivity analysis
Introduction
Light detection and ranging (Lidar) has become widely used for measuring and monitoring vegetation characteristics. Lidar sensors are mostly deployed using airborne platforms, but the Geoscience Laser Altimeter System (GLAS) instrument of the Ice, Cloud and Land Elevation Satellite (ICESat) space mission has also collected data globally from space [1]. GLAS instrument was mainly designed to measure ice elevation at global scale, thus limiting its performance for forest measurements. Satellite-based Lidar data collection offers consistent, synoptic samples of surface characteristic measurements at a global scale. Preparing a future full-waveform Lidar satellite mission designed for vegetation monitoring requires studying the impact of the instrumental and experimental conditions on the recorded signal.
Simulating Lidar data with a radiative transfer model is a powerful approach to study the link between environmental parameters (forest structure, optical properties and Leaf Area Index -LAI, ground digital elevation model -DEM, and atmosphere properties), sensor characteristics (viewing angle, footprint radius, pulse energy), and recorded waveforms. A 3D radiative transfer model can be used to control every aspect of the experimental and acquisition conditions. In such a radiative transfer model, a forest stand can be represented in a variety of way (e.g. at tree level versus plot level, with turbid medium for leaves versus facets or meshes), depending on the data used to create the simulated stand and the degree of approximation required for the simulated waveforms.
The main goal of this study was twofold. The first objective was to evaluate the impact of the stand representation type on the shape of the waveforms and to identify which stand representations can be used to provide realistic large footprint full-waveforms. To that aim several approaches to represent real forest plots were used as input scenes in the radiative transfer model and the waveforms simulated using the several scenes were compared to real Lidar data acquired on same forest plots. The second objective was to evaluate to what extent using one kind of stand representation can impact the results of a sensitivity analysis carried out in order to study the link between environmental parameters (LAI, optical properties, slope), sensor characteristics (footprint radius, scanning angle) and full waveform signals recorded by either small or large footprint Lidar (i.e. space Lidar). This study should provide insights into which stand representation is needed to conduct reliable sensitivity analyses to help designing future space-borne Lidar missions.
Materials and methods
We simulated 4 Maritime pine plots based on a field campaign conducted in the study site of Saint-Symphorien, France (44.4° N, 0.5° W). This forest area is dominated by mono-specific Maritime pine (Pinus
Pinaster) in even aged plantations. The campaign included field measurements (diameter at breast height, total
height, height of crown base of the trees in 15 m radius plots) and Terrestrial Laser Scanning (TLS). In addition, contemporaneous Aerial Laser Scanning (ALS) data were available.
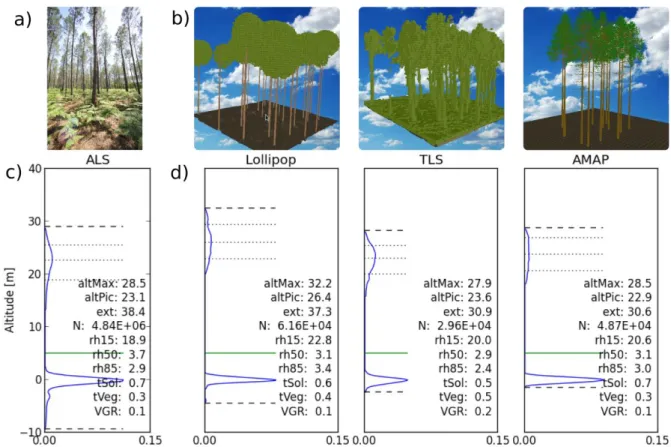
The virtual forest scenes were created using 3 different approaches: (1) “Lollipop” scenes made up of ellipsoid tree crowns (where leaves are represented with turbid medium) and conical trunks with dimensions based on in-situ measurements and positioned using TLS scans, (2) “TLS” scenes made up of a 3D distribution of turbid voxels characterized by their vegetation density estimated by processing TLS data [2], and (3) “AMAP” scenes , realistic representations of stands in which tree elements are represented by triangles (meshes). These virtual realistic forest scenes were created based on the botanical knowledge of plant architectural
development and takes into account plant-to-plant interactions. The scenes were produced using the AmapSim software [3], part of AMAPstudio, a software suite for plant architecture modelling. Radiative transfer simulation was done using DART (Discrete Anisotropic Radiative Transfer) software [4], allowing an accurate and customizable modelling.
The quality of virtual scenes as regards the simulation of Lidar signal was assessed by comparing in terms of derived Lidar metrics ALS simulations obtained using the same characteristics as those of the actual ALS survey (i.e. pulse density, flight height, beam divergence) to the real ALS data. These Lidar metrics were computed on aggregated Lidar signal at plot level, in order to compare them with Space Lidar Signal (SLS) simulations. Aggregation consists in creating a single waveform corresponding to a vertical large-footprint shot from all the ALS small-footprint waveforms included in the large-footprint. The values of the aggregated waveform bins is calculated by summing the weighted numerical counts stored in the bins of the ALS georeferenced waveforms for each corresponding altitude.
Lidar metrics were computed using a new method: first, the waveform is ortho-rectified correction of the zenith angle of the Lidar), and bins are referenced in order to have the ground level (mean of the Digital Elevation Model - DEM) at height bin zero. Then the waveform is noise filtered, normalized and divided into 2 parts (ground / vegetation). Finally, Lidar metrics are computed considering 3 sets of metrics related to, respectively: (1) the vegetation waveform component, i.e. the part of the waveform corresponding to the signal backscattered by the vegetation (integral of the waveform “tVeg”, heights corresponding to 3 percentiles of the vegetation waveform “rh%” and to the maximum peak intensity “altPic”), (2) the ground component, i.e. the part of the waveform corresponding to the signal backscattered by the ground (integral of the waveform “tSol”) and (3) the whole waveform (normalization factor “N”, extension of the waveform “ext”, and vegetation peak / ground peak ratio “VGR”).
The sensitivity analysis was conducted by changing the initial characteristics of the scenes (tree LAI, ground reflectance, vegetation reflectance, slope, understorey grass LAI) and Lidar acquisition parameters (scan angle, footprint radius, footprint position), independently, and measuring their impact in terms of Lidar metric changes. Comparison was performed on the three types of scenes.
Figure 1: a) Photography of the plot. b) 3D view of the different types of mock-up used in this study for 1 forest plot. c) ALS aggregated measured waveform and associated Lidar metrics, and d) simulated waveforms for the 3
types of virtual scenes and associated Lidar metrics.
Results
Aggregation of actual ALS data allowed a comparison with ALS and SLS simulated data. Firstly, a good agreement was found for each type of virtual scenes and for each plot between Lidar metrics computed from aggregated ALS and SLS when both resulted from simulations. This can be explained by the high number of
ALS shots used to sample each plot. Secondly, the comparison of metrics computed from the waveforms resulting from the aggregation of real ALS data with metrics computed from the simulated SLS waveforms also showed good agreement, provided the virtual scenes are correctly calibrated. Calibration requirements depend on the scene type (low requirements for TLS scenes, whereas for lollipop scenes and even more for AMAP scenes adjustments of some scene characteristics were needed to obtain a good fit between simulated and real data).
Preliminary results of the sensitivity study show various effects of the forest and sensor characteristics on Lidar metrics. Among the environmental parameters, tree LAI and slope were found to be the most impacting parameters. Impact of the reflectance values (ground and vegetation) was not negligible, but affects almost only global metrics (N, VGR). Among the sensor characteristics, the impact of both the footprint radius and the position of the footprint center were limited, due to the relative homogeneity of the forest stand at the study scale. On the contrary, change in scan angle significantly impacted most Lidar metrics.
Conclusion
Different ways to simulate forest canopies used in a radiative transfer model have been tested. Each representation needs different inputs and calibration efforts, and produces virtual scenes with different level of simplification. TLS virtual scenes were the most direct and simplest representations, but they still need to be calibrated in term of total plant area density (PAD), as current voxelization process tends to overestimate PAD and cannot separate woody material from leaves when assessing PAD. Furthermore, TLS acquisitions are useful to create DEM that can be used with any representation of the vegetation. Lollipop scenes required extensive field measurements (position, dbh, crown dimensions and shape) and also produced, despite their apparent simplicity, accurate simulated waveforms. AMAP scenes were the most accurate simulation of the vegetation, but are very costly to produce in terms of field measurements, preparation, calibration, and computation time. The ongoing sensitivity study will further reveal how Lidar derived metrics are affected by vegetation and sensor.
Acknowledgements
The authors acknowledge funding from the French CNES/TOSCA program. This work also benefitted from data acquired in the frame of the FORESEE project (ANR-2010-BIOE-008) granted by the French National Research Agency (ANR).
[1] Abshire, J.B., Sun, X., Riris, H., Sirota, J.M., McGarry, J.F., Palm, S., Yi, D., Liiva, P. (2005). Geoscience Laser Altimeter System (GLAS) on the ICESat mission: on-orbit measurement performance.
Geophysical Research Letters, 32 (21)
[2] Grau, E., Durrieu, S., Fournier, R., Gastellu-Etchegorry, J.P., Yin, T., Lauret, N., Bouvier M. (2014). Comparing voxelisation methods of 3D terrestrial laser scanning with Radiative Transfer simulation to assess vegetation density. ForestSat2014, oral presentation
[3] Barczi, J.-F., Rey, H., Caraglio, Y., de Reffye, P., Barthélémy, D., Dong, Q. X. & Fourcaud, T. (2008). AmapSim: A Structural Whole-Plant Simulator Based on Botanical Knowledge and Designed to Host External Functional Models. Annals of Botany, 101, 1125–1138.
[4] Gastellu-Etchegorry, J.-P., Yin, T. et al. (2015). "Discrete Anisotropic Radiative Transfer (DART 5) for Modeling Airborne and Satellite Spectroradiometer and LIDAR Acquisitions of Natural and Urban Landscapes.