HAL Id: hal-02879796
https://hal.inrae.fr/hal-02879796
Submitted on 27 Nov 2020
HAL is a multi-disciplinary open access
archive for the deposit and dissemination of sci-entific research documents, whether they are pub-lished or not. The documents may come from teaching and research institutions in France or abroad, or from public or private research centers.
L’archive ouverte pluridisciplinaire HAL, est destinée au dépôt et à la diffusion de documents scientifiques de niveau recherche, publiés ou non, émanant des établissements d’enseignement et de recherche français ou étrangers, des laboratoires publics ou privés.
Pathways to persistence: plant root traits alter carbon
accumulation in different soil carbon pools
Lorenzo Matteo Walter Rossi, Zhun Mao, Luis Merino-Martin, Catherine
Roumet, Florian Fort, Olivier Taugourdeau, Hassan Boukcim, Stéphane
Fourtier, Maria del Rey Granado, Tiphaine Chevallier, et al.
To cite this version:
Lorenzo Matteo Walter Rossi, Zhun Mao, Luis Merino-Martin, Catherine Roumet, Florian Fort, et al.. Pathways to persistence: plant root traits alter carbon accumulation in different soil carbon pools. Plant and Soil, Springer Verlag, 2020, 452, pp.457-478. �10.1007/s11104-020-04469-5�. �hal-02879796�
1
Supplementary Materials
1
Article: Pathways to persistence: plant root traits alter carbon accumulation in different soil carbon
2
pools
3
Lorenzo M.W. Rossia,b, Zhun Maoa, Luis Merino-Martína,c, Catherine Roumetc, Florian Fortd, Olivier
4
Taugourdeaue, Hassan Boukcime, Stéphane Fourtiera, Maria Del Rey-Granadoc, Tiphaine Chevallierf,
5
Rémi Cardinaelg,,,,i, Nathalie Frominc, Alexia Stokesa
6 7
Contact author: Lorenzo MW Rossi 8
Email: [email protected] 9
Address: AMAP, INRAE Montpellier, PS2 TA/A51, 34 398 Montpellier cedex 5, France 10
11
a) University of Montpellier, AMAP, INRAE, CIRAD, CNRS, IRD, PS2 TA/A51, 34 398 Montpellier cedex 12
5, France 13
b) University of Cassino, Via Di Biasio 43, 03043 Cassino (Fr), Italy. 14
c) CEFE, Univ Montpellier, CNRS, EPHE, IRD, Univ Paul Valéry, Montpellier, France 15
d) CEFE, CNRS, Univ Montpellier, Univ Paul Valéry Montpellier 3, EPHE, IRD, Montpellier, France 16
e) Valorhiz, 1900, Boulevard de la Lironde PSIII, Parc Scientifique Agropolis F-34980 Montferrier sur 17
Lez, France. 18
f) Eco&Sols, IRD, CIRAD, INRA, University of Montpellier, Montpellier SupAgro, Montpellier, France 19
g) CIRAD, UPR AIDA, Harare, Zimbabwe. 20
h) AIDA, University of Montpellier, CIRAD, Montpellier, France 21
i) Crop Science Department, University of Zimbabwe, Box MP167,Mt. Pleasant, Harare, Zimbabwe 22
2 Table S1: Pearson’s correlation coefficients (r) showing relationships between mean root elongation rate and climatic variables.
23
Variables tested include: mean daily soil temperature, mean daily air temperature, minimum daily air temperature, maximum daily air temperature, mean 24
daily solar radiation and a) RERTOT: mean root elongation rate of a single root, b) REROLD: mean root elongation rate of a single root that was already present
25
at the previous sampling date (i.e. that were older than 14 days), c) RERNEW: mean root elongation rate of a single newly initiated root (i.e. that were aged 1
26
to 14 days). The correlations were performed for data from each RER sampling date, i.e. every 2 weeks for each species over the 10 month period. 27 28 29 30 Soil temperature Mean air temperature Minimum air temperature Maximum air teperature Mean solar
radiation Family Species
Soil temperature Mean air temperature Minimum air temperature Maximum air teperature Mean solar radiation
Dactylis glomerata -0.23 -0.21 -0.1 -0.18 -0.1 Dactylis glomerata -0.27 -0.26 -0.17 -0.22 -0.12
Lolium perenne 0.01 -0.04 -0.03 0.09 0.38 Lolium perenne 0.14 0.13 0.31 0.09 0.21
Festuca rubra -0.21 -0.27 -0.34 -0.2 0.15 Festuca rubra -0.25 -0.3 -0.41 -0.25 0.05
Bromus erectus -0.02 -0.05 -0.01 0.02 0.29 Bromus erectus 0.17 0.28 -0.07 0.2 0.29
Poa pratensis 0.1 0.08 0.34 0.1 0.43 Poa pratensis -0.03 0 0.4 0.04 0.21
Trifolium repens 0.76*** 0.81*** 0.45 0.68** 0.33 Trifolium repens 0.28 0.28 0.15 0.4 0.45
Trifolium pratense 0.02 -0.02 -0.02 0.09 0.4 Trifolium pratense 0.18 0.25 -0.07 0.24 0.38
Lotus corniculatus 0.70** 0.70** 0.44 0.68** 0.72** Lotus corniculatus 0.73** 0.71** 0.51 0.74** 0.89***
Onobrychis viciifolia 0.13 0.09 0.3 0.17 0.54* Onobrychis viciifolia 0.04 0.02 0.26 0.07 0.36
Medicago sativa 0.01 0.01 -0.05 0.02 0.22 Medicago sativa 0.03 0.01 -0.05 0.03 0.23
Rosaceae Sanguisorba minor -0.06 -0.06 -0.06 -0.04 0.16 Rosaceae Sanguisorba minor 0.13 0.2 -0.08 0.1 -0.33
Plantaginaceae Plantago lanceolata 0 -0.04 0 0.04 0.3 Plantaginaceae Plantago lanceolata -0.05 -0.07 -0.05 -0.03 0.21
Soil temperature Mean air temperature Minimum air temperature Maximum air teperature Mean solar radiation Poaceae Dactylis glomerata -0.55* -0.54* -0.47 -0.60* -0.66**
Lolium perenne 0.03 0 -0.05 0.1 0.29
Festuca rubra -0.11 -0.16 -0.04 -0.15 0.26
Bromus erectus -0.06 -0.07 -0.08 -0.05 0.17
Poa pratensis 0.09 0.08 0.36 0.06 0.38
Fabaceae Trifolium repens 0.59* 0.67** 0.17 0.57* 0.17
Trifolium pratense 0.11 0.1 0.37 0.08 0.41
Lotus corniculatus 0.76*** 0.75** 0.48 0.76*** 0.76**
Onobrychis viciifolia 0.13 0.1 0.3 0.15 0.51
Medicago sativa 0.04 0.06 -0.35 0.04 0.21
Rosaceae Sanguisorba minor 0.09 0.16 0.04 0.06 -0.05
Plantaginaceae Plantago lanceolata -0.05 -0.06 -0.06 -0.03 0.19
Poaceae Poaceae
a - Correlation between climate factors and RERTOT of the total root system b - Correlation between climate factors and REROLD of the old roots
c - Correlation between climate factors and RERNEW of new roots
3 31
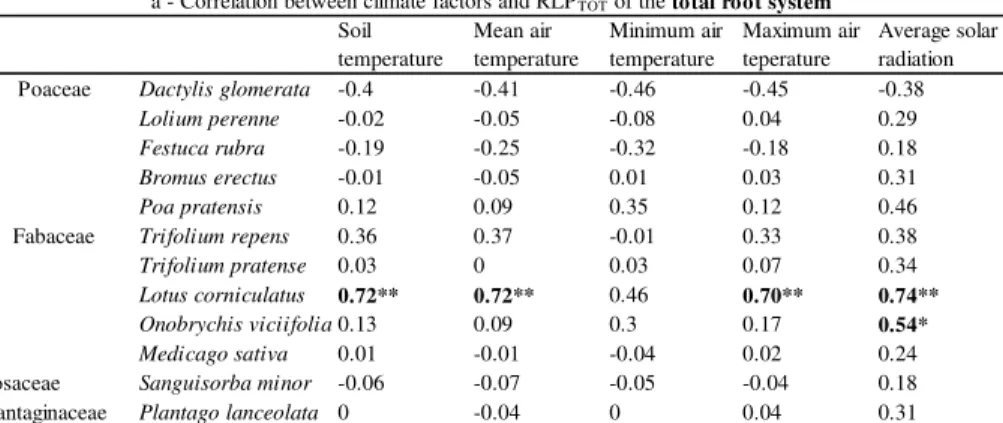
Table S2: Pearson’s correlation coefficients (r) showing relationships between cumulative root length production and climatic variables. 32
Variables tested include: mean daily soil temperature, mean daily air temperature, minimum daily air temperature, maximum daily air temperature, mean 33
daily solar radiation and a) RLPTOT: cumulative root length production of the 30 roots that were analysed, b) RLPOLD: cumulative root length production of roots
34
that were already present at the previous sampling date (i.e. that were older than 14 days), c) RLPNEW: cumulative root length production of newly initiated
35
roots (i.e. that were aged 1 to 14 days). The correlations were performed for data from each RLP sampling date, i.e. every 2 weeks for each species over the 36 10 month period. 37 38 Soil temperature Mean air temperature Minimum air temperature Maximum air teperature Average solar radiation Soil temperature Mean air temperature Minimum air temperature Maximum air teperature Mean solar radiation
Dactylis glomerata -0.4 -0.41 -0.46 -0.45 -0.38 Dactylis glomerata -0.29 -0.34 -0.38 -0.28 0
Lolium perenne -0.02 -0.05 -0.08 0.04 0.29 Lolium perenne 0 -0.07 -0.02 -0.08 0.24
Festuca rubra -0.19 -0.25 -0.32 -0.18 0.18 Festuca rubra -0.16 -0.22 -0.31 -0.15 0.19
Bromus erectus -0.01 -0.05 0.01 0.03 0.31 Bromus erectus 0.18 0.25 0 0.23 0.38
Poa pratensis 0.12 0.09 0.35 0.12 0.46 Poa pratensis 0.02 0.03 0.4 0.1 0.31
Trifolium repens 0.36 0.37 -0.01 0.33 0.38 Trifolium repens 0.28 0.26 0.2 0.41 0.51*
Trifolium pratense 0.03 0 0.03 0.07 0.34 Trifolium pratense 0.22 0.26 0.02 0.29 0.47
Lotus corniculatus 0.72** 0.72** 0.46 0.70** 0.74** Lotus corniculatus 0.72** 0.69** 0.52 0.75*** 0.90***
Onobrychis viciifolia 0.13 0.09 0.3 0.17 0.54* Onobrychis viciifolia 0.06 0.03 0.28 0.1 0.42
Medicago sativa 0.01 -0.01 -0.04 0.02 0.24 Medicago sativa 0.04 0 0.02 0.08 0.33
Rosaceae Sanguisorba minor -0.06 -0.07 -0.05 -0.04 0.18 Rosaceae Sanguisorba minor -0.04 -0.05 -0.06 -0.02 0.18
Plantaginaceae Plantago lanceolata 0 -0.04 0 0.04 0.31 Plantaginaceae Plantago lanceolata 0 -0.04 0.02 0.05 0.33
Soil temperature Mean air temperature Minimum air temperature Maximum air teperature Mean solar radiation Poaceae Dactylis glomerata -0.52* -0.51* -0.51 -0.54* -0.48
Lolium perenne -0.25 -0.3 -0.43 -0.27 0.04
Festuca rubra -0.08 -0.14 -0.03 -0.1 0.33
Bromus erectus 0.01 -0.03 0.01 0.05 0.33
Poa pratensis 0.13 0.1 0.34 0.12 0.46
Fabaceae Trifolium repens 0.51* 0.57* 0.11 0.49 0.26
Trifolium pratense 0.17 0.14 0.36 0.17 0.51*
Lotus corniculatus 0.69** 0.69** 0.41 0.70** 0.77***
Onobrychis viciifolia 0.06 0.01 0.02 0.13 0.43
Medicago sativa 0.03 0.02 -0.03 0.05 0.27
Rosaceae Sanguisorba minor 0.17 0.14 0.19 0.22 0.46
Plantaginaceae Plantago lanceolata 0.01 -0.03 0.01 0.05 0.32 c - Correlation between climate factors and RLPNEW of new roots
Poaceae Poaceae
Fabaceae Fabaceae
4 Table S3: Pearson’s correlation coefficients (r) showing relationships between root variables and soil variables. Table S3a) shows the significant correlations 39
obtained with the means of the three replicates for every soil and root characteristic for a total of n=12. Table S3b) shows the significant Pearson’s correlations 40
obtained using all data where n = 34. Abbreviations: RERTOT – root elongation rate of the entire root system; REROLD – of roots older than 14 days; RERNEW – of
41
new roots aged 1 – 14 days; RLPTOT – root length production of the entire root system; RLPOLD – of old roots; RLPNEW – of new roots; Root biomass – total root
42
biomass of a core sampled at 37 weeks; absorptive root diameter– mean diameter of absorptive roots at 37 weeks; hemicellulose + water soluble compounds 43
– concentration of hemicellulose and water soluble compounds in absorptive roots; cellulose, lignin – concentrations of cellulose and lignin in absorptive 44
roots; C:N – ratio of carbon to nitrogen in absorptive roots; SIR – microbial substrate induced respiration. 45
46
In bold, significant r values: * p <0.05, **p < 0.01, *** p < 0 .001
47
ΔCSUM ΔCPOM ΔCfinePOM ΔCsilt ΔCsilt+clay SIR ΔCSUM ΔCPOM ΔCfinePOM ΔCsilt ΔCsilt+clay SIR
RERTOT -0.32 -0.2 -0.06 -0.1 -0.17 0.45 -0.32 -0.2 -0.06 -0.1 -0.17 0.45 REROLD -0.17 -0.25 -0.04 0.72** 0.37 0.74** -0.17 -0.25 -0.04 0.72** 0.37 0.74** RERNEW -0.24 -0.13 -0.2 -0.12 -0.55 0.18 -0.24 -0.13 -0.2 -0.12 -0.55 0.18 RLPTOT -0.34 -0.33 -0.18 0.37 0.34 0.51 -0.34 -0.33 -0.18 0.37 0.34 0.51 RLPNEW -0.3 -0.3 -0.15 0.33 0.17 0.43 -0.3 -0.3 -0.15 0.33 0.17 0.43 RLPOLD -0.32 -0.25 -0.22 0.66* 0.34 0.70* -0.32 -0.25 -0.22 0.66* 0.34 0.70* Root biomass -0.2 -0.46 -0.37 0.78** 0.3 0.80** 0.18 -0.08 0.02 0.3 -0.07 0.69*** Absorptive roots diameter -0.2 -0.72** -0.17 0.79** 0.14 0.56 0.08 -0.44* 0.21 0.14 0.36 0.50** Hemicelluloses +H2O soluble compounds -0.06 -0.61* -0.13 0.82** -0.3 0.68* 0.26 -0.3 0.25 0.22 0.23 0.60*** Cellulose -0.18 0.47 -0.14 -0.22 0.19 -0.53 -0.24 0.13 -0.16 -0.03 0.18 -0.31 Lignin 0.15 0.56 0.26 -0.84*** 0.49 -0.60* -0.19 0.18 -0.17 -0.21 -0.26 -0.46** Root C:N ratio 0.26 0.37 0.09 -0.68* 0.29 -0.86*** -0.06 0.28 -0.07 -0.3 -0.17 -0.79*** SIR -0.16 -0.19 -0.11 0.65* -0.57 0.27 -0.15 0.18 0.48** 0.12
a) Pearson's correlations at species level (n = 12, mean of three replicates) b) Pearson's correlations at individual level (n = 34)
Root growth dynamics Root morphological traits Root chemical traits
5
Fig. S1: Spatial disposition of growth boxes.
48
In left panel, replicates are depicted in different colours according to their family (green: N2-fixing
49
Fabaceae, brown: non N2-fixing Poaceae, yellow: non N2 fixing P. lanceolata, blue: non N2-fixing S.
50
minor). The different shades of colour representing different species are shown in the legend. The blue
51
dot on the upper right-hand corner of the different colored squares shows the boxes that were 52
equipped with air/soil temperature and soil moisture sensors. Soil cores were removed from each row 53
of ‘soil core replicates’ growth boxes. Half the boxes were fitted with rhizotrons (‘rhizotron replicates’). 54
Photographs of each species can be seen in the bottom right panel of the figure. 55
56 57
6
Fig. S2: Growth boxes used in the experiment.
58
Above a gravel layer, soil was homogeneously compacted into growth boxes. Seeds were sown at a 59
density of 155 plants m-2. Panes of plexiglass on the front of the box allowed root elongation to be
60
observed over the 37 week long experiment. 61
62
63 64
7 Fig. S3: Climatic conditions over the 37 weeks of experimentation.
65
a) Mean daily air temperature (solid black line), minimum air temperature (segmented blue line), maximum air temperature (segmented red line), mean daily 66
soil temperature (dotted black line) and mean daily air humidity (segmented black, dotted line). In b), mean daily solar irradiation (solid black line) and 67
evapotranspiration (segmented red line). 68
69
8
Fig. S4: Example of an image analyzed using SmartRoot software.
70
a) primary roots (in orange) from which lateral roots are initiated (in green). Each orange circle along 71
the root axis represents a single ‘mouse click’ for root selection. b) A bundle of roots growing close 72
together, where the number and diameter of roots cannot be recognized by the SmartRoot software.
73
74 75
Fig.S5: a) Example of two subsequent images of roots of Bromus erectus taken on 23/02/2019 and 76
10/03/2019 and b) conceptual scheme to explain root selection procedure.. 77
a) The figure on the left shows newly initiated roots that will be analyzed to calculate the RERNEW and
78
RLPNEW on 23/02/2019. At the next date for image analysis (10/03/2019), some of the previously
79
analyzed roots were the same length (RER=0, middle of the rhizotron), whereas other roots elongated 80
(RER>0, bottom of the rhizotron), and were used to calculate REROLD and RLPOLD. On the top part of the
81
rhizotron, some new roots were initiated, and analyzed to calculate the RERNEW and RLPNEW on
82
10/03/2019. b) Conceptual scheme showing the procedure to select ‘old roots’ at each sampling: at 83
Time x 30 new roots and 30 old roots have been analyzed. Of these 30 roots, 20 are primary axis roots 84
while 10 second order lateral (Fig. S4a). 10 roots from Time x primary old roots and 10 from Time x 85
primary new roots are randomly selected to be analyzed and constitute the Time x+1 old primary roots. 86
5 roots from Time x secondary old roots and 5 from Time x new secondary roots are selected and 87
analyzed and constitute the Time x+1 secondary old roots. 88
Primary roots Lateral roots
Root bundle
9 89 90 ‘Old roots’ elongation >0 23/02/2019 10/03/2019 ‘New roots’ elongation ‘New roots’ elongation ‘Old roots’ elongation = 0
a)
b)
10
Fig. S6: Carbon (C) content in each soil C pool beneath the 12 species and in the control bare soil, 37
91
weeks after sowing. 92
The C pools analyzed are CPOM in the coarse particulate organic matter >200µm), CfinePOM (C in the fine
93
particulate organic matter 200-50µm), CSILT (in the coarse silt fraction 50-20µm) and CSILT+CLAY (C in the
94
fine silt + clay fraction <20µm). The letters on the left hand side of the fraction bars indicate significant 95
differences (Tukey HSD, p < 0.05) between C pools and within species. 96
97 98
11
Fig. S7: Mean daily root elongation rate (RERTOT) for all the roots analyzed in the rhizotrons (without
99
distinguishing between old and new roots) in Fabaceae (N2-fixing, black circles) and Poaceae (non N2
-100
fixing, white squares) family. 101
Mean daily RERTOT in Fabaceae peaked in May - June, whereas in Poaceae, mean daily RERTOT was fairly
102
constant between February and June, with no marked peaks. Data are means ± standard error of the RER 103
data in the 2 weeks prior to the measurement of root elongation. 104 105 106 107 -2 -1 0 1 2 3 R E R ( m m d -1) Poaceae Fabaceae
12
Fig.S8: Mean root elongation rate of individual roots (RER, measured every 2 weeks) for each of the 12
108
species. 109
The solid black line is the RERNEW of the roots that were newly initiated (aged 1 to 14 days), and were not
110
present at the previous sampling date. The dotted black line represents the REROLD of the roots that were
111
already present at the previous sampling date, and so were older than 14 days. 112 113 0 1 2 3 4 5 Dactilis glomerata 0 1 2 3 4 5 Trifolium repens 0 1 2 3 4 5 Trifolium pratense 0 1 2 3 4 5 Lotus corniculatus 0 1 2 3 4 5 Festuca rubra 0 1 2 3 4 5 Bromus erectus 0 1 2 3 4 5 Onobrychis viciifolia 0 1 2 3 4 5 Poa pratensis 0 1 2 3 4 5 0 3 /1 1 /2 0 1 6 1 7 /1 1 /2 0 1 6 0 1 /1 2 /2 0 1 6 1 5 /1 2 /2 0 1 6 2 9 /1 2 /2 0 1 6 1 2 /0 1 /2 0 1 7 2 6 /0 1 /2 0 1 7 0 9 /0 2 /2 0 1 7 2 3 /0 2 /2 0 1 7 0 9 /0 3 /2 0 1 7 2 3 /0 3 /2 0 1 7 0 6 /0 4 /2 0 1 7 2 0 /0 4 /2 0 1 7 0 4 /0 5 /2 0 1 7 1 8 /0 5 /2 0 1 7 0 1 /0 6 /2 0 1 7 1 5 /0 6 /2 0 1 7 2 9 /0 6 /2 0 1 7 Medicago sativa 0 1 2 3 4 5 0 3 /1 1 /2 0 1 6 1 7 /1 1 /2 0 1 6 0 1 /1 2 /2 0 1 6 1 5 /1 2 /2 0 1 6 2 9 /1 2 /2 0 1 6 1 2 /0 1 /2 0 1 7 2 6 /0 1 /2 0 1 7 0 9 /0 2 /2 0 1 7 2 3 /0 2 /2 0 1 7 0 9 /0 3 /2 0 1 7 2 3 /0 3 /2 0 1 7 0 6 /0 4 /2 0 1 7 2 0 /0 4 /2 0 1 7 0 4 /0 5 /2 0 1 7 1 8 /0 5 /2 0 1 7 0 1 /0 6 /2 0 1 7 1 5 /0 6 /2 0 1 7 2 9 /0 6 /2 0 1 7 Lolium perenne 0 1 2 3 4 5 0 3 /1 1 /2 0 1 6 1 7 /1 1 /2 0 1 6 0 1 /1 2 /2 0 1 6 1 5 /1 2 /2 0 1 6 2 9 /1 2 /2 0 1 6 1 2 /0 1 /2 0 1 7 2 6 /0 1 /2 0 1 7 0 9 /0 2 /2 0 1 7 2 3 /0 2 /2 0 1 7 0 9 /0 3 /2 0 1 7 2 3 /0 3 /2 0 1 7 0 6 /0 4 /2 0 1 7 2 0 /0 4 /2 0 1 7 0 4 /0 5 /2 0 1 7 1 8 /0 5 /2 0 1 7 0 1 /0 6 /2 0 1 7 1 5 /0 6 /2 0 1 7 2 9 /0 6 /2 0 1 7 Sanguisorba minor 0 1 2 3 4 5 Plantago lanceolata Fabaceae Poaceae Others M e a n r o o t e lo n g a ti o n r a te o f a s in g le r o o t R E R ( m m d -1) M e a n r o o t e lo n g a ti o n r a te o f a s in g le r o o t R E R ( m m d -1)
13
Fig. S9: Linear regression at the individual level (n = 34 samples), between ΔCPOM (as thedifference in
114
carbon (C) in the coarse POM C pool, ΔC = Ct37 - Ct0, after 37 weeks), and a) diameter of absorptive roots
115
and b) hemicelluloses + water soluble compounds. 116
The black symbols are the N2-fixing Fabaceae species, the white symbols the non N2-fixing Poaceae
117
species, the red dots are S. minor and the green dots are P. lanceolata. The red line is the linear model 118
function of the variables and R2, F and p of the linear model are shown.
119
120 121
14
Fig. S10: Linear regression at individual level (n = 34 samples) between ΔCsilt (asthe difference in carbon
122
(C) in the coarse silt C pool, ΔC = Ct37 - Ct0, after 37 weeks), and a) root biomass, b) diameter of absorptive
123
roots, c) lignin content, d) hemicelluloses + water soluble compounds, e) C:N ratio and f) substrate induced 124
respiration rate (SIR). 125
The black symbols are the N2-fixing Fabaceae species, the white symbols the non N2-fixing Poaceae
126
species, the red dots are S. minor and the green dots are P. lanceolata. The red line is the linear model 127
function of the variables and R2, F and p of the linear model are shown. For the legend refer to figure S9.
128
15
Fig. S11: Linear regression at individual level (n = 34 samples) between substrate induced respiration rate
130
(SIR) and a) root biomass, b) lignin content, c) hemicelluloses + water soluble compounds, d) C:N ratio. 131
The black symbols are the N2-fixing Fabaceae species, the white symbols the non N2-fixing Poaceae
132
species, the red dots S. minor and the green dots P. lanceolata. The red line is the linear model function 133
of the variables and R2, F and p of the linear model are shown. For the legend refer to figure S9.
134