HAL Id: hal-01718181
https://hal.sorbonne-universite.fr/hal-01718181
Submitted on 27 Feb 2018HAL is a multi-disciplinary open access
archive for the deposit and dissemination of sci-entific research documents, whether they are pub-lished or not. The documents may come from teaching and research institutions in France or abroad, or from public or private research centers.
L’archive ouverte pluridisciplinaire HAL, est destinée au dépôt et à la diffusion de documents scientifiques de niveau recherche, publiés ou non, émanant des établissements d’enseignement et de recherche français ou étrangers, des laboratoires publics ou privés.
Distributed under a Creative Commons Attribution| 4.0 International License
of a black carbon-dominated tropical coastal ecosystem
(Halong Bay, Vietnam)
A.S. Pradeep Ram, Xavier Mari, J. Brune, J.P. Torréton, V.T. Chu, Patrick
Raimbault, J. Niggemann, T. Sime-Ngando
To cite this version:
A.S. Pradeep Ram, Xavier Mari, J. Brune, J.P. Torréton, V.T. Chu, et al.. Bacterial-viral interactions in the sea surface microlayer of a black carbon-dominated tropical coastal ecosystem (Halong Bay, Vietnam). Elementa: Science of the Anthropocene, University of California Press, 2018, 6 (1), pp.13. �10.1525/elementa.276�. �hal-01718181�
RESEARCH ARTICLE
Bacterial-viral interactions in the sea surface microlayer
of a black carbon-dominated tropical coastal ecosystem
(Halong Bay, Vietnam)
Pradeep Ram A.S.
*, Mari X.
†,‡, Brune J.
§, Torréton J.P.
§, Chu V.T.
‖, Raimbault P.
†,
Niggemann J.
¶and Sime-Ngando T.
*Increasing human activity has raised concerns about the impact of deposition of anthropogenic combustion aerosols (i.e., black carbon; BC) on marine processes. The sea surface microlayer (SML) is a key gate for the introduction of atmospheric BC into the ocean; however, relatively little is known of the effects of BC on bacteria-virus interactions, which can strongly influence microbially mediated processes. To study the impact of BC on bacteria-virus interactions, field investigations involving collection from the SML and underlying water were carried out in Halong Bay (Vietnam). Most inorganic nutrient concentrations, as well as dissolved organic carbon, were modestly but significantly higher (p = 0.02–0.05) in the SML than in underlying water. The concentrations of particulate organic carbon (though not chlorophyll a) and of total particulate carbon, which was composed largely of particulate BC (mean = 1.7 ± 6.4 mmol L–1), were highly enriched in the SML, and showed high variability among stations. On average, microbial abundances (both bacteria and viruses) and bacterial production were 2- and 5fold higher, respectively, in the SML than in underlying water. Significantly lower bacterial production (p < 0.01) was observed in the particulate fraction (>3 µm) compared to the bulk sample, but our data overall suggest that bacterial production in the SML was stimulated by particulate BC. Higher bacterial production in the SML than in underlying water supported high viral lytic infection rates (from 5.3 to 30.1%) which predominated over percent lysogeny (from undetected to 1.4%). The sorption of dissolved organic carbon by black carbon, accompanied by the high lytic infection rate in the black carbon-enriched SML, may modify microbially mediated processes and shift the net ecosystem metabolism (ratio of production and respiration) to net heterotrophy and CO2 production in this critical layer between ocean and atmosphere.
Keywords: black carbon; virus-bacteria interaction; viral lysis; lysogeny; sea surface microlayer; tropical
coastal ocean
* Laboratoire Microorganismes, Génome et Environnement, UMR CNRS 6023, Université Clermont Auvergne, 63178 Aubière Cedex, FR
† Aix Marseille Université, Université de Toulon, CNRS, IRD, Mediterranean Institute of Oceanography (MIO), 13288, Marseille, FR
‡ Sorbonne Universités, UPMC, Université Paris 06, CNRS, Laboratoire d’Océanographie de Villefranche (LOV), 181 Chemin du Lazaret, 06230 Villefranche-sur-Mer, FR § UMR MARBEC, IRD, CNRS, IFREMER, Université Montpellier,
FR
‖ Institute of Marine Environment and Resources (IMER), Vietnam Academy of Science and Technology (VAST), Haiphong, VN
¶ Research Group for Marine Geochemistry (ICBM-MPI Bridging Group), University of Oldenburg, Institute for Chemistry and Biology of the Marine Environment, 26129 Oldenburg, DE
Correspondence author: Pradeep Ram A.S. (pradeep_ram.angia_sriram@uca.fr)
1. Introduction
The coastal ocean – where land, ocean and atmosphere interact – constitutes one of the most geochemically and biologically active areas of the biosphere (Gattuso et al., 1998), and one that is also subjected to increasing anthropogenic pressure. In today’s context, one such pressure, which will likely escalate in the near future as a consequence of continuously intense industrial activity, is the input of black carbon (BC) particles via atmospheric deposition or riverine runoff from land drainage (Guazzotti et al., 2001; Forbes et al., 2006). The term “black carbon” is used for aerosols that result from soot emission generated by incomplete combustion of biomass and fossil fuels. These BC particles are chemically heterogeneous, aromatic and carbon-rich compounds that can range from easily degradable to recalcitrant (Hedges et al., 2000; Masiello, 2004). Depending on their origin, BC particles differ strongly in size (20 to 1200 nm;
Hadley et al., 2007). These BC particles are introduced into the coastal ocean through dry and wet deposition and, in the course of time, a fraction of them can enter into the pool of dissolved organic matter (DOM; Kim et al., 2004).
Owing to their high specific area-to-mass ratio and high surface-active properties (Koelmans et al., 2006), and by virtue of their own composition which may contain substances that could inhibit microbial activities (Grahame et al., 2014), BC particles can strongly affect the functioning and structure of aquatic microbial food web (Cattaneo et al., 2010; Weinbauer et al., 2012; Mari et al., 2014). It has been established that processes mediated by heterotrophic bacteria and archaea (or prokaryotes, hereinafter referred to as “bacteria”) are crucial for biogeochemical cycles and the functioning of aquatic ecosystems (Azam and Malfatti, 2007), with most metabolic pathways performed exclusively by these microorganisms. Therefore, understanding the dynamics of bacterial processes is of pivotal importance to assess their significance in the functioning and productivity of aquatic systems. Anthropogenic perturbations (i.e., pollution, eutrophication, etc.) affecting bacterioplankton dynamics can translate to major effects on other constituents of the planktonic food web, and thus on the structure of the entire ecosystem. The fact that viruses (primarily bacteriophages) regulate bacterial growth and metabolism by their destructive action of 20–50% of daily bacterial production (Suttle, 2005; Sime-Ngando, 2014) makes viruses an additional important influence on biogeochemical processes and energy fluxes, structuring food web dynamics and governing microbial diversity in aquatic systems (Breitbart, 2012; Sime-Ngando, 2014; Fuhrman et al., 2015). Although the effect of BC on climate has been widely studied (e.g., Ramanathan and Carmichael, 2008), our understanding of the direct and indirect effects of BC on bacteria-virus interactions and the processes they mediate in aquatic ecosystems is still in its infancy.
BC enters the marine system via the air-water interface, which is operationally defined as the sea surface microlayer (SML). The SML plays a critical role in the exchange of materials, gases and heat between the hydrosphere and atmosphere (Cunliffe et al., 2013). The distinct physico-chemical properties of the SML compared to the underlying water column make it a unique ecosystem which can harbor distinct microbial communities (Cunliffe et al., 2011). The SML is also known to accumulate various pollutants, including atmospheric polyaromatic hydrocarbons (PAHs; Wurl and Obbard, 2004). Lim and colleagues (2007) showed the high impact of wet deposition on the accumulation of PAHs in the SML, with an increase by a factor of up to 300 during rainfall. Because PAHs are intrinsic to the composition of BC (Akhter et al., 1984, 1985; Sergides et al., 1987), the accumulation of PAHs in the SML may indicate BC enrichment.
The potential accumulation of BC in the SML may be a driving force for the establishment of unique microbial communities and interactions at the air-water interface,
and further promote aggregation/adsorption processes influencing the fate of BC in the ocean. Previous reports have shown that bacteria and viruses were efficiently adsorbed onto BC particles (Mari et al., 2014; Malits et al., 2015). Such phenomenon can be expected to impact bacterial production (BP) and viral lysis, and hence biogeochemical cycles. To date, limited information exists on bacteria-virus interactions in BC-dominated marine systems, especially in the SML realm.
One of the key explanations for the omnipresence of viruses in aquatic ecosystems is the existence of several life strategies, of which two major pathways, lytic and lysogenic, are prevalent (Pradeep Ram and Sime-Ngando, 2010). In BC-impacted systems, adsorption of bacteria and viruses onto BC particles could reduce specific encounter rates between host and virus, which are required for successful infection of the hosts. Therefore, non-availability of a suitable host can be a crucial constraint for viral proliferation, which can lead to alteration of viral life strategies (Sime-Ngando and Colombet, 2009). On the other hand, adsorption of DOM on the surface of BC particles can create hot spots of microbial activity, and photochemical degradation of BC, or UV exposure of BC in the atmosphere before deposition, can make BC more bioavailable for microbial utilization (Lopez-Urrutia and Moran, 2007; Stubbins et al., 2012) or possibly release BC-associated inhibitors of microbial activity. Studies on the impact of BC on marine microbes in general are scarce, but the impact of BC on the life strategies of phages in the environment has not been reported.
In order to determine whether BC functions as a strong forcing factor of bacterial-viral interactions, field investigations involving the collection of samples from the SML and underlying water (ULW) were carried out in Halong Bay, Vietnam, a tropical coastal ecosystem located in one of the hot spots of atmospheric BC concentration (Ramanathan et al., 2007; Ramanathan and Carmichael, 2008). Our objectives were (1) to determine the spatial variability of viral and bacterial abundance, together with viral infection of bacterioplankton at selected stations with varying BC concentration, and (2) to evaluate factors that may regulate viral abundance and viral life strategies, including the impact of BC on phage life styles. In addition, we characterized the variation of the viral infection frequency and the burst size for different bacterial morphopopulations in the SML.
2. Methods
2.1. Study site
Halong Bay is located in northeast Vietnam, approximately 170 km East of Hanoi. The Bay is 5 to 10 m deep, covers an area of approximately 1500 km2, and includes some 2000 islands and islets. These numerous islands and islets protect the sea surface from wind, which favors the formation of the SML (Huynh, 2002).
Halong Bay is impacted by rivers and streams from the mainland, which results in variable salinity regimes during the year. The input of BC to Halong Bay arises from every
known source, including coal and biomass burning for domestic use, coal and oil combustion from industries and harbor activities. Along with tourism, Halong Bay may also be impacted by the intense industrial, shipping and mining activities occurring in its vicinity. For example, the Bay is located a few tens of kilometers from the largest industrial zone and trading harbor in Vietnam (i.e., Haiphong) and is bordered in the North by open coal mining. In addition to these local sources, northern Vietnam is impacted by atmospheric BC originating from China during the dry season (B Guinot, personal communication; Mari et al., 2017). Altogether, these intense human activities result in high deposition of BC onto the surface waters of Halong Bay.
2.2. Sampling
This study was conducted at the beginning of the dry season (15–21 October 2012) at 16 selected stations (HL1 to HL16) in Halong Bay using a 15-m coastal vessel. At each station, seawater samples were collected at 1.5-m depth (hereafter called underlying water; ULW) using a 5-L Niskin bottle and transferred to 2-L polycarbonate bottles. Simultaneously, samples of the SML were collected from the bow of the boat using a glass plate sampler by vertically dipping, slowly withdrawing, and inserting the plate (sampling area of 2000 cm2) into a slot with Teflon wipers on each side. The SML covering the plate due to surface tension was then collected into 0.5-L polycarbonate bottles, placed underneath the wiper blades, as the blades wiped off the SML. Because each dipping of the sampler allows collecting only about 8 mL of SML, the glass plate was dipped repeatedly through the SML in order to collect enough volume from the SML for conducting the different analyses. Although other SML samplers can be used, such as the metal screen sampler (Garrett, 1967), the glass plate sampler has been shown to be the better choice for studies of inorganic and organic nutrients (Momzikoff et al., 2004) and bacteria (Reinthaler et al., 2008) in freshwater and marine systems, and continues in be in common use (e.g., van Pinxteren et al., 2017, and citations therein).
Prior to collection, polycarbonate bottles were acid-cleaned (HCl, 10%), washed thrice with Milli-Q and rinsed with sample water. All sampling gear was also acid-washed, rinsed intensively with Milli-Q water and followed by seawater in order to avoid contamination with alien material during handling procedures. Onboard, the samples were split for the different parameters and either preserved for later analyses or analyzed immediately, as described below. Along the vertical water column, salinity and temperature was recorded using a CTD probe (SBE19+, Sea-Bird Electronics, Inc., Bellevue, WA, USA).
2.3. Chlorophyll a concentration
Chlorophyll a (Chl a) was determined fluorometrically on methanol-extracted samples from 100-mL subsamples filtered onto 25-mm Whatman GF/F filters using the method of Holm-Hansen et al. (1965). Immediately after
filtration onboard, filters were placed in 2-mL plastic tubes and stored in liquid nitrogen until analyses in the laboratory.
2.4. Analytical techniques
2.4.1. Inorganic nutrients, dissolved organic nitrogen and phosphorus determination
Analyses of nitrate (NO3–), nitrite (NO
2–), ammonium (NH4+), phosphate (PO
43–), dissolved organic nitrogen (DON) and dissolved organic phosphorus (DOP) were performed on duplicate 30-mL sub-samples filtered through 47-mm pre-combusted (450°C overnight) Whatman GF/F filters and collected in acid-washed 30-mL Nalgene flasks (soaked in 10% HCl). Samples were filtered onboard and the flasks were stored at <4°C prior to pasteurization (80 ± 3°C for 6 h; Daniel et al., 2012) in the laboratory. After pasteurization, the flasks were stored in the dark until analysis.
Nutrient concentrations were measured with an AutoAnalyser III Seal Bran Luebbe (Mequon, USA) according to Aminot and Kerouel (2007). To have reproducible nutrient measurements, standards were used and compared to commercial products (OSIL). The detection limits of NO3–, NO
2– and PO43– were 0.05, 0.05 and 0.02 µmol L–1, respectively.
Determination of total nitrogen (TN) and total phosphorus (TP) was carried out simultaneously on the same sample using the wet-oxidation procedure described in Raimbault et al. (1999), where persulfate is used to digest the organic matter and where the inorganic end-products were determined by colorimetry.
The concentrations of DON and DOP were calculated as TN and TP minus dissolved inorganic nitrogen (DIN; nitrate + nitrite + ammonium) or phosphate measured in the same samples. The analytical accuracy, determined on replicates of reference samples, was close to 0.5 and 0.05 µmol L–1 for DON and DOP, respectively.
2.4.2. Dissolved organic carbon
Analyses of DOC were performed on 20-mL subsamples immediately filtered through 47-mm pre-combusted Whatman GF/F filters and collected in pre-combusted (450°C, overnight) 24-mL glass tubes, preserved with 24 µL of 85% phosphoric acid (H3PO4). Samples were stored in the dark until analysis. DOC concentration was measured on a Shimadzu TOC VCPH analyzer with potassium phthalate calibration standards over the measurement range 0–400 µmol C L–1. Certified reference materials (Hansell Laboratory, University of Miami, Florida) were used as external standards to determine the machine blank. Both the low carbon water (LCW, ~1 µmol C L–1) and the deep seawater (DSW, ~45.5 µmol C L–1) standards were used at the beginning of each sample run (i.e., every 10 samples). Milli-Q blanks were regularly injected as “sample blanks” during the analysis sequence to ensure that no sample carryover was observed. The machine blank, calculated for each run of 10 samples, as ([LCWmeasured – 1] + [DSWmeasured – 45.5])/2, averaged –8.3 ± 2.6 µmol C L–1. The reported DOC values were
blank-corrected by subtracting the machine blank obtained at the beginning of each sample run.
2.4.3. Particulate carbon and nitrogen
Total particulate carbon (TPC) and nitrogen and particulate black carbon (PBC) were measured from duplicate 100-mL subsamples immediately filtered onboard onto pre-combusted (450°C overnight) 25-mm Whatman GF/F filters. After filtration, the filters were individually placed in 2-mL plastic tubes and were immediately frozen in liquid nitrogen. At the laboratory, filters were dried at 60°C for 24 h and stored in sealed plastic bags until analyses. Prior to the determination of TPC and PBC, all of the filters were acidified with 100 µL of 0.5 N H2SO4 in order to remove inorganic carbon. Acidified samples were kept in a drying oven (60°C) until analyses.
One subsample was used to measure TPC (and nitrogen), the other was used to measure PBC, and POC concentration was calculated as the difference. For PBC analyses, POC was removed by a chemothermal oxidation pre-treatment of the filters at 340 ± 0.5°C for 2 h and under an oxidative gas (oxygen) flow to prevent charring during the treatment (Cachier et al., 1989; Kuhlbusch, 1995). This pre-treatment leaves only PBC on the filters.
Particulate carbon (both TPC and PBC) and particulate nitrogen were determined by high temperature combustion (900°C) performed on a CN Integra mass spectrometer (Raimbault et al., 2008).
2.4.4. Dissolved black carbon
Samples for dissolved BC (DBC) analyses were collected and prepared according to the solid-phase extraction method (Dittmar et al., 2008). This method allows concentrating DOM molecules (including DBC) in salt-free methanol extracts. Briefly, for each sampling occasion, 500 mL of SML and 500 mL of ULW were filtered through pre-combusted (450°C overnight) 47-mm diameter GF/F filters, directly into acid-washed polycarbonate bottles and immediately acidified with hydrochloric acid 37% to reach a pH of 2. The bottles were stored at <4°C until the solid-phase extraction procedure in the laboratory. Cartridges filled with Varian Bond Elut sorbent were used to concentrate DOM. This sorbent consists of a styrene divinyl copolymer and is made for the retention of highly polar to non-polar substances from large volumes of water. The cartridges were rinsed with methanol (HPLC grade) immediately before use. The filtered and acidified samples were gravity-processed through the cartridges at a flow rate of <15 mL min–1. Immediately after adsorption, remaining salts were washed off the cartridges with 40 mL pH 2 ultrapure water (LC/MS Reagent, JT Baker® 9831-03). The cartridges were dried under a N2 stream before elution of the solid-phase extractable DOM with 8 mL of methanol. The eluates were stored in acid rinsed 8-mL vials at –18°C until analysis.
DBC was analyzed as benzenepolycarboxylic acids (BPCAs) after nitric acid oxidation following the method of Dittmar (2008). Aliquots of 1 mL extract, corresponding to ~2–8 µmol of solid phase extractable DOC, were transferred to combusted (450°C, 4 h) glass ampoules
and dried overnight at 50°C. Dry extracts were dissolved in 500 µL of nitric acid (65%), ampoules were sealed and placed in a pressure bomb to be heated for 9 h at 170°C. After cooling, 450 µL of the solution were transferred to sample vials and evaporated to dryness in a vacuum centrifuge (Christ RV2-18). Samples were dissolved in 100 µl of phosphate buffer (pH 7.2) and analyzed on an ultrahigh performance liquid chromatography system (UPLC, Waters Acquity) equipped with a photodiode array absorbance detector. BPCAs were identified based on retention time and absorbance spectra (220–380 nm) and quantified using four-point calibration curves and the respective absorbance signal at 240 nm. DBC concentrations were calculated from BPCA concentrations as outlined in Dittmar (2008), with the slight modification detailed in Stubbins et al. (2015).
2.5. Bacterial and viral abundances
Samples (1 mL each) for counting abundances of bacteria (BA) and viruses (VA) were fixed with paraformaldehyde (1% final concentration) and kept in the dark at 4°C for 30 min before flash-freezing in liquid nitrogen. Abundances were determined using a FACS Calibur flow cytometer (Becton Dickinson, Franklin Lake, NJ, USA) equipped with an air-cooled laser providing 15 mW at 488 nm with the standard filter set-up as described by Brussaard et al. (2010). Briefly, samples were diluted with 0.2-µm pre-filtered TE buffer (10 mM Tris-HCL and 1 mM EDTA, pH 8) and stained with SYBR Green I (10,000fold dilution of commercial stock, Molecular Probes, Oregon, USA). The mixture was incubated for 5 min, heated for 10 min at 80°C in the dark and cooled for 5 min prior to analysis. Bacteria and viruses differing in fluorescence intensity were detected by their signature in a side scatter versus green fluorescence (530 nm wavelength, fluorescence channel 1 of the instrument) plot. Flow cytometry list modes were analysed using CellQuest Pro software (BD Biosciences, version 4.0). A blank was routinely examined to control for contamination of the equipment and reagents.
2.6. Bulk bacterial production using isotope dilution
Bulk BP measurements were performed onboard immediately after sampling. For each sample, six 1.5-mL subsamples were distributed into 2-mL centrifuge microtubes containing the same concentration of radioactive leucine (L-[3, 4, 5-3H]-Leucine, Perkin-Elmer NET460 A, 11.58 mCi mol–1, 100 nmol L–1 final concentration) and six different concentrations of unlabeled leucine (0, 53, 99, 151, 203 and 260 nmol L–1) according to a procedure inspired by Pollard and Moriarty (1984).
The six subsamples were incubated in the dark at in situ temperature (±1°C) for 1 h. Leucine incorporation was then stopped by adding 167 µL of 50% (w/v) TCA and the tubes were kept at 4°C until arrival at the laboratory within 8 h. The microtubes were then centrifuged for 10 min at 14,000 rpm. The pellets were rinsed with 1.6 mL of 5% TCA and centrifuged again. This procedure was repeated four times before the addition of 1.5 mL of
scintillation cocktail (Perkin Elmer Ultima Gold MV) and liquid scintillation counting.
Zero-time blanks were performed using the same procedure, except that TCA was added before the water sample. Radioactivity was determined after 24 h to avoid chemiluminescence using a Beckman Coulter LS 6500 Multi-Purpose scintillation counter. Quench correction was made using external standards.
The radioactivity in the zero-time blanks was subtracted from the samples before the subsequent calculations. The apparent isotopic dilution was determined according to Pollard and Moriarty (1984) by plotting total leucine added versus 1/BP, where apparent isotope dilution is the opposite of b, the Y-intercept of the regression of (total leucine added) = a/BP + b. Resulting rates are reported in units of nM leucine h–1 as a proxy for BP.
2.7. Fraction of BP associated with particles
In parallel with bulk BP measurements using isotope dilution, three 4-mL subsamples of water were distributed in three disposable Falcon tubes of 5 mL. Two of them received radioactive leucine (L-[3, 4, 5-3H]-Leucine, Perkin-Elmer NET460 A, 11.58 mCi mmol–1, 100 nmol L–1 final concentration). The third one (zero-time blank) received 0.2 µm-filtered formaldehyde at 37% (2% final concentration) before addition of the tracer.
The tubes were incubated in the dark at in situ temperature (±1°C) for 1 h. Incorporation was stopped by adding 37% 0.2 µm-filtered formalin (2% final concentration) and the tubes were kept at 4°C until processing at the laboratory.
Labeled material was collected by filtration under low pressure (<50 mm Hg) through a 3-µm polycarbonate membrane and rinsed with 5 mL of 0.2 µm-filtered seawater. Vacuum was stopped. The membranes then received 15 mL of 5% ice-cold TCA and the macromolecules were allowed to precipitate 15 min at 4°C. The samples were then filtered under low vacuum (<50 mm Hg), and rinsed three times with 5 mL of ice-cold 5% TCA. The membranes were then placed in centrifuge microtubes, and 1.5 mL of Ultima Gold MV scintillation cocktail was added before liquid scintillation counting.
Radioactivity was determined after 24 h to avoid chemiluminescence using a Beckman Coulter LS 6500 Multi-Purpose scintillation counter. Quench correction was made using external standards.
Percent particle-associated BP was computed as the ratio of BP > 3 µm to bulk BP determined using isotope dilution with no unlabeled leucine added.
2.8. Viral lytic infection and virally infected bacterial cell morphotypes
Bacterial cells contained in formaldehyde-fixed water samples (final conc. 2% v/v) from all SML and ULW samples were individually collected on triplicate electron microscope grids (400-mesh, carbon-coated Formvar film) by ultracentrifugation (Optima LE-80K, Beckman Coulter SW40 Ti Swing-Out-Rotor at 70,000 × g for 20 min at 4°C) according to Pradeep Ram and Sime-Ngando (2010). Each grid was stained at room temperature (ca. 20°C) for
30s with uranyl acetate (2%, pH = 4), rinsed twice with 0.02 µm-filtered distilled water to remove excess stain, and dried on filter paper. The samples were examined using a JEOL 1200Ex transmission electron microscope (TEM) operated at 80 kV and a magnification of 20,000 to 60,000x to distinguish between bacterial cells with and without intracellular viruses. A bacterial cell was considered infected when at least five viruses, identified by shape and size, were clearly visible inside the cell. At least 400–600 bacterial cells were inspected per grid to determine frequency of visibly infected bacterial cells (FVIC). Counts of FVIC were converted to the frequency of infected cells (FIC) using the following formula: FIC = 9.524 FVIC – 3.256 (Weinbauer et al., 2002).
Virally infected bacterial cell morphotypes from the SML were subjectively recorded as elongated thin rod, short rod, fat rod, filamentous and cocci (i.e., bacterial morphopopulations) based on observations during TEM examination. The above classification, however, can result in some overlaps among groups. To minimize this overlap, cocci were defined as having a length:width ratio between 1 and 2, fat rods were defined as having a length:width ratio between 2 and 5 or having a width greater than 200 nm, and thin rods were defined as having a length:width ratio greater than 5 and a width less than 200 nm (Brum et al., 2005). The maximum burst size (BSmax) was estimated from the number of viruses in those visibly infected cells that were totally filled with phages.
2.9. Induction assays for lysogenic bacteria
The frequency of lysogenic cells was obtained after 24 h incubation of water samples (20 mL) with and without (controls) the inducing agent mitomycin C (1 µg mL–1 final concentration, Sigma, MO, USA) in the dark at in situ temperature (Paul and Jiang, 2001). Incubations were carried out in triplicate and subsamples were collected and fixed at zero time (t0) and 24 h with glutaraldehyde (0.5% final concentration) for enumeration of BA and VA by flow cytometry using SYBR Green I stain (as described above). Induction of lysogenic bacteria was determined from increases in VA and decreases in BA in the presence of mitomycin C relative to controls. FLC within bacterial communities was calculated as:
(
MC C) (
max t0)
FLC = ⎡⎢⎣ VA − VA / BS ×BA ⎤⎥⎦×100
where VAMC and VAC are the viral abundances in mitomycin C treatments and control assays after incubations, respectively, and BSmax is the maximum burst size estimated at the start of the experiment.
2.10. Statistical analysis
Differences in physicochemical and biological variables between SML and ULW were tested by one-way analysis of variance (ANOVA). Potential relationships among variables (abiotic and biotic) were tested by linear pair-wise correlations (i.e., Pearson correlation analysis) and stepwise multiple regressions. Data were log-transformed to satisfy the requirements of normality and homogeneity
of variance necessary for parametric statistics. All statistical analyses were performed with Minitab software for Windows (Release 17, Minitab, State College, PA, USA).
3. Results
3.1. Environmental characteristics of sampling sites
During the sampling period, the water temperature at the study stations, in both the SML and ULW, ranged between 27.3 to 29.1°C, with no significant difference in mean value between them (Table 1). Salinity showed wide
fluctuations (from 0 to 28.9) with no significant difference between the SML and ULW, though significantly (p < 0.05) lower values in the SML than ULW were detected at certain stations (HL2, HL9, HL11, HL14 and HL15). Water temperature and salinity were significantly correlated for both the SML and ULW (p < 0.001). Among the inorganic nutrients, concentrations of ammonia, phosphate and silicate were significantly enriched in the SML compared to ULW (p < 0.05) and all were inversely related to salinity. PBC represented a dominant fraction (32–97%) of TPC and, despite varying widely (coefficient of variation: 379%), was significantly higher in the SML (from 16.5 to 25610 µmol L–1) compared to ULW (from 4.8 to 62.4 µmol L–1; p < 0.001; Table 1). Both TPC and PBC were
highly enriched in the SML compared to ULW, with a mean enrichment factor of 52 and 105, respectively. Like TPC and PBC, POC was also significantly enriched in the SML (ranging from 5.4 to 830.8 µmol L–1) over ULW (from 9.1 to 41.7 µmol L–1; p < 0.05) by a factor of 6.1, whereas DOC showed a weaker enrichment factor of 1.2 between SML and ULW. Dissolved BC represented 1.2 to 2.8% of the DOC with no significant difference between the SML and ULW (Table 1). Chl a concentration varied between 1.0
and 30.2 µg L–1, with the highest value observed in the SML at station HL2 (near the coast) which was characterized by low salinity due to freshwater inputs from rivers. Like nutrients, the concentration of Chl a was also negatively related to salinity (p < 0.01; Table 2).
3.2. Bacterial and viral abundance
The mean microbial characteristics of the study stations are summarized in Table 1. Abundances of
viruses (VA) and bacteria (BA) were significantly higher (p < 0.001) and more variable in the SML than in ULW (coefficient of variation = 57% and 25%, respectively) (Figures 1 and 2). Overall VA and BA in the SML ranged from
4.1 to 18.4 × 10⁶ mL–1 (mean ± SD = 7.3 ± 3.7 × 10⁶ mL–1) and 0.5 to 2.9 × 10⁶ cells mL–1 (mean = 1.3 ± 0.8 × 10⁶ cells mL–1),
Table 1: Environmental and microbiological characteristics of the sea surface microlayer (SML) and underlying water
(ULW) in Halong Bay, Vietnam. DOI: https://doi.org/10.1525/elementa.276.t1
Parameters (units) Mean (range)a p
valueb SML ULW Water temperature (°C) Salinity NH4-N (µmol L–1) NO3 + NO2-N (µmol L–1) PO4-P (µmol L–1) SiO2 (µmol L–1)
Dissolved organic carbon (µmol L–1)
Particulate organic carbon (µmol L–1)
Total particulate carbon (µmol L–1)
Dissolved black carbon (µmol L–1)
Particulate black carbon (µmol L–1)
Chlorophyll a (µg L–1)
Bacterial abundance (106 cells mL–1)
Viral abundance (106 mL–1)
Virus to bacteria ratio
Leucine incorporationc (nM Leu h–1)
Frequency of infected bacteria (%) Frequency of lysogenic bacteria (%)
Maximum burst size (virus bacterium–1)
28.5 (27.3–29.1) 19.9 (0–28.9) 3.3 (1.5–7.8) 0.7 (0.3–2.3) 0.13 (0.03–0.28) 16.2 (6.7–64.8) 134.9 (98.7–278.8) 113.4 (5.4–830.8) 1798 (41.1–26440) 2.3 (0.7–5.7) 1684 (16.5–25610) 4.0 (1.0–30.2) 1.3 (0.5–2.9) 7.3 (4.1–18.4) 6.4 (3.7–11.4) 3.3 (0.4–13.8) 14.2 (5.3–30.1) 0.5 (ud–1.4) 55 (20–176) 28.9 (28.0–29.3) 24.8 (0–29.7) 2.2 (0.7–5.1) 0.9 (0.1–5.7) 0.08 (0.02–0.21) 7.7 (2.9–16.6) 109.5 (88.9–171.4) 18.5 (9.1–41.7) 34.5 (15.9–104.0) 2.0 (1.4–3.5) 16.0 (4.8–62.4) 2.3 (1.4–3.2) 0.6 (0.5–1.0) 3.1 (2.0–4.9) 5.0 (3.5–7.6) 0.7 (0.3–1.5) 9.5 (4.4–20.1) 0.8 (ud–2.1) 48 (21–105) ns ns 0.03 ns 0.02 0.05 0.04 0.05 0.001 ns 0.001 ns 0.002 0.001 0.02 0.01 0.01 ns ns
a For data from all 16 stations (n = 16 for each sample type); ud = undetected.
b Significance level of difference between SML and ULW; ns = not significant.
respectively, with their average values exceeding those of ULW by approximately twofold (Table 1). The maximum
values of VA and BA, which were observed under low salinity conditions at study site HL2, coincided with high concentrations of phosphate, DBC and Chl a. These maxima of VA and BA were 4.5- and 5-fold higher than the lowest values obtained for both variables in the SML, respectively. These results were reflected in the virus-to-bacteria ratio (VBR) which ranged from 3.5 to 11.4 with significantly higher (p < 0.02) ratios in the SML than in ULW (Table 1).
Both VA and BA correlated (p < 0.001) with Chl a but only in the SML. The distributions of VA and BA were more or less similar, resulting in a strong correlation (r2 = 0.85, p < 0.001) between the two variables, hence suggesting that bacteria were the dominant hosts for viruses (Figure 3).
3.3. Bacterial production
Bulk leucine incorporation into TCA-precipitable material was used as a proxy for total BP. Since previous experiments had shown that isotope dilution could be significant and variable in the SML, bulk leucine incorporation was systematically assayed using isotope dilution. Results
showed that isotope dilution was not significant in ULW, while it was significantly different from zero in six of the 14 SML samples investigated (p < 0.001; Student’s t-test). For station 2, which displayed the highest value for BP, the apparent isotope dilution (±SE) of 407 ± 40 nM showed that BP would have been underestimated up to 5fold if it were not taken into account.
Corrected for isotope dilution, leucine incorporation rates were significantly higher (p < 0.001) in the SML than in ULW and varied by more than two orders of magnitude among the stations (Table 1). BP ranged from
0.4 to 13.8 nM h–1 (mean ± SD = 3.3 ± 3.8 nM h–1) and from 0.3 to 1.5 nM h–1 (mean = 0.7 ± 0.3 nM h–1) in the SML and ULW, respectively (Figure 4). On average, the BP in
the SML was 5fold higher than in ULW. In the SML realm, leucine incorporation rate in the >3 µm size fraction of water samples was significantly lower (p < 0.001) than in the bulk sample, and on average accounted for 23.0% of the total incorporation rate (Figure 4). The
highest BP was observed at station HL2, coinciding with high microbial abundance and high concentrations of inorganic phosphorous, POC and Chl a in the SML. BP was
Table 2: Pearson’s product-moment correlation coefficient (r) between different parameters in the SMLa and in the ULWa in Halong Bay (n = 16). DOI: https://doi.org/10.1525/elementa.276.t2
Parameterb TEMP SAL DIN PO
4 DOC DBC TPC PBC CHL VA BA BP SAL 0.80 0.85****** DIN NS –0.80*** NS –0.95*** PO4 NS NS –0.50NS* 0.58NS* DOC NS NS NS NS NS NS NS NS DBC –0.69 –0.58*** –0.72–0.73****** 0.570.77**** 0.63NS** NSNS TPC NS NS –0.58NS* NSNS 0.67NS** NSNS 0.79NS*** PBC –0.49 NS * –0.54 NS * NS NS 0.61 NS ** NS NS 0.78 NS *** 0.98 NS *** CHL NS NS –0.57NS* NSNS 0.56NS* NSNS 0.77NS*** 0.960.59***** 0.97NS*** VA –0.47 NS* –0.52 NS* NS NS 0.58 NS* NS 0.61** 0.63 NS** 0.88 NS*** 0.80 NS*** 0.81 NS*** BA NS NS NSNS NSNS NSNS 0.75***NS NSNS 0.55NS* NSNS 0.51NS* 0.850.70***** BP NS NS NSNS NSNS 0.47NS* NSNS 0.58NS* 0.77NS*** 0.79NS*** 0.76NS*** 0.90NS*** 0.77NS*** FIC –0.51 NS * –0.49 NS * NS NS NS NS NS 0.84*** 0.73 NS *** 0.68 NS ** 0.72 NS *** 0.69 NS ** 0.51 0.48* * NS 0.73*** 0.59 NS **
a Coefficients for the sea surface microlayer (SML) and underlying water (ULW) are indicated in boldface and italics, respectively;
levels of significance: *p < 0.05, **p < 0.01, ***p < 0.001; NS: not significant.
b TEMP: water temperature, SAL: salinity, DIN: dissolved inorganic nitrogen, PO
4: inorganic phosphate, DOC: dissolved organic
carbon, DBC: dissolved black carbon, POC: particulate organic carbon, PBC: particulate black carbon, CHL: chlorophyll a, VA: viral abundance, BA: bacterial abundance, BP: bacterial production in the bulk sample.
significantly correlated to such other parameters only in the SML, where it correlated with the other particulate parameters (e.g., POC, PBC, Chl a) as well as with inorganic phosphorous and DBC (Table 2).
3.4. Viral life strategies (lytic versus lysogeny)
Lytic viral infection, as determined from FVIC by TEM, was detected for all sampling occasions. Among the stations, lytic infection varied by a factor of 10, with significantly
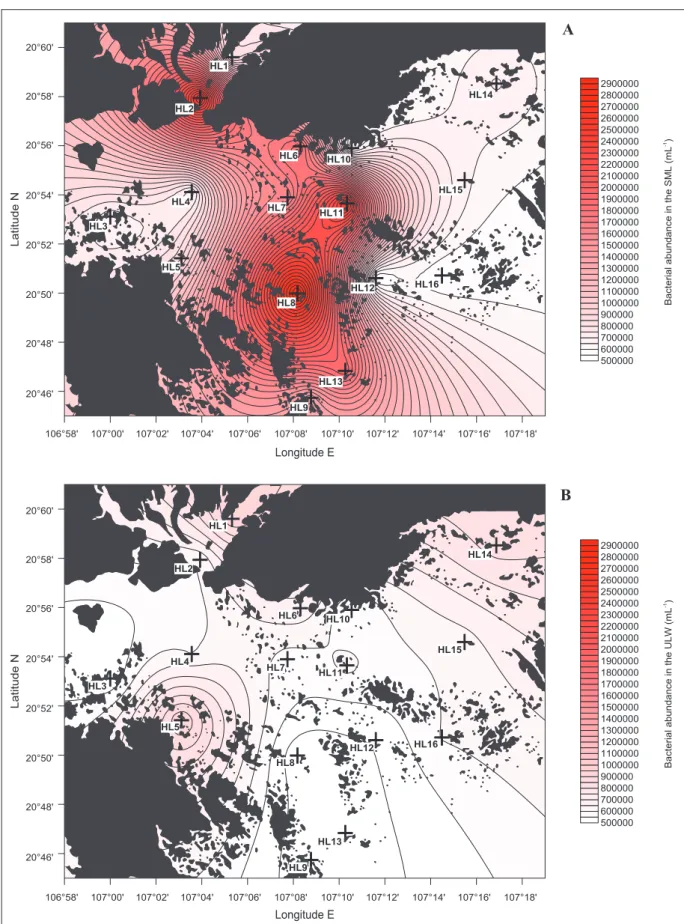
Figure 1: Distribution of viral abundance in the sea surface microlayer and underlying water of Halong Bay.
Spatial distribution of viral abundance, indicated by the blue color bar, is shown for (A) the sea surface microlayer (SML)
and (B) underlying water (ULW) at the investigated stations (crosses). DOI: https://doi.org/10.1525/elementa.276.f1
A
higher values in the SML than in ULW (p < 0.01; Figure 5).
The frequency of infected cells (FIC) varied from 5.3 to 30.1% in the SML realm (Table 1), with an average value
of 14.2% corresponding to 19% of virally induced
bacterial mortality. Maxima in FIC differed between the SML (station HL2) and ULW (station HL5) and were significantly related to concentration of DBC and Chl a and to BP (Table 2).
A
B
Figure 2: Distribution of bacterial abundance in the sea surface microlayer and underlying water of Halong Bay. Spatial distribution of bacterial abundance, indicated by the red color bar, is shown for (A) the sea surface
microlayer (SML) and (B) underlying water (ULW) at the investigated stations (crosses). DOI: https://doi.org/10.1525/
The lysogenic fraction of the bacterial community (FLC, based on the number of induced prophages), was calculated based on maximum burst size estimates from this study, and from water samples that displayed a statistically significant (90 to 95% confidence interval) increase in viral abundance upon treatment with Mitomycin C relative to uninduced control samples. The occurrence of lysogeny was observed in both the SML and ULW but their percentages (ranging from undetectable to ~2%) were significantly lower than lytic infection rates (p < 0.001; Table 1). The highest percent of induction
events, which was observed in ULW at station HL13, coincided with low concentrations of inorganic nutrients
(nitrogen, phosphorus) and Chl a. Overall, in both the SML and ULW, lysogeny correlated negatively with DIN (p < 0.001) and DIP concentrations (p < 0.05). Overall, lytic and lysogenic fractions of the bacterial community were inversely correlated (y = 0.0025x2 – 0.1113x + 1.5543, r = –0.55, n = 31, p < 0.001; Figure 6).
3.5. Infection of bacterial cell morphotypes
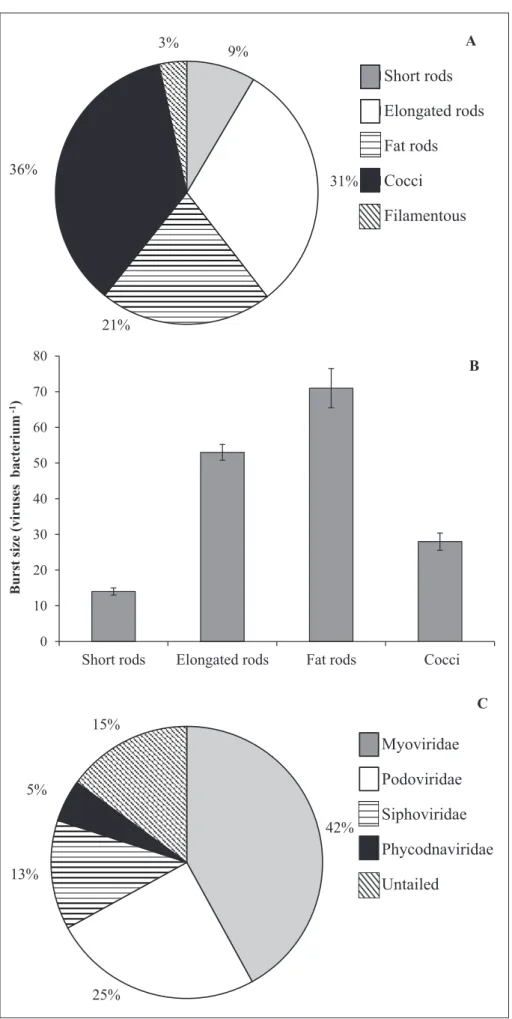
Based on examination of SML samples by transmission electron microscopy, the observed five different bacterial cell morphotypes infected by viruses belonged to elongated rods, fat rods, short rods, cocci and filamentous forms. Among them, rods were dominant (61%), followed
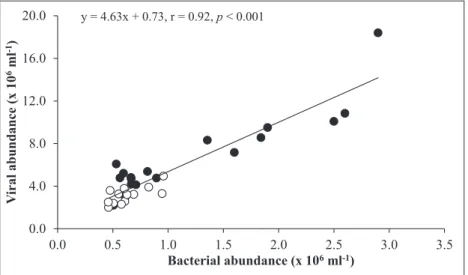
0.0 4.0 8.0 12.0 16.0 20.0 0.0 0.5 1.0 1.5 2.0 2.5 3.0 3.5 V iral abundance (x 10 6ml -1) Bacterial abundance (x 106ml-1) y = 4.63x + 0.73, r = 0.92, p < 0.001
Figure 3: Relationship between viral and bacterial abundance in the sea surface microlayer and underlying water of Halong Bay. This positive relationship is shown as a linear regression analysis (black line) using all data
points (n = 32). Black circles indicate the sea surface microlayer; white circles indicate underlying water. DOI: https:// doi.org/10.1525/elementa.276.f3 0.0 2.0 4.0 6.0 8.0 10.0 12.0 14.0 16.0 Leucine incorporation (nM h -1)
Figure 4: Leucine incorporation rate in the sea surface microlayer and underlying water at the investigated stations. Leucine incorporation rate, representing bacterial production, is shown for the sea surface microlayer (SML,
bulk in black bars and >3µm fraction in gray bars) and underlying water (ULW, white bars). Rates were not obtained for stations H5 and H12, except for ULW at H5. DOI: https://doi.org/10.1525/elementa.276.f4
A
B
Figure 5: Distribution of frequency of virally infected bacteria in the sea surface microlayer and underlying water. Spatial distribution of the frequency of virally infected bacterial cells (FIC, %), indicated by the orange color
bar, is shown for (A) the sea surface microlayer (SML) and (B) underlying water (ULW) at the investigated stations
by cocci (36%). Filamentous forms contributed to less than 4% of the infected cells. The percentage of infected cells belonging to different morphotypes is shown in
Figure 7A. Among rods, the elongated rods were the most
infected (31%), followed by fat rods (21%) and short rods (9%). The investigated bacterial morphotypes exhibited strong and significant differences regarding the frequency of cells containing mature phages, as well as the maximum burst size (p < 0.001; Figure 7B). Indeed, the number
of infected cells in fat rods was lower than in elongated thin rods, contrasting with BSmax, which was significantly higher (p < 0.01) due to the larger cell volume of fat rods (0.8–1.2 µm3 cell–1). Observations by transmission electron microscopy revealed that among the viral morphotypes, those representing the Myoviridae were the most dominant (42%), whereas the percentage of large untailed viruses belonging to the family Phycodnaviridae was the lowest (5%; Figure 7C).
4. Discussion
The present investigation is the first to be conducted in a highly BC-impacted tropical marine coastal ecosystem (Halong Bay, Vietnam) across a large spatial gradient to determine the potential impact of BC deposition on bacterial and viral parameters, along with associated environmental variables, with prime focus on the SML. Halong Bay is a tropical coastal system located in a regional hotspot of atmospheric BC concentration (Ramanathan et al., 2007; Ramanathan and Carmichael, 2008), exhibiting high concentrations of BC especially during the dry season due to increased northeastern atmospheric fluxes (Hien et al., 2002; S Chifflet and B Guinot, personal
communication).
Previous studies of the enrichment of inorganic and organic nutrients along with chl a in the SML compared to ULW have suggested that the former has distinct physico-chemical properties which can originate from high atmospheric deposition or high marine biological
production (Liss and Duce, 1997; Engel and Galgani, 2016). In this study of Halong Bay, the SML was distinguished by its high concentrations of particulate carbon (TPC, PBC, and POC, though not Chl a) relative to underlying surface waters of this and other coastal marine environments (Martiny et al., 2013), and the percentages of TPC in the SML attributable to black carbon (32–97%) are among the highest reported (Flores-Cervantes et al., 2009). The distribution and accumulation of anthropogenic particulate material like BC in the pelagic realm can depend strongly on the prevailing physical forces such as wind speed and wave action (Stolle et al., 2010). Strong wind speed (>5 m s–1) can effectively disrupt the SML (Wurl et al., 2011) and mix the material composing it (including BC) into the water column. The significantly higher concentrations of PBC in the SML compared to ULW suggest a long retention time in the SML realm as a result of the prevailing low wind speed (<3 m s–1) at the time of sampling.
The enrichment of bacteria and viruses in the SML appeared to be minimal (approximately 2-fold higher than in ULW) when compared to previous reports of high enrichment (10- to 12-fold; Aller et al., 2005), yet higher than reported in other SML studies (where bacterial enrichment was largely negligible; Reinthaler et al., 2008; Cunliffe et al., 2009a). It has been argued that the type of sampler used to collect the SML may strongly affect the results obtained (Agogué et al., 2005; Cunliffe et al., 2009b). Higher BP rates (by 5-fold), however, were also observed in the SML in our study, along with significant positive correlations between BP and other environmental parameters, including particulate and dissolved BC concentrations (Table 2). The highest BP was
measured at the station which coincided with the highest concentrations of both BC and ammonium, suggesting that bacterial activity might have been stimulated by the combined action of both variables, as demonstrated in laboratory experiments (Malits et al., 2015). We thus
Figure 6: Relationship between virally infected and lysogenic bacteria in the sea surface microlayer and underlying water. This inverse relationship between frequency of virally infected bacteria (FIC) and frequency of
lysogenic bacteria is shown with a linear regression analysis using all data points (n = 31). Black circles indicate the sea surface microlayer; white circles indicate underlying water. DOI: https://doi.org/10.1525/elementa.276.f6
0.0 0.5 1.0 1.5 2.0 2.5 0.0 5.0 10.0 15.0 20.0 25.0 30.0 35.0 ) %( air etc ab ci ne gos yl f o y cn eu qer F
Frequency of lytically infected bacteria (%) y = 0.0025x2 - 0.1113x + 1.5543, r = -0.55, p < 0.01
0 10 20 30 40 50 60 70 80
Short rods Elongated rods Fat rods Cocci
mui ret ca b s es uri v( ezi s t sr u B -1) B Short rods Elongated rods Fat rods Cocci Filamentous 3% 36% 21% 31% 9% A Myoviridae Podoviridae Siphoviridae Phycodnaviridae Untailed 5% 13% 42% 15% C 25%
Figure 7: Transmission electron microscopy analyses of infected bacteria and viral morphotypes in the sea surface microlayer. Shown are the percentages of infected bacteria according to bacterial morphotype (A), the
average maximum burst size (viruses per bacterium) estimated for the different bacterial morphotypes (B), and the
suggest that our observations support conclusions of recent studies, specifically that BC can be an important source of carbon for bacterial utilization as it can be made available to the bacterial community through photochemical (Stubbins et al., 2012) and microbial oxidation (Zimmerman, 2010), thereby challenging the previous assumption of its refractory and chemically recalcitrant nature. Experimental studies have indicated that the exposure of BC particles to solar radiation can bring about changes in their aromatic structure (Stubbins et al., 2012), thus increasing their bioavailability to seawater microbes. The activity of enzyme systems at warmer temperatures can result in increased degradation of BC particles to dissolved forms, which can be used efficiently by bacterial communities for growth and activity (Lopez-Urrutia and Moran, 2007). The adsorption of DOM and nutrients to BC particles may also create microniches that could serve as hot spots for microbial activity (though our data were not collected on a scale to reveal such activity). Ultimately, by impacting the physiological state of bacteria and their overall community metabolism, the bacterial utilization of black carbon becomes a potential factor influencing viral life strategies in aquatic systems (Maurice et al., 2013; Palesse et al., 2014).
Previous reports have suggested that virally mediated bacterial mortality decreases with an increase in BC concentration (Mari et al., 2014; Malits et al., 2015). Bacterial cells may be trapped within BC particles, which could result in the hiding of bacterial receptors thereby lowering the chances of viral infection. In our study, the percent BP associated with the particulate fraction >3 µm was low, in contrast to a previous study reporting high BP on aggregates, as well as a high percentage of microbes attached to soot particles and low viral infection rates (Mari et al., 2014). Stimulation of bacterial activity in the SML by DOC and the dissolved fraction of BC, as reflected by high BP in this study, could have led to high lytic infection and eventually viral production. Across the study stations, both lytic infection and percent lysogeny were negatively related to each other, hence suggesting the existence of an antagonistic relation between these strategies, as previously reported for both freshwater (Pradeep Ram et al., 2014) and marine systems (Weinbauer et al., 2003; Payet and Suttle, 2013). Methodological constraints can contribute to the observed variation and estimation of lytic infection and lysogeny in our study. Adsorption of virally infected bacterial cells onto BC particles can mask their detection by transmission electron microscopy and result in underestimates of their occurrence. Although to date mitomycin is the most frequently used chemical agent to estimate percent lysogeny, its effectiveness as a prophage-inducing agent is largely unknown, especially in highly BC-impacted environmental systems. Therefore, estimates of lytic and lysogenic infections reported in this study should be considered as minimum estimates.
Bacteria can modify their morphology in response to environmental cues, and selective forces such as nutrient uptake capabilities and predation have been shown to have a strong impact on bacterioplankton (Young, 2007).
The impact of phages on bacteria depends strongly on the metabolic activity of host cells (Pradeep Ram et al., 2014), which may be directly linked to the size of these cells (Ferla and Leonardi, 2005). In our study, the SML supported higher viral lytic infection rates amidst increased host abundances and activity, such that viruses could be expected to strongly and selectively impact different morphotypes within the bacterial community. The strong differences in the frequencies of bacterial cells filled with mature phages (i.e., BSmax) and of viral infection among the investigated bacterial morphopopulations (Figure 8A–G)
might be due, at least to some extent, to the physiological differences associated with different bacterial phenotypes. In the present study, the abundances of the dominant and most infected rod-shaped bacteria were well above the threshold level of 2 × 10⁵ cells mL–1 necessary for the occurrence of detectable phage infection in the plankton (Weinbauer and Peduzzi, 1994). We consider that selective lysis of cells belonging to a particular morphotype (i.e., rod-shaped cells in our study) may induce substantial changes in the functional roles of the natural bacterial community and related biogeochemical processes. The observed phage morphology in Halong Bay (Figure 8H–O)
can provide clues about host range and viral replication, as well as some insights into the selective pressure facing viral communities. In the SML, the dominance of myoviruses (42% of the total population) belonging to this double-stranded DNA bacteriophage family was associated with relatively high lytic infection, which is in agreement with earlier reports from other aquatic systems (e.g., Suttle, 2005). Myoviruses with contractile tails are known to have broader host ranges than other phage, even infecting different species of bacteria (Sullivan et al., 2003), and to benefit from increased generation times in host populations (Suttle, 2005), suggesting a link in this study between myovirus dominance and the elevated rates of BP measured in the SML.
5. Conclusion
In the present study, the SML was more dynamic microbially than underlying water, showing wide variations in microbial standing stock, activity and viral life strategies across the stations of varying BC concentrations. High BP in the bulk sample compared to the particle-associated fraction, along with various correlation analyses, suggest that more targeted studies of bacterial utilization of dissolved BC in the SML are warranted. Viral lytic infection was supported by the high BP, especially in the SML realm, which indicated that the viral shunt was active and providing DOM for the uninfected bacterial community. Adsorption of DOM onto BC particles together with higher relative bacterial community respiration due to viral lysis can further accelerate the system to net heterotrophy (net source of C to atmosphere). With future increases in fossil fuel and biomass burning, the impact of BC on the functioning of the marine microbial food web is likely to become more important, particularly in the coastal zone. Viruses have to be considered as a potential top down factor and further studies should focus on their role in the regulation of bacterial metabolism and community
structure, which can provide more cues on the functional role of microbial interactions in such human- impacted environments.
Data Accessibility Statement
All data used in this study are available from the corresponding author upon request.
Acknowledgements
We thank J. Colombet for his assistance with flow cytometry analysis and I. Ulber for preparation of BPCA samples. We appreciate the editor in chief, associate editor and two reviewers for their time, efforts and valuable contributions to this manuscript.
Funding information
This work was supported by the French National Institute of Sciences of the Universe (Project SOOT-EC2CO 2013), the French-Vietnamese Hubert Curien Partnership (Contract No. 23971TK) and the Ministry of Science and Technology of Vietnam (Contract No. 46/2012/HD-NDT).
Competing interests
The authors have no competing interests to declare.
Author contributions
• Contributed to conception and design: ASPR, XM, TSN
• Contributed to acquisition of data: ASPR, XM, JB, VTC • Contributed to analysis and interpretation of data:
ASPR, JPT, PR, JN
• Drafted and/or revised the article: ASPR, XM, JN, TSN • Approved the submitted version for publication:
ASPR, XM, JB, JPT, VTC, PR, JN, TSN
References
Agogué, H, Casamayor, EO, Bourrain, M, Obernosterer, I, Joux, F, Herndl, GJ, et al. 2005 A survey on bacteria
inhabiting the sea surface microlayer of coastal ecosystems. FEMS Microbiol Ecol 54: 269–280. DOI:
https://doi.org/10.1016/j.femsec.2005.04.002
Akhter, MS, Chughtai, AR and Smith, DM 1984 The
structure of hexane soot: I. Spectroscopic studies.
Appl Spectrosc 39(1): 143–153. DOI: https://doi.
org/10.1366/0003702854249114
Akhter, MS, Chughtai, AR and Smith, DM 1985 The
structure of hexane soot: II. Extraction studies.
Appl Spectrosc 39(1): 154–167. DOI: https://doi.
org/10.1366/0003702854249204 C A D E B F G H I J K M L O N
Figure 8: Transmission electron micrographs of infected bacteria and viral morphotypes in the sea surface microlayer. Shown are examples of infected bacteria representing the different bacterial morphotypes observed: cocci (A, B), short rods (C, D), elongated thin rods (E) and fat rods (F, G); scale bar = 100 nm. Observed viral morphotypes
belong to the myoviridae (H, I), podoviridae (J, K), siphoviridae (L, M) and nontailed viruses (N, O); scale bar = 50 nm.
Aller, JY, Kuznetsova, MR, Jahns, CJ and Kemp, PF 2005
The sea surface microlayer as a source of viral and bacterial enrichment in marine aerosols. J Aerosol
Sci 36: 801–812. DOI: https://doi.org/10.1016/j.
jaerosci.2004.10.012
Aminot, A and Kérouel, R 2007 Dosage Automatique
des Nutriments dans les Eaux Marines: Méthodes en Flux Continu, Ifremer, France, 188.
Azam, F and Malfatti, F 2007 Microbial structuring of
marine ecosystems. Nature Rev 5: 782–791.
Breitbart, M 2012 Marine viruses: Truth or dare. Ann Rev
Mar Sci 4: 425–448. DOI: https://doi.org/10.1146/
annurev-marine-120709-142805
Brum, JR, Steward, GF, Jiang, SC and Jellison, R 2005
Spatial and temporal variability of prokaryotes, viruses, and viral infections of prokaryotes in an alkaline, hypersaline lake. Aquat Microb Ecol
41: 247–260. DOI: https://doi.org/10.3354/
ame041247
Brussaard, C, Payet, JP, Winter, C and Weinbauer, MG 2010 Quantification of aquatic viruses by flow
cytometry. In: Wilhelm, SW, Weinbauer, MG and Suttle, C (eds.), Manual of Aquatic Viral Ecology, 102–109. Chapter 11, Waco: ASLO. DOI: https://doi. org/10.4319/mave.2010.978-0-9845591-0-7.102
Cachier, H, Bremond, MP and Buart-Ménard, P 1989
Determination of atmospheric soot carbon with a simple thermal method. Tellus 41B: 379–390.
DOI: https://doi.org/10.1111/j.1600-0889.1989. tb00316.x
Cattaneo, R, Rouviere, C, Rassoulzadegan, F and Weinbauer, MG 2010 Association of marine viral
and bacterial communities with reference black carbon particles under experimental conditions: An analysis with scanning electron, epifluorescence and confocal laser scanning microscopy. FEMS
Microbiol Ecol 74: 382−396. DOI: https://doi.
org/10.1111/j.1574-6941.2010.00953.x
Cunliffe, M, Engel, A, Frka, S, Gasparovic, B, Guitart, C, Murrell, JC, et al. 2013 Sea surface microlayers: A
unified physicochemical and biological perspective of the air-ocean interface. Progr Oceanogr
109: 104–116. DOI: https://doi.org/10.1016/j.
pocean.2012.08.004
Cunliffe, M, Harrison, E, Salter, M, Schäfe, H, Upstill-Goddard, RC and Murrell, JC 2009a
Comparison and validation of sampling strategies for the molecular microbial analysis of surface microlayers. Aquat Microb Ecol 57: 69–77. DOI:
https://doi.org/10.3354/ame01330
Cunliffe, M, Salter, M, Mann, PJ, Whiteley, A, Upstill-Goddard, RC and Murrell, JC 2009b Dissolved
organic carbon and bacterial populations in the gelatinous surface microlayer of a Norwegian fjord mesocosm. FEMS Microbiol Lett 299: 248–254. DOI:
https://doi.org/10.1111/j.1574-6968.2009.01751.x
Cunliffe, M, Upstill-Goddard, RC and Murrell, JC 2011
Microbiology of aquatic surface microlayers. FEMS
Microbiol Rev 35: 233–246. DOI: https://doi.
org/10.1111/j.1574-6976.2010.00246.x
Daniel, A, Kérouel, R and Aminot, A 2012 Pasteurization:
A reliable method for preservation of nutrient in seawater samples for inter-laboratory and field applications. Mar Chem 128–129: 57–63. DOI:
https://doi.org/10.1016/j.marchem.2011.10.002
Dittmar, T 2008 The molecular level determination of
black carbon in marine dissolved organic matter.
Organic Geochemistry 39: 396–407. DOI: https://
doi.org/10.1016/j.orggeochem.2008.01.015
Dittmar, T, Koch, BP, Hertkorn, N and Kattner, G 2008
A simple and efficient method for the solid-phase extraction of dissolved organic matter (SPE-DOM) from seawater. Limnol Oceanogr-Meth 6: 230–235.
DOI: https://doi.org/10.4319/lom.2008.6.230
Engel, A and Galgani, L 2016 The organic sea-surface
microlayer in the upwelling region off the coast of Peru and potential implications for air-sea exchange processes. Biogeosciences 13: 989–1007. DOI:
https://doi.org/10.5194/bg-13-989-2016
Ferla, RL and Leonardi, M 2005 Ecological implications
of biomass and morphotype variations of bacterioplankton: An example in a coastal zone of the Northern Adriatic Sea (Mediterranean).
Mar Ecol-Evol Persp 26: 82–88. DOI: https://doi.
org/10.1111/j.1439-0485.2005.00049.x
Flores-Cervantes, DX, Plata, DL, MacFarlane, JK, Reddy, CM and Gschwend, PM 2009 Black carbon
in marine particulate organic carbon: Inputs and cycling of highly recalcitrant organic carbon in the Gulf of Maine. Mar Chem 113: 172–181. DOI:
https://doi.org/10.1016/j.marchem.2009.01.012
Forbes, MS, Raison, RJ and Skjemstad, JO 2006
Formation, transformation and transport of black carbon (charcoal) in terrestrial and aquatic ecosystems. Sci Total Environ 370: 190–206. DOI:
https://doi.org/10.1016/j.scitotenv.2006.06.007
Fuhrman, JA, Cram, JA and Needham, DA 2015 Marine
microbial community dyanmics and their ecological interpretation. Nat Rev Microbiol 13: 133–146. DOI:
https://doi.org/10.1038/nrmicro3417
Garret, WD 1967 Organic chemical composition of ocean
surface. Deep-Sea Res I 14: 221–227. DOI: https://
doi.org/10.1016/0011-7471(67)90007-1
Gattuso, JP, Frankignoulle, M and Wollast, R 1998
Carbon and carbonate metabolism in coastal aquatic systems. Annu Rev Ecol Syst 29: 405–43. DOI:
https://doi.org/10.1146/annurev.ecolsys.29.1.405
Grahame, TJ, Klemm, R and Schlesinger, RB 2014
Public health and components of particulate matter: The changing assessment of black carbon. J
Air Waste Manag Assoc 64: 620–660. DOI: https://
doi.org/10.1080/10962247.2014.912692
Guazzotti, SA, Coffee, KR and Prather, PA 2001
Continuous measurements of size-resolved particle chemistry during INDOEX-Intensive Field Phase 99 (Paper 2001 JD900099). J Geophys
Res 106: 28607–28627. DOI: https://doi.
org/10.1029/2001JD900099
Hadley, OL, Ramanathan, V, Carmichael, GR, Tang, Y, Corrigan, CE, Roberts, GC, et al. 2007
Trans-Pacific transport of black carbon and fine aerosols (D < 2.5 µm) into North America. J
Geophys Res 112(D05): 309. DOI: https://doi.
org/10.1029/2006JD007632
Hedges, J, Eglinton, G, Hatcher, PG, Kirchman, DL, Arnosti, C, Derenne, S, et al. 2000 The molecularly
uncharacterized component of nonliving organic matter in natural environments. Org Geochem
31: 945–958. DOI: https://doi.org/10.1016/
S0146-6380(00)00096-6
Hien, PD, Bac, VT, Tham, HC, Nhan, DD and Vinh, LD 2002 Influence of meteorological conditions
on PM2.5 and PM2.510 concentrations during the monsoon season in Hanoi, Vietnam. Atmos Environ
36: 3473–3484. DOI: https://doi.org/10.1016/
S1352-2310(02)00295-9
Holm-Hansen, O, Lorenzen, CJ, Holmes, RW and Strickland, JDH 1965 Fluorometric determination
of chlorophyll. J Cons Perm Int Explor Mer 30: 3–15.
DOI: https://doi.org/10.1093/icesjms/30.1.3
Huynh, S 2002 Hydrodynamic study of Ha Long Bay
(PhD thesis). Department of Environmental Engineering, University of Western Australia. Available at: http://www.web.uwa.edu.au/__data/ assets/pdf_file/0007/1637287/HUYNH_2002.pdf.
Kim, S, Kaplan, LA, Benner, R and Hatcher, PG 2004
Hydrogen-deficient molecules in natural riverine water samples-evidence for the existence of black carbon in DOM. Mar Chem 92: 225–234. DOI:
https://doi.org/10.1016/j.marchem.2004.06.042
Koelmans, AA, Jonker, MTO, Cornelissen, G, Bucheli, TD, Van Noort, PCM and Gustafsson, O 2006 Black carbon: The reverse of its dark side.
Chemosphere 63: 365−377. DOI: https://doi.
org/10.1016/j.chemosphere.2005.08.034
Kuhlbusch, TAJ 1995 Method for determining black
carbon in residues of vegetation fires. Environ
Sci Technol 29: 2695–2702. DOI: https://doi.
org/10.1021/es00010a034
Lim, L, Wurl, O, Karuppiah, S and Obbard, JP 2007
Atmospheric wet deposition of PAHs to the sea surface microlayer. Mar Poll Bull 54: 1212–822.
DOI: https://doi.org/10.1016/j.marpolbul.2007.03. 023
Lopez-Urrutia, A and Moràn, XAG 2007 Resource
limitation of bacterial production distort the temperature dependence of oceanic carbon cycling. Ecology 88: 817–822. DOI: https://doi.
org/10.1890/06-1641
Malits, A, Cattaneo, R, Sintes, E, Gasol, JM, Herndl, GJ and Weinbauer, MG 2015 Potential impacts of
black carbon on the marine microbial community.
Aquat Microb Ecol 75: 27–42. DOI: https://doi.
org/10.3354/ame01742
Mari, X, Chu, VT, Guinot, B, Brune, J, Lefebvre, J-P, Raimbault, P, et al. 2017 Dynamics of atmospheric
and river inputs of dissolved and particulate Black Carbon during an annual cycle in Halong Bay, Vietnam. Elem Sci Anth (in press). DOI: https://doi. org/10.1525/elementa.255
Mari, X, Lefèvre, J, Torréton, JP, Bettarel, Y, Pringault, O, Rochelle-Newall, E, et al. 2014 Effects of soot
deposition on particle dynamics and microbial processes in marine surface waters. Global
Biogeochem Cy 28: 662–678. DOI: https://doi.
org/10.1002/2014GB004878
Martiny, AC, Vrugt, JA, Primeau, FW and Lomas, MW
2013 Regional variation in the particulate organic carbon to nitrogen ratio in the surface ocean. Global
Biogeochem Cy 27(3): 723–731. DOI: https://doi.
org/10.1002/gbc.20061
Masiello, CA 2004 New directions in black carbon
organic geochemistry. Mar Chem 92: 201−213. DOI:
https://doi.org/10.1016/j.marchem.2004.06.043
Maurice, CF, Bouvier, C, de Wit, R and Bouvier, T 2013
Linking the lytic and lysogenic bacteriophage cycles to environmental conditions, host physiology and their variability in coastal lagoons. Environ
Microbiol 15: 2463–2475. DOI: https://doi.org/
10.1111/1462-2920.12120
Momzikoff, A, Brinis, A, Dallot, S, Gondry, G, Saliot, A and Lebaron, P 2004 Field study of the chemical
characterization of the upper ocean surface using various samplers. Limnol Oceanogr-Meth 2: 374–386.
DOI: https://doi.org/10.4319/lom.2004.2.374
Palesse, S, Colombet, J, Pradeep Ram, AS and Sime-Ngando, T 2014 Linking host prokaryotic
physiology to viral lifestyle dynamics in a temperate freshwater lake (Lake Pavin, France). Microb Ecol
68: 740–750. DOI: https://doi.org/10.1007/
s00248-014-0441-2
Paul, JH and Jiang, S 2001 Lysogeny and transduction.
In: Paul, JH (ed.), Methods in Microbiology 30:
105–125. San Diego: Academic Press. DOI: https:// doi.org/10.1016/S0580-9517(01)30042-9
Payet, JP and Suttle, CA 2013 To kill or not to kill: The
balance between lytic and lysogenic viral infection is driven by trophic status. Limnol Oceanogr 58:
465–474. DOI: https://doi.org/10.4319/lo.2013. 58.2.0465
Pollard, PC and Moriarty, DJ 1984 Validity of the tritiated
thymidine method for estimating bacterial growth rates: Measurement of isotope dilution during DNA synthesis. Applied Environ Microbiol 48(6):
1076–1083.
Pradeep Ram, AS, Palesse, S, Colombet, J, Thouvenot, A and Sime-Ngando, T 2014 The
relative importance of viral lysis and nanoflagellate grazing for prokaryote mortality in temperate lakes. Freshw Biol 59: 300–311. DOI: https://doi.
org/10.1111/fwb.12265
Pradeep Ram, AS and Sime-Ngando, T 2010 Resources
drive trade-off between viral lifestyles in the plankton: Evidence from freshwater microbial microcosms. Environ Microbiol 12: 467–479. DOI:
https://doi.org/10.1111/j.1462-2920.2009.02088.x
Raimbault, P, Garcia, N and Cerutti, F 2008 Distribution
of inorganic and organic nutrients in the South Pacific Ocean—Evidence for long-term accumulation of organic matter in nitrogen depleted waters.