Publisher’s version / Version de l'éditeur:
Vous avez des questions? Nous pouvons vous aider. Pour communiquer directement avec un auteur, consultez la
première page de la revue dans laquelle son article a été publié afin de trouver ses coordonnées. Si vous n’arrivez pas à les repérer, communiquez avec nous à [email protected].
Questions? Contact the NRC Publications Archive team at
[email protected]. If you wish to email the authors directly, please see the first page of the publication for their contact information.
https://publications-cnrc.canada.ca/fra/droits
L’accès à ce site Web et l’utilisation de son contenu sont assujettis aux conditions présentées dans le site LISEZ CES CONDITIONS ATTENTIVEMENT AVANT D’UTILISER CE SITE WEB.
Paper (National Research Council of Canada. Division of Building Research); no.
DBR-P-1011, 1981-05
READ THESE TERMS AND CONDITIONS CAREFULLY BEFORE USING THIS WEBSITE. https://nrc-publications.canada.ca/eng/copyright
NRC Publications Archive Record / Notice des Archives des publications du CNRC :
https://nrc-publications.canada.ca/eng/view/object/?id=051e837a-2a57-4e87-b6e4-3e4bfd878eed https://publications-cnrc.canada.ca/fra/voir/objet/?id=051e837a-2a57-4e87-b6e4-3e4bfd878eed
NRC Publications Archive
Archives des publications du CNRC
This publication could be one of several versions: author’s original, accepted manuscript or the publisher’s version. / La version de cette publication peut être l’une des suivantes : la version prépublication de l’auteur, la version acceptée du manuscrit ou la version de l’éditeur.
For the publisher’s version, please access the DOI link below./ Pour consulter la version de l’éditeur, utilisez le lien DOI ci-dessous.
https://doi.org/10.4224/40001779
Access and use of this website and the material on it are subject to the Terms and Conditions set forth at
Performance of protective linings for polystyrene insulation in a corner
wall test
Sar
no. 1011
e. 2
mfi
NATIONAL RESEARCH COUNCIL OF CANADACONSEIL NATIONAL DE RECHERCHES DU CANADA
Performance o f Protective
Linings for Polystyrene
Insulation in
a
Corner Wall Test
M. V. D'SOUZA, M. A. KASEM, and M. GALBREATH
. 1 7 z r > . ----
N . ~ c ' -- C I S T I I Reprinted from BED$.
r?&S.
L!G2ifiLRY
1
FIRE TECHNOLOGYVol. 17, No. 2, May 1981
61-
12-
2
1
1
p. 85-97Price: $1.25
DBR Paper No. 1011 Division of Building Research
Les essais de cloisons jointives, effectues sur des assemblages en mousse de polystyr2ne portegke par un revstement, ont dCmontre qu'en ajoutant un revCtement a l'isolation, possedant une classification de propagation du feu infkrieure
a
150 (telle que mesuree par l'essai en tunnel de 7,6 m), on contribuait a rkduire la vitessa de propagation du feu en debut d'incendie. D'autre part, les dangers presentts par un assemblage de ce type n'etaient pas plus strieux pendant la phase de formation du feu, qu'avec un dispositif de m&me type utilisant une isolation en fibre de verre. Cependant, apr2s l'inflammation genkralisee, les performances des deux types d'isolation Ctaient t r b differentes. ExposCe a la flamme, la mousse de polystyr2ne contribuait fortement a intensifier le feu, contraire- ment a l'isolation en fibre de verre.On a constate que proprietts thermiques de l'isolation influaient sur la propagation des flammes le long de la surface exposte des matkriaux de couverture minces.
FIRE TECHNOLOGY
Performance of Protective
Linings for Polystyrene
Insulation in
a
Corner Wall Test
M. V. D'SOUZA,* M. A. KASEM,t and M. GALBREATH*
Comer tests on assemblies of protected polystyrene foam showed that the addition of any covering material to the insulation having a flame spread classification of less than 150 as measured by the 7.6-m tunnel test was beneficial in terms of reducing the rate of early fire spread.
A
FEW YEARS AGO, it was shown that the 7.6-m tunnel-furnace test,' traditionally used by several building codes for regulating the flam- mability of interior linings of buildings, did not provide a true indication of the relative fire hazard posed by certain foamed plastic insulation^.^ While solutions to this problem were being sought in the form of more realistic tests, most regulating bodies implemented interim measures aimed essen- tially at safeguarding such materials from accidental ignition.Early in 1976, the Associate Committee of the National Building Code of Canada (NBCC) issued revisions to the Code stipulating that foamed plastics not be used as finish materials but that they be protected thermally on the interior surface by specified materials. For noncombustible construc- tion the protective cover must be equivalent to 12.7-mm gypsum wallboard which, when exposed to the temperature-time curve described in standard ULC-S101-1971,3 limits the average temperature rise at the foam- protective cover interface to 140" C for a period of 10 min. (Tests have shown that below a temperature of 160" C, most commonly used plastic foams experience negligible weight loss.) For buildings that are permitted to be of combustible construction, certain interior lining material, such as
*
Fire Research Section, Division of Building Research, National Research Council of Canada.t Scientific and Laboratory Services. Department of Consumer and Corporate Affairs, Ottawa, Canada.
Copyrlght O 1981 NATIONAL FIRE PROTECTION ASSOCIATION
All Rights Resewed Primed In U.S.A.
Fire Technology
gypsum products, plywoods, fiberboards, and particleboards, are con- sidered acceptable as protective finishes as well. In such buildings, materials whose flame spread classifications are less than 150, as measured by the 7.6-m tunnel test, are considered acceptable; there is no thermal resistance requirement similar to that for noncombustible construction
In contrast, most U.S. building codes consider 12.7-mm gypsum board (or equivalent) as the only suitable protective lining for all foamed plastics, irrespective of the type of construction. The criteria for selection are similar to those used in Canada except that protection is required for 15 min. In combustible construction, the sole requirement for insulations other than plastic is that the exposed surface have a flame spread rating of 200 or less, as measured by the tunnel test.4
In 1977, the Department of Consumer and Corporate Affairs (CCA) re- quested that the plastics industry in Canada implement certain measures aimed at reducing the potential for harm by fire to the user of plastic in- sulating products. These were the addition of sufficient fire retardant to ex- panded polystyrene foam (EPS); the preparation of literature for distribu- tion at point of sale describing the proper use and installation of these materials; and the labeling of these products as to their combustible nature. EPS was selected because this material presently comprises a major portion of the foamed-plastic-insulation market and because of the direct consumer involvement in its use in combustible dwellings.
I t is appropriate at this time to describe briefly the behavior of expanded polystyrene during the early stages of fire exposure. This material softens and shrinks at about 100" C. With a further rise in temperature, the next critical stage is the decomposition of the softened plastic into its consti- tuents and, in particular, the stage a t which the chemically bound fire retar- dants are released. This generally occurs around 200" C, beyond which igni- tion temperatures are reached. For polystyrene beadboard foam, flash and self-ignition temperatures are about 345" C and 490" C re~pective1y.~-'
With sufficient fire retardant, small accidental ignition sources, such as a blow torch, would probably be incapable of supplying enough heat to sus- tain a fire, as the EPS will often shrink away from the source. However, in the presence of a large source, such as burning upholstered furniture, all the processes described here occur simultaneously at various locations, so that once the retardant has been released, flames can spread rapidly depending on the quantity of combustible present and the thermal environment. Thus, the use of a gypsum wallboard protective cover is intended to delay the fuller involvement of the plastic foam in a fire. Nevertheless, it is felt that the other linings permitted by the Canadian Code do not provide the necessary thermal protection when exposed to an actual fire. I t was in this context that the present study was undertaken.
The objective of the work reported here was to examine, from a flam- mability standpoint, the performance of common interior linings when used as protective finishes for expanded polystyrene in combustible dwellings. For comparison, tests were also run using glass fiber insulation.
Polystyrene Insulation 87 Measurements were made to permit a preliminary appraisal of the thermal protection provided by these linings. A thorough study of this aspect is be- ing carried out in a separate investigation.
E X P E R I M E N T A L D E T A I L S
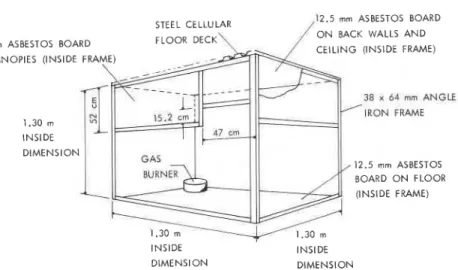
The apparatus used to examine the selected materials is illustrated in Figure 1. I t consisted of a modified corner wall configuration conforming to ULC Standard ULC-S127-1978.8 Earlier work at the National Research Council of Canada (NRCC)9 showed that the addition of canopies to the sim- ple corner arrangement provided a better approximation to a room envelope and that, through careful scaling, 1.2-m and 2.4-m units produced similar results.
STEEL CELLULAR ,12.5 mm ASBESTOS BOARD O N BACK WALLS AND m m ASBESTOS BOARD
CEILING (INSIDE FRAME) CANOPIES (INSIDE FRAME)
38 x 64 rnm ANGLE IRON FRAME 1.30 m INSIDE DIMENSION 12.5 mm ASBESTOS BOARD O N FLOOR (INSIDE FRAME) INSIDE INSIDE DlMENSl O N DIMENSION
Figure 1. 1.2-m comer-wall test compartment.
In this test, the walls, canopies, and ceiling of the test apparatus were lined with the material or system of materials under test, and the entire assembly was exposed to flames from a natural gas burner installed in the corner. The burner consisted of a horizontal sand bed of 220-mm diameter through which natural gas flowed to produce a diffusion flame. The fuel in- put to the burner was maintained constant at 33 kW for the duration of the test. By employing a large, repeatable source, a wide range of materials could be evaluated in terms of their relative ability to spread flame in a fully lined enclosure. In a real fire situation, however, the ignition source would probably be smaller so that the fire growth period, the period of interest in the present study, could be considerably longer.
The time required for flames to issue from beneath the canopy was the basic parameter on which the performance of an assembly was assessed. In the present study the temperatures of the gases and of the lining-insulation
88 Fire Technology
interface were also measured at the locations shown in Figure 2. The tests were terminated when the insulation was exposed or after a minimum of 10 min. Crumpled newspaper (page size 40 mm by 30 mm) was placed at three locations on the floor of the apparatus to serve as a rough indicator of the radiation level a t that surface. Work at NRCC showed that a flux level
greater than 1.6 W ~ m - ~ was required to ignite the paper. With a level of 2.0
W cm-l, the ignition time was 1.44 min with a variability of 53 percent, while at 2.5 W cm-*, the ignition time was 0.39 min, with a 17 percent variability.
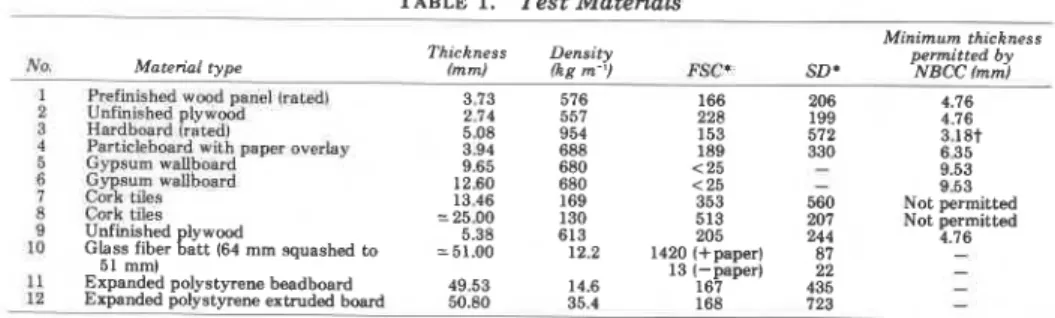
Table 1 lists the insulations and protective cover materials used in the
study. The linings were selected to represent a typical range of materials commonly used in combustible construction and were purchased from local retailers. The flame spread classifications (FSC) were obtained from 7.6-m tunnel testing in accordance with Underwriters' Laboratories of Canada
test standard ULC-S1O2 or S102.2-1978, as a p p r ~ p r i a t e . ~ . ' ~ I t should be
pointed out that the ULC-S1O2 tests were performed with the specimens in contact with the high density asbestos board lining of the tunnel lid, as re- quired by the standard. I t will be shown later that, for thermally thin specimens such as some of the linings under investigation, the introduction of a low density substrate can affect the fire performance of the specimen. The ULC-S102.2 standard is intended for flooring materials and materials that cannot be conveniently supported in the tunnel ceiling mount position. These include thermoplastics and loose-fill materials.
CEILING
LEFT WALL RIGHT WALL
THERMOCOUPLES 1 A N D 2, LOCATED 25 mrn BELOW CEILING, A N D THERMOCOUPLE 3, LOCATED 5 0 mrn BELOW DOORWAY, MEASURE GAS TEMPERATURES. REMAINING THERMOCOUPLES MEASURE LINING-INSULATION INTERFACE TEMPERATURES AT LOCATIONS SHOWN.
1
'
7
7
CANOPY
LI
5 o r n m - K \k
/ \Figure 2. Location of thermocouples.
x
/ \r
."
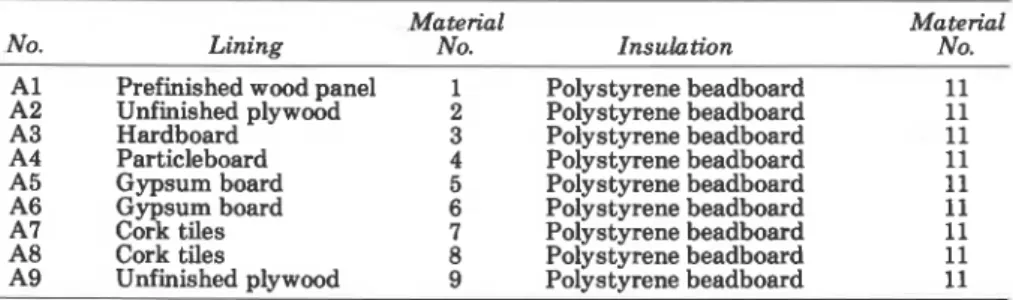
5 0 rnm CANOPY \ GAS BURNERPolystyrene Insulation 89 Two types of construction were evaluated, as shown in Figure 3. In the first, the wall and canopy components were glued to the asbestos substruc- ture using a general purpose foam adhesive. The ceiling components were
installed in a framework of pine wood studs, 19 mm by 50 mm each, placed
on 400-mm centers, and the framework was supported by screws through the ceiling substructure (see also Figure 3). For the second series, a wood framework, similarly supported by the substructures, was used throughout.
The series of tests, listed in Table 2, were designed to examine the effects
of construction and insulation type on performance of the linings.
FRAME SUPPORTED ASBESTOS M I LLBOARD
BY SCREWS
\\
I I
\
WOOD STUD FRAME
TEST SERIES A: CEILING COMPONENTS FASTENED MECHANICALLY; WALL A N D CANOPY COMPONENTS GLUED TOGETHER
ASBESTOS M I LLBOARD , /(12.5 mm)
N
PROTECTIVE COVERTEST SERIES B: ALL COMPONENTS FASTENED MECHANICALLY
T E S T R E S U L T S
Results are summarized in Tables 3, 4 and 5, while Table 6 gives the thermal properties of the types of materials used. A brief description of a typical sequence of events follows.
In experiments involving wood-based linings, ignition of the walls oc-
curred first, usually in the vicinity of the burner. The flames then prop- agated up the vertical corner and involved the entire ceiling surface before issuing from beneath the canopies (flashover). A short time later, the newspaper on the floor ignited, followed by pieces of the lining falling to the floor of the test structure, thus exposing the insulation to the fire. Exposure of expanded polystyrene was generally characterized by burning droplets of the molten material falling from the ceiling. The production of smoke was insignificant during the fire growth period, but increased substantially once the entire assembly was involved. This was especially true when the pro- tected insulation was polystyrene.
D I S C U S S I O N PERFORMANCE OF LININGS (TEST SERIES A AND C)
With the exception of cork tiles, the installation of any of the protective linings listed in Table 1 over polystyrene beadboard improved performance in terms of flame spread time in the corner, compared with that of the ex- posed foam. Gypsum board was regarded as best, as it limited flame prop- agation to within the enclosure and restricted gas temperatures at the ceil- ing center to 400" C. In contrast, all other linings spread flames beyond the canopy with varying degrees of rapidity, a process that was completed before the insulation was exposed. Mid-ceiling gas temperatures, in these cases, were over 700" C a t flashover. In general, the time taken for heat flux at floor level to reach a certain value and the time to flashover followed the same sequence of merit for the different materials.
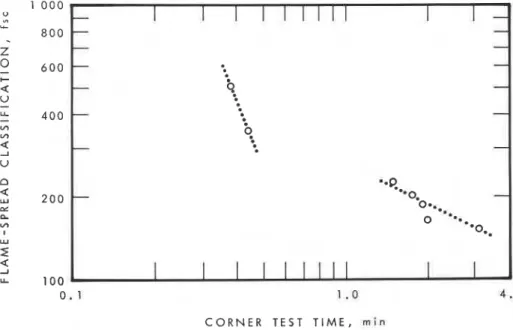
Figure 4 compares tunnel data with comer test performance for the cellulosic linings. As expected, the corner propagation times decreased with
TABLE 1. Test Materials
Minimum thickness Thickness Density permitted by
No, Material type lmml (kg m-'7 FSC* SD* NBCC fmm)
-
1 Refmishod woad panel Iratedl 3.73 576 166 206 4.16
2 Unfwrskd l y w d 2.74 557 228 199 4.76
3 Hardhood i!sred~ 5 nx 4.54 --. 1 5 1 --- 572 - .- ?
-.--.
I R +4 Varriclcbmrd ii;h paper o w b y 3.94 688 189 330 6.35
5 Cvpsum wallboard 9.65 680 < 25 - 9.53
5 G~pslum w ~ l l b r m d 12.60 680 < 25 - 9.53
7 Curk tiles 13.46 169 353 560 Not permitted
8 Cork tiles =25.00 130 513 207 Not permitted
8 Unfinished lywood 5.38 613 205 244 4.76
I U Glass fiber Eatt (64 mm smashed to =51.00 12.2 1420 ffnaoer) 87 -
51 mm) 13 (-paper) 22 -
11. Expanded polystyrene beadboard 49.53 14.6 167 435
-
12 Expanded polystyrene extruded board 50.80
- 35.4 168 723 -
*Flame spread and smoke developed data in accordance with ULC-S102lS102.2-1978 based on one test per materiaL Values shown for materials Nos. 7 and 8 are based on' the formula FSC = 28.2 dlt as explained in Reference 9.
t The 3 . 1 8 . ~ ~ thickness applies when a continuous backing, including'thermal insulation, is used. In other cases, the NBCC stipulates a nunlmum thckness of 6.35 for this material.
Polystyrene Insulation
TABLE 2. Test Details
Test Series A
Wall and canopy components glued t o each other and t o substructure. Ceiling components framed by 19-mm by 50-mm wood studs and supported mechanically. Studs placed on 400-mm centers.
No. Material No.
Prefinished wood panel Unfinished plywood Hardboard Particleboard Gypsum board Gypsum board Cork tiles Cork tiles Unfinished plywood Insulation Polystyrene beadboard Polystyrene beadboard Polystyrene beadboard Polystyrene beadboard Polystyrene beadboard Polystyrene beadboard Polystyrene beadboard Polystyrene beadboard Polystyrene beadboard Material No. Test Series B
All components framed by 19-mm by 50-mm wood studs and supported mechanically. Studs placed on 400-mm centers.
Material Material
No. Lining No. Insulation No.
B1 Prefinishe$wood panel 1
B2 Gypsum wallboard 5 B3 Refinished wood panel 1
B4 Gypsum wallboard 5 B5 Prefinishsd w& panel 1
B6 Gypsum wallboard 5 B7 Prefinished w m d anel 1 B8 Gypsum wallboar$ 5 Nit - Nil - Potys@mne bead- 11 Polystyrene beadboard 11
Glass fiber batt with paper 10
Ghsa fiber batt with paper 10
Extruded polystyrene board 12
Exttuded ooIvstvrene board 12
Test Series C
Single component only. No frames used.
No. Lining Material No. Method of attachment
11 Glued directly to substructure Glued directly to substructure
1 Mechanically fastened t o substructure
increasing flame spread classification of the surface material. Two separate regimes are evident because of the difference in thickness and the product
k e c (Table 6) between the cork and wood linings. I t is well known that the
time required for the surface of a semi-infinite solid to reach a given temperature, under the influence of a heat flux absorbed at the surface, is directly proportional to the produce kec of the solid. In the case of com- posite materials, it has been shown that, in a short duration test such as the comer test, the product kec of the surface layers exerts a strong influence on the outcome of the
The development of flame over the cork surface was very rapid and pro- ceeded mainly via the adhesive used in the manufacture of the tiles. The in- terface temperature data of Table 4 suggest that the unexposed surface of
these linings was not substantially involved during the brief flame-over period, so that, for the given tiles, the substrate was not a significant factor in the outcome of the tests.
The wood lining tests, on the other hand, were of considerably longer duration. Under these circumstances, the material immediately beneath the lining probably influenced test results, as will be demonstrated later. EFFECT OF TYPE OF CONSTRUCTION (TEST SERIES A AND B)
The tests showed that wood paneling over a stud frame construction was slightly more effective than gluing the protective lining directly to the foam. This was ascribed to the placement of the burner in the corner where the proximity of the studs lengthened the ignition time of the adjacent wall surfaces. Subsequent events proceeded a t approximately the same rate, as seen by comparing results of Tests A1 and B3. Gas and interface temperatures a t flashover were, essentially, the same for the two cases.
The performance of gypsum wallboard was unaffected by the construc- tion method. Maximum interface temperatures above the burner were iden- tical for Tests A5 and B4 despite large differences in exposure time. INFLUENCE OF INSULATION (TEST SERIES B AND C)
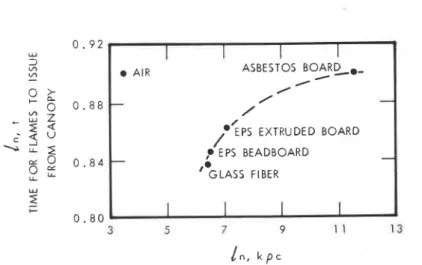
The influence of the substrate on the fire performance of a lining material can be seen from the results of Test Series B and C and the plot in Figure 5. The use of an asbestos millboard backing clearly increased the fire
CORNER T E S T TIME, m i n
Figure 4. Relationship between flame-spread classification of ceUulosic linings and comer test performance for protected polystyrene beadboard insulation-
Polystyrene Insulation 93
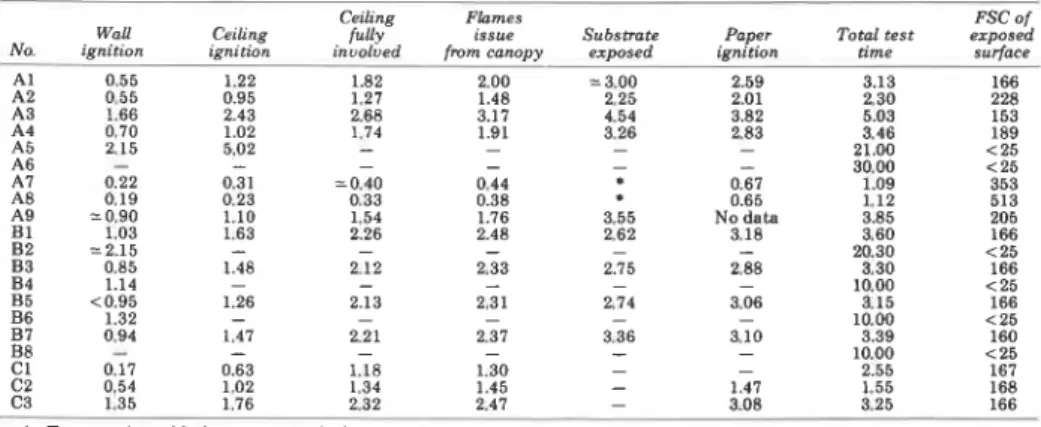
TABLE 3. Times Iminl to Reach Certain Events in 1.2-m Comer Tests
Ceiling Flomes FSC o f
WaU Ceiling f u u ~ issue Substmte Paper Total test ezposed No. ignition ignition inuolved from canopy exposed ignition time surface
A1 0.55 1.22 1.82 2.00 = 3.00 2.59 3.13 166 A2 0.55 0.95 1.27 1.48 2.25 2.01 2.30 228 A3 1.66 2.43 2.68 3.17 4.54 3.82 5.03 153 A4 0.10 1.02 1.14 3.46 189 - 1.91 - 3.26 - 2.83 - A5 2.15 - 5,02 - - - - - 21.00 < 25 A6 30.00 < 25 A1 0.22 0.31 = 0.40 0.44 0.61 1.09 353 A8 0,19 0.23 0.33 0.38 0.65 1.12 513 A9 =0,90 1.10 1.54 1.16 3.55 No data 3.85 205 B1 1.03 1.63 2.48 2.62 - 2.26 - - - 3.18 - 3.60 166 8 2 =2.15 20.30 < 25 8 3 0.85 1.48 2.12 2,33 3.30 166 - - - 2.75 - 2.88 - B4 1.14 10.00 < 25 B5 <0.95 1.26 - 2.13 3.15 166 - 2,31 - 2.74 - 3.06 - B6 1.32 10.00 c 25 B l 0.94 - 1.47 - 2.21 3.36 3.10 3.39 160 - 2.37 - - B8 - - - 10.00 < 25 C1 0.17 0.63 1.18 1.30 2.55 - 161 C2 0.54 1.02 1.34 1.45 1.41 1.55 168 - C3 - 1.35 1.16 2.32 -- 2.41 3.08 3.25 - - 166-
* Test terminated before event reached
- Event not reached
spread time of the prefinished wood panel compared with that obtained with thermal insulating materials. However, in the present tests, the influence of the individual insulations was less clearly distinguishable.
Glass fiber insulation, with the lowest kec, produced the highest temperatures and a marginally shorter propagation time. However, it did
not contribute as much combustible when exposed to the fire, as in the two
tests with EPS. The unusual results obtained with no immediate substrate
present was ascribed to convective air currents within the cavities behind
the exposed material.
The performance of 9.65-mm gypsum wallboard was unaffected by the type of insulation used.
THERMAL RESISTANCE ASSESSMENT FROM THE CORNER TEST
In an earlier investigation of plastic foams protected by 9.5-mm gypsum
board, Liet2 found that interface temperatures above an 88
k W
burner in a2.4-m corner test were almost identical to those recorded at the interface of
a composite specimen exposed to the standard temperature-time conditions
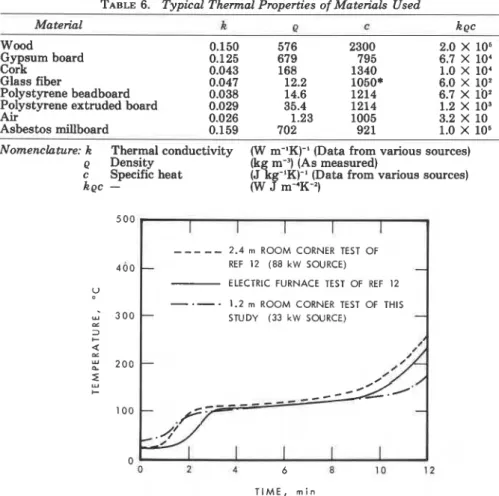
in an electric furnace. Figure 6 compares temperatures from Test A5 of the present study with those from Lie. Evidently the ignition source in the pres- ent test provides more severe exposure during the initial 1.50 min than either of the other methods. Performance over the next 8.50 min closely followed the furnace-generated profile.
Table 5 lists times at which interface temperatures at two locations in the 1.2-m corner first exceeded 160" C. Assuming these measurements in- dicate the thermal protection provided by the covering material, it was con- sidered unlikely that any of the wood linings examined would provide the same degree of thermal protection in combustible construction as that specified in the Canadian Code for noncombustible construction. I t must be emphasized, however, that, in several cases, flames spread beyond the limits of the apparatus before the temperature criterion was reached. Visual observations indicated that the expanded polystyrene contributed
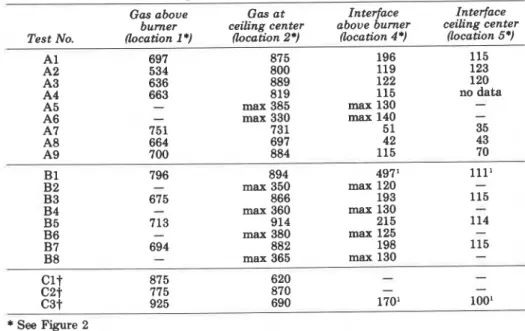
TABLE 4. Gas and Lining-Insulation Interface Temperatures, "C, at Flashover Gas above Gas at
In
ter6ace
Interface burner ceiling center above umer ceiling center Test No. (location 1 *) (location 2.) (location 4") (location 5")196 115 119 123 122 120 115 no data - 894 497' 111' max 350 max 120 - 866 193 115 max 360 max 130 - 914 215 114 max 380 max 125 - 882 198 115 max 365 max 130 - 620 - - 870 - - 690 170' 100'
*
See Figure 2t Temperatures are approximate
'
"Interface" temperature refers to the temperature of the unexposed surface of the lining TABLE 5. Corn~aPison o f Performance: Flammability vs. "Thermal Protection"Test No.
Time when flames issue beneath canopy
(min)
Time when interface temperature
exceeds 160°C (min) Total test time Above burner Ceiling center (min)
2.42 11.37 Barely reached
*
C l 1.30 t t 2.55 C2 1.45 t t 1.55 I C3 2.47 2.35' 3.03' 3.25*
Condition not reached before test terminated'
"Interface" temperature refers to the temperature of the unexposed surface of the lining t Single component, no interfacePolystyrene Insulation
I
AIR ASBESTOS BOARD-,-
0 I -0
-
- / *<Ps EXTRUDED BOARD/
,? EPS BEADBOARD --
I*I
GLASS FIBERFigure 5. Effect of k ~ c of substrate on performance of protective wood panel lining in 1.2-m
comer test.
In contrast, it was regarded probable that the gypsum wallboard covers would easily meet the desired thermal resistance conditions. With the 9.65-mm board, temperatures above the burner location topped 160" C a t 11.37 min, for the glued assembly only. In that particular case, burning polystyrene was noted behind the protection when the walls were breached a t the end of the test.
C O N C L U S I O N S
The experiments just described showed that, in terms of flame spread along the surface of walls and ceilings to the extremities of a room corner configuration, some advantages were to be gained by protecting polystyrene foam with a cover having a flame spread classification below 150, as measured by the 7.6-m tunnel test.
In the case of gypsum wallboard (12.7- and 9.5-mm nominal thickness), these benefits were substantial as the material provided thermal protection and reduced the rate of flame progression. With 9.5-mm board, however, the EPS could be expected, eventually, to ignite and burn behind the cover under sustained heating.
By comparison, wood panel linings usually considered acceptable for use in buildings of combustible construction did not provide the same degree of thermal protection. However, compared to unprotected foam, these linings effectively increased the time to flashover in the corner test and delayed the contribution of combustible by the insulation to the fire.
The use of protected polystyrene will not normally result in an increase in hazard during the fire growth period compared with that of similarly pro- tected, conventional insulations such as glass fiber. If the post-flashover
period is also of consequence, the wood panel linings will not prevent large- scale involvement of the combustible insulation.
TABLE 6. Typical Thermal Properties of Materials Used
Material k w c koc Wood 0.150 Gy sum board c o g 0.125 0.043 Glass fiber 0.047 Polystyrene beadboard 0.038 Polystyrene extruded board 0.029
Air 0.026
Asbestos millboard 0.159
Nomenclature: k Thermal conductivity
Q Density c Specific heat k ~ c - 576 2300 2.0 X lo6 679 795 6.7
x lo'
168 1340 1.0 xlo'
12.2 1050* 6.0 X lo1 14.6 1214 6.7 X loZ 35.4 1214 1.2x
lo3 1.23 1005 3.2 X 10 702 921 1.0 Xlo6
(W m-'K)-' (Data from various sources)
m-') (As measured)
-lK)-' (D ata from various sources) (W
.f
m - 4 ~ - 2 )I I
-
-
--
-
2.4 m ROOM CORNER TEST OFREF 12 (88 kW SOURCE) -
ELECTRIC FURNACE TEST OF REF 12
-.-.
1.2 m ROOM CORNER TEST OF THIS- STUDY (33 kW SOURCE)
-
I / - - T I M E , m i nFigure 6. Comparison of interface temperatures (hottest spot) from three different fire tests (insulation: 5@mm polystyrene beadboard; protective covering: 9.5-mm, nomznal gypsum
wallboard).
R E F E R E N C E S
'
"Standard Method of Test for Surface Burnin Characteristics of Building Materials," Underwriters' Laboratories of Canada, ~ c a r b o r o u ~ i , Ontario. ULC-,9102-1978.2"Cell~lar Plastic Products," Federal Register, Vol. 40, No. 142 (July 23, 1975), p. FR
.?OR42
---
"Standard Methods of Fire Endurance Tests of Building Construction and Materials," Underwriters' Laboratories of Canada, Scarborough, Ontario, ULC-S101-1971.
'Ryan, J. E., National Forest Products Association, Hohokus. New Jersey, Private Com- municahon.
'
"Ex anded Polystyrene in Building Des' n Fire Information," Expanded Pol styrene Product Ranufacturers Association. c o m p i l fby^.
Aston, 1 Keymer Road,as so cis,
West Sussex. June 1976.Polystyrene Insulation 97 "Foamed Polystyrene for Construction," Factory Mutual System, Loss Prevention Data, Division 1, Section 58, June 1978.
'
Hilado, C. J., Flammability Handbook for Plastics, Technomic Publishing Co., Stamford, Conn. (1969), p. 39."Standard Corner Wall Method of Test for Flammability Characteristics of Non-melting Building Materials," Underwriters' Laboratories of Canada, Scarborough, Ontario. ULC-S127-1978.
9D'Souza, M. V. and J. H. McGuire, "ASTM-E84 and the Flammability of Foamed Thermosetting Plastics," Fire Technology, Vol. 13, No. 2 (May 1977).
.
85-94.l o "Standard Method of Test for Surface Burning Characteristics of frooring, Floor Cover-
ing and Miscellaneous Materials," Underwriters' Laboratories of Canada. Scarboroueh. On- - .
tario, ULC-S102.2-1978.
" McGuire, J. H. and M. V. D'Souza, "Flammability Merit Sequence and Specimen
Homogeneity," Fire Technolog Vol. 14, No. 4 (November 1978), pp. 273-278.
l2 Lie. T. T.. "contribution o r ~ r o t e c t e d Plastic Foams t o Fire Growth," National Research
Council of Canada, Division of Building Research, Fire Study No. 37 (September 1975).
ACKNOWLEDGMENTS: The authors wish t o thank A. Babcock, A. J. Melanson and D. W. Carpenter for their assistance in running the tests and anal zing the data. This aper is a con- tribution from the Division of Buildink Research, ~ a t i o n a l k e s e a r c h Council of Eanada and is published with the approval of the Dlrector of the Division.
This publication is being distributed by the Division of Build- ing Research of the National Research Council of Canada. I t should not be reproduced in whole or in part without permis- sion of the original publisher. The Division would be glad to be of assistance in obtaining such permission.
Publications of the Division may be obtained by mailing the appropriate remittance (a Bank, Express, or Post Office Money Order, or a cheque, made payable to the Receiver General of Canada, credit NRC) to the National Research Council of Canada, Ottawa. KIA 0R6. Stamps are not acceptable.
A list of all publications of the Division is available and may be obtained from the Publications Section, Division of Build- ing Research, National Research Council of Canada, Ottawa.