of a
Submitted to the Department of Mechanical in Partial Fulfillment of the Requirements for
Engineering the Degree of
MASTER OF SCIENCE in Mechanical Engineering
at the
MASSACHUSETTS INSTITUTE OF TECHNOLOGY
FEBRUARY 1997
@ 1997 Massachuqetts/ stitute of Technology. All rights reserved.
Signature of Author: .
Department of Mechanical Engineering December 22, 1996
Certified by: ... "€"E ... . ... ... ... ... David Wallace Assistant Professor, Mechanical Engineering Thesis Supervisor
Ain A. Sonin Chairman, Department Committee
MASSACHUSETTS INSTITUTE
OF TECHNOLOGY
OCT
2
7 1999
LIBRARIES
Window Shading System
by
Ashley Cross Wodtke B.A. History Brown University, 1991 Accepted by: MASSACHUSETTS INSTITUTE OF TECHNOLOGY UIBRARIES
DESIGN AND MANUFACTURING ANALYSIS OF A
WINDOW SHADING SYSTEM
by
Ashley Cross Wodtke
Submitted to the Department of Mechanical Engineering on January 20, 1997 in partial fulfillment of the requirements
for the Degree of Master of Science at the Massachusetts Institute of Technology
ABSTRACT
In this thesis a novel concept for a window shading system was proposed and developed. This concept was created to address issues with an existing Lutron Electronics product. Over the past year and a half, concepts have been generated, tested and refined to produce a fully functional working prototype that meets the product specifications. This thesis focuses upon a manufacturing cost analysis and redesign of a gearbox assembly for the window shading system. This is a logical next step in the product's development.
An estimate for the assembly time for the current version of the gearbox assembly is found. The parts are then redesigned for improved
assembly time, and hence reduced cost. The parts are also redesigned for mass production processes; injection molding, and die casting. Calculating and then comparing cost estimates for the two processes finds an injection molded integrated design the most cost effective.
Thesis Supervisor: Professor David Wallace Mechanical Engineering
I would like to express my thanks and appreciation to several people without whom this work, and my masters program, would not have been possible.
First of all I would like to thank my advisor, David Wallace. He has taught me, through his personal example, the importance of high standards, and the dedication it takes to meet them. His love for education and teaching is a model for us all.
Woodie Flowers was instrumental in my joining the masters program. At the beginning of my switch to engineering, his words of encouragement stood out from the skeptical voices, and continued to provide me with reassurance long after they were said.
At the very beginning, Samuel Ting gave me the opportunity to pursue my interest in engineering. He generously gave me both financial and moral support to take undergraduate classes at MIT while I was working for him.
The Martins have long been generous supporters of MIT and the mechanical engineering department. I too benefited from their generosity through the Martin Fellowship which has supported me throughout the Master's program.
Lutron Electronics, and its President, Joel Spira, have been actively involved with MIT and have provided me with this exciting project. They have been extremely helpful throughout, and it has been a pleasure working with them over the past two years.
Finally I would like to thank past and present members of the CADlab, for making life at MIT fun.
Section Page
Acknowledgments
3
Table of Contents
5
List of Figures
7
1 Introduction
8
2 Product Background
9
2.1 History of the Vista Project 2.2 The Current Vista Design 2.3 Conclusions
3 Product Specifications
20
3.1 Structural Analysis 3.2 Tolerance Analysis 3.3 Conclusions
4 Product Redesign for Manufacturing
31
4.1 Description of Current Fabrication Process 4.2 Evaluation of the Current Process
4.3 Redesigning the Gearbox for Injection Molding and Die Casting 4.4 Conclusions
5 Product Redesign for Assembly
34
5.1 Analysis of Current Assembly Process
5.2 Applying the Design for Assembly Guidelines 5.3 Conclusions
6 Cost Analysis of the Redesigns
42
6.1 Calculating the Assembly Costs
6.2 Calculating the Injection Molding Manufacturing Costs 6.3 Calculating the Die Casting Manufacturing Costs
7 Conclusions
8 References
9 Appendices
LIST OF FIGURES
Figure Page
2.2.2.1 Exploded View of Gearbox Assembly 13
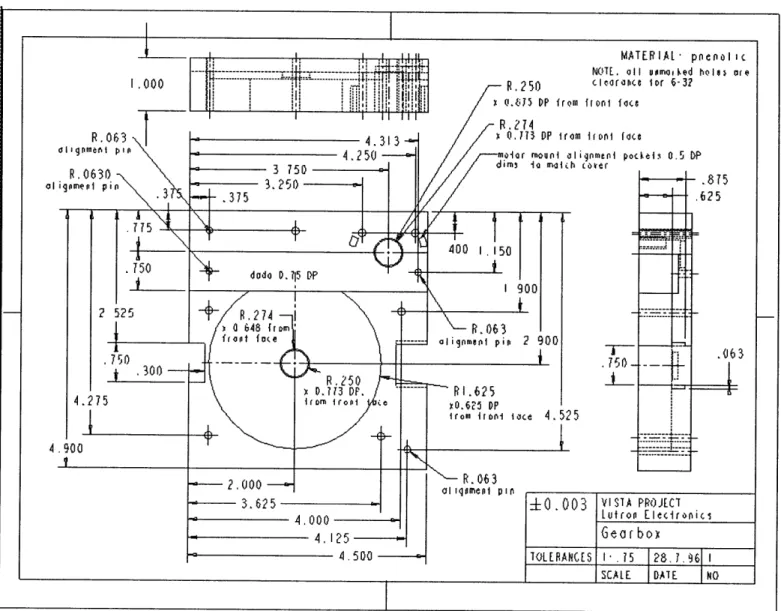
2.2.2.2 Gearbox Drawing 14
2.2.2.3 Gearbox Perspective Drawing 15
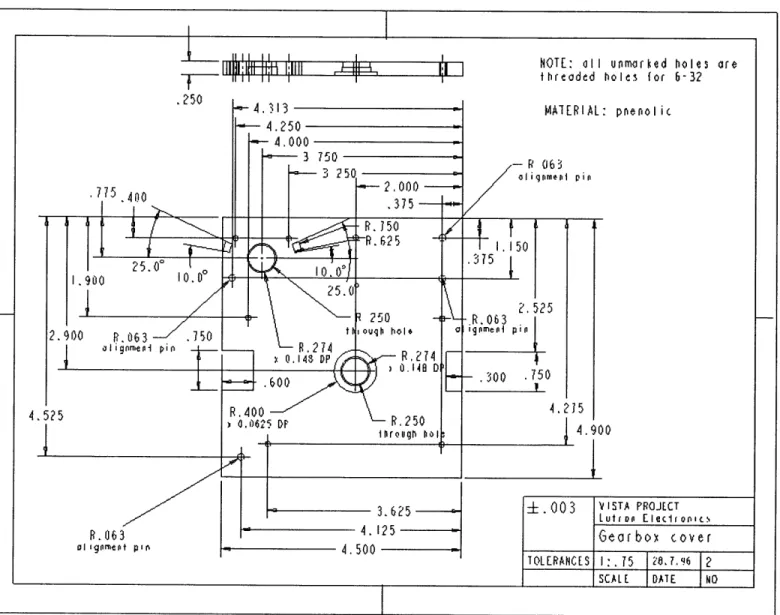
2.2.2.4 Gearbox Cover Drawing 16
2.2.2.5 Motormount Drawing 17
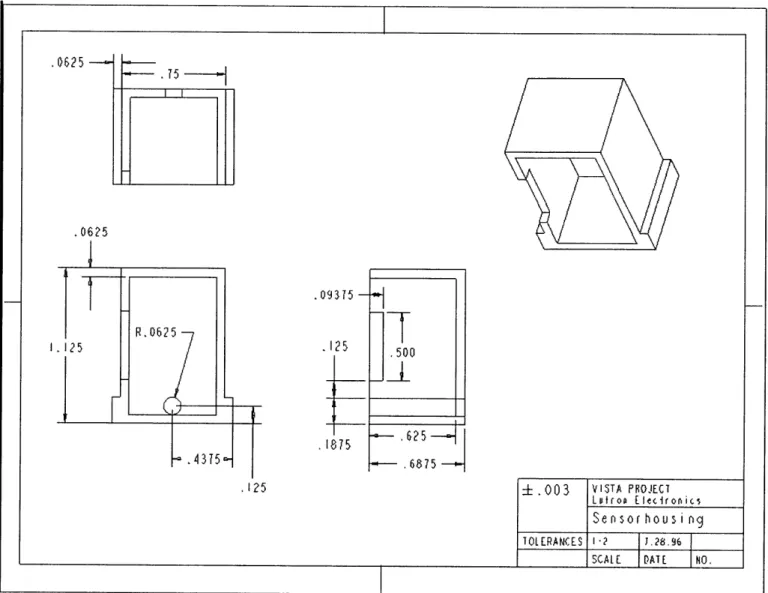
2.2.2.6 Sensorhousing Drawing 18
3.1.1.1 Gear Configuration for Double Worm Concept 21
3.1.2.1 Bearing B2 in Gearbox Cover 22
3.1.3.1 Views of Global Model of Gearbox Cover 23
3.1.4.1 Views of Local Model of Gearbox Cover 26
3.2.1 Critical Y-axis Tolerances on the Gearbox 29
5.2.1.1 Design A for Injection Molding Process 37
5.2.1.2 Design A for Die Casting Process 38
5.2.1.3 Design B for Injection Molding Process 39
CHAPTER
I
INTRODUCTION
As part of a product development project, this thesis applies cost reduction techniques for manufacturing to a gearbox assembly of an
automated window shading system. The product in question has progressed from a mental concept to a functioning prototype, and has now reached the manufacturing stage. In the book, Product Design for Manufacture and Assembly, [1] Boothroyd and Dewhurst present systematic procedures for reducing the costs of manufacturing a product. First it gives a method for calculating the assembly costs and provides guidelines for part redesign to reduce assembly time. Next it provides procedures for making first order calculations of manufacturing costs for various processes, and in particular for die casting and injection molding. The assembly and manufacturing costs will be calculated for our gearbox.
Chapter 2 provides a background of the product's development, leading up to its present state as a working prototype. The product's structural and tolerance requirements needed for subsequent manufacturing analysis are assessed in chapter 3. Subsequently, chapter 4 examines the current machined gearbox and a gives a rationale that injection molding and die casting will be more cost effective methods for manufacture. The product is then redesigned for these processes. A 'Design for Assembly' analysis of the current gearbox is made in chapter 5. The product is then redesigned for improved cost
reduction, and two design alternatives are provided. Drawings of the gearbox redesigned for assembly and manufacturing are given at the end of this
chapter. Chapter 6 performs the assembly and manufacturing cost calculations for injection molding and die casting of the new gearbox assembly. It compares the overall costs for manufacturing 100,000 gearbox assemblies. It concludes that an integrated injection molded design of the gearbox assembly will be the most cost effective solution.
m
PRODUCT BACKGROUND
The purpose of this chapter is to provide a background of the Vista design project. This will give the reader an understanding of what the main concerns are, specific to the window shading system.
2.1 HISTORY OF VISTA PROJECT
Two years ago, Lutron Electronics, a company that specializes in interior environment lighting control, brought in a group from MIT to develop concepts for the next generation of their Serena product, an
automated window shading system. The MIT team is made up of Professor David Wallace, Chun-ho Kang, and Ashley Wodtke. The project was launched in the Summer of 1995.
During the initial months, we evaluated the current system and
developed high level goals for the redesign. Using the concept generation and selection techniques laid out in Product Design and Development [2] three concepts were chosen. The MIT team then made functional prototypes and presented then to the management at the end of the summer. During subsequent work at MIT, the designs have been refined and gone through several iterations.
2.1.1 Description of Serena
Serena, one of Lutron's current products, is an automated window shading system. It offers up to four shading alternatives for one window. With a simple push of a button, the user can alter his room environment. He can choose a variety of window coverings: a sunscreen which filters the light, a complete sunblock, a 'stained glass' image, a clerestory that covers only the bottom half of the window, and a completely open scene. These options are available for each single window unit. The product has a 'magic' quality when it is operated. As a result it looks glamorous and expensive. This high end product is most commonly used to cover large windows in sunny
environments such as California and Arizona for example.
The Serena product had been on the market for several years when the Vista project was started in the summer of 1995. Lutron was concerned that the product might need improvement and redesign to reduce cost.
Some of the primary concerns were:
On the aesthetic side, the volume of the product was too large. Bulky roller units were placed at the top of the window as well as at the foot of the window or resting on the window sill. Users found the bottom unit in particular to be unsightly and undesirable.
The installation of the current Serena was proving to be very difficult and expensive. Installing a Serena product required several skilled
professionals; a carpenter needed to build the top and bottom roller brackets into the existing walls and an electrician was needed to wire Serena. In addition a Lutron person was usually sent on site to solve the tracking problems. Installing and leveling the top and bottom roller brackets to each other proved to be very difficult, and also absolutely necessary for the
working of the product.
The most pressing issue for Lutron was the cost. Lutron wanted the new generation of Serena - called Vista - to a tenth of the price.
2.1.2 Project Goals
At the beginning of the project, the MIT team set goals that we wanted to achieve in our Serena redesign. table 2.1.2.1.
High Level Goals
High level Goals
lay installation
minimize obtrusiveness cost: to be 10% of original cost control natural lighting change interior environment accommodate largest size windows ability to slave rollers
sell to mass market (get into Home Depot) adaptable to all types of windows
accommodate opening variability flexible mass customization factor of magic
customizable position control high aesthetic value
remodelability
out a list of high level These are listed in
interior environment and control natural lighting. Since Vista is a visual product, the aesthetic issues were considered high priority. The 'magic' feeling Serena evoked should be translated into Vista. At the same time, the
enclosed feeling of Serena should be minimized if possible. To address the obtrusiveness of the volume, it was decided that the bottom roller diameter should be reduced or eliminated.
Since an objective of the project was to change the interior
environment with a minimum amount of intrusion into the user's daily life, noise was also an important issue for Vista.
The MIT team wanted to design the Vista product to be flexible. It should accommodate many types of windows with a variety of opening mechanisms. The user should be able to customize the product according to his tastes; Vista would have 'remodelability'. In other words, the cloth could be changed, without having to disassemble the unit, as is currently required with Serena. The option of slaving the rollers together would be provided so several windows could be controlled by one switch.
Reducing the cost was the most important issue for Lutron. In order to achieve the desired reduction, costs would have to be minimized on all fronts. This would require radically changing the current Serena design.
2.2 THE CURRENT VISTA DESIGN
After the three month testing period at the end of the summer, there were three contending concepts. Since each concept was strong and addressed a different market, we decided to continue developing them all. The floating loop has a strong magic quality, and is arguably more spectacular than Serena. This concept appeals to high end users. The second concept, the nested rollers, is similar to the floating loop except the floating bar is attached at the bottom. This concept is easier to understand for the user, and again it targets a high end market. Finally the gang concept uses the single motorized window shade and stacks them on top of each other to create a multiple shade option for one window. This concept targets the Home Depot market and is simple and understandable.
The new Vista product has been designed for simple installation. The bottom roller has been eliminated so only one roller bracket has to be
installed, and the alignment between bottom and top rollers is no longer an issue. The cloth rollers can be snapped into their brackets by the user and the actuation and position control is contained in one unit located at one end of the roller. This unit, the gearbox assembly, is mounted to the wall's exterior face. All these features make it easy for a homeowner to install Vista.
A product platform has been built where each concept uses the same basic hardware but the cloth and control system are configured differently. The basic hardware is contained in one unit, and consists of; the motor, its
gearbox and braking system, and sensors for position control. This unit has been made stackable and can be used on its own for a single roller or it can be stacked to create the floating loop, the nested rollers, or the gang concept.
2.2.2. Detailed Gearbox Assembly Description
Figures 2.2.2.1 to 2.2.2.6 show drawings of the current gearbox assembly. The shafts, bearings, and gears are not shown.
The gears are enclosed within the box which reduces noise. The current design is CNC machined out of phenolic. This material provides noise
insulation and robust structural characteristics.
Inside the gearbox, two inserts are placed to contain the inside shaft. They are necessary for assembly purposes as well as improving the alignment of the two gear sets. The sensorhousing is fitted into the side of the gearbox. The motormount is fixed onto the gearbox cover and provides alignment between the motor shaft and shaft A.
-- 0.003 VISTA PROJECT LutrDf EleCiron l. Georbox TOLERANCES I' 15 28. 7.96 SCALE DATE NO I
I
Figure 2.2.2.4 Gearbox Cover Drawing
... till II I I
f
llll:11 t r 1:IIII lil INOTE: all unmarked holes are
threaded holes for 6-32
3.
6?5
R.063 4. 125 al gnmept pi. 4.500 pnenol ic I 0003 VISTA PROJECT Lutrop Eleclronics Georfbo cover TOLERANCES 1:.5 287.96 2 SCALE DATE NO I · 1111 11 I I I IVISTA PROJECI
Lutron Electronics
Motormount
1:1
8
12 9ý
6
SCALE IDATE IND
.125 *ý7$
TOLE00P3
2.3 CONCLUSIONS
Vista's development has progressed significantly over the past year and a half. The initial concepts have been translated into physical models. These have been refined over the months to produce a working prototype that operates according to our specifications. It is at this point in the product development, when manufacturing issues become more significant. Before looking at manufacturing options, it is necessary to set out the product requirements that need to be met.
CHAPTER 3
PRODUCT SPECIFICATIONS
Redesign for assembly and manufacturing may ask for fundamental geometry changes. However changes that are made should not compromise required specifications. For our product, structure, noise, efficiency, and size goals need to be met. Tight tolerances will result in reduced noise[3],
increased efficiency and longer gear lifetime.
3.1 STRUCTURAL ANALYSIS
Before
is necessary.
calculated by
materials can be considered a knowledge of the forces involved A load analysis on the gears, shafts and bearings has been
Chun-ho Kang.
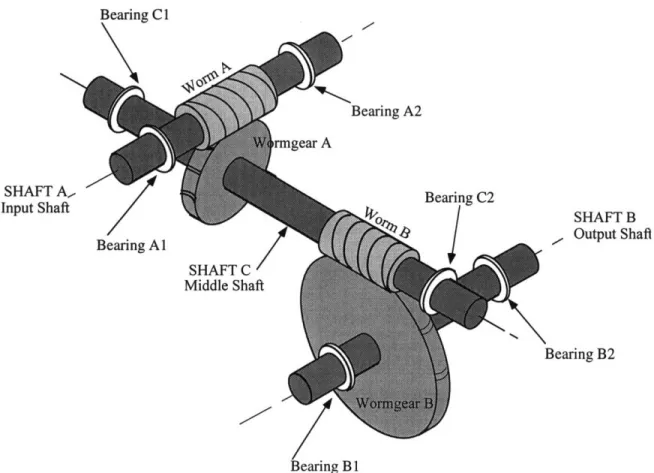
Figure 3.1.1.1 shows the double worm configuration for the gearbox. Bearing C1 -mgear A SHAFT A., Input Shaft Bearing A2 Bearing C:2 SHAFT B . Output Shaft Bearing B2 Bearing B
Figure 3.1.1.1 Gealr Configuration for Double Worm Concept
The motor drives shaft A, the input shaft. Worm A then transmits
movement to the middle shaft, or shaft C. Worm B on the middle shaft then
rotates shaft B. The roller shade is attached to shaft B which is the output shaft. The specifications of the motor are shown below in table 3.1.1.1.
Table 3.1.1.1 Motor Characteristics
Voltage Resistance Torque Motor Torque Power
(volts) (ohms) Constant Speed (oz-in) (hp)
(oz-in/A) (krpm) 12 3.69 3.31 3.43 3.244 0.011 24 3.69 3.31 8.33 3.244 0.027 1 SHAFT C ' Middle Shaft
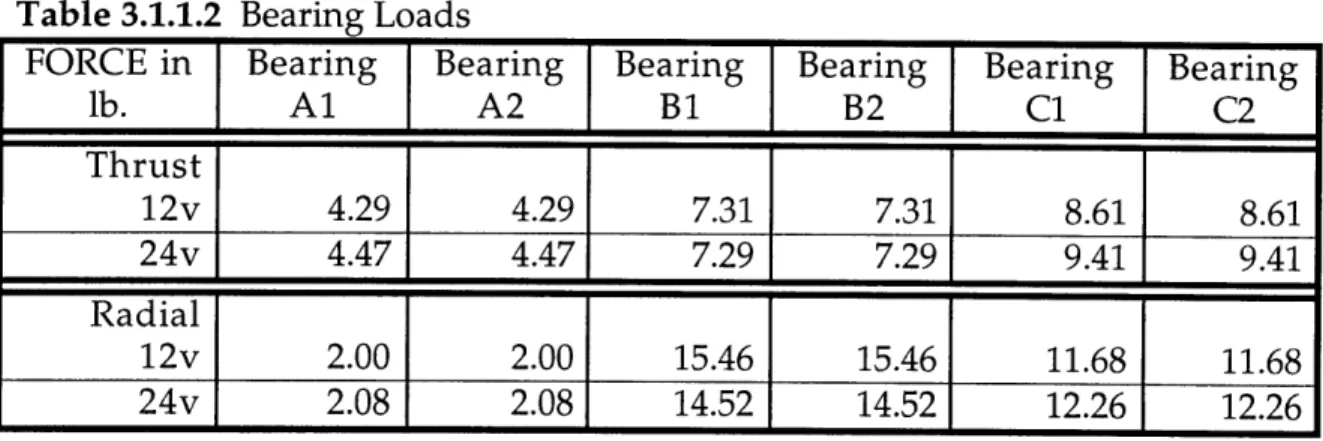
Using the gear assembly drawing as a reference for bearing location, the maximum thrust and radial forces on each bearing have been calculated and are shown in table 3.1.1.2.
3.1.2 Modeling the Gearbox
To get an approximation of the stress and deflections involved, we can model typical material behavior by looking at bearing B2's surrounding geometry. Bearing B2 is embedded in the gearbox cover, shown in figure 3.1.2.1. Since all the bearings are similarly configured in the gearbox,
modeling the behavior of B2 will help us understand the material behavior throughout the gearbox.
By modeling the bearing B2 forces both globally and locally, we will get information on the worst-case scenarios.
Figure 3.1.2.1 Bearing B2 in Gearbox Cover
The following analysis was used to give approximate values for deflections and stresses in the gearbox cover.
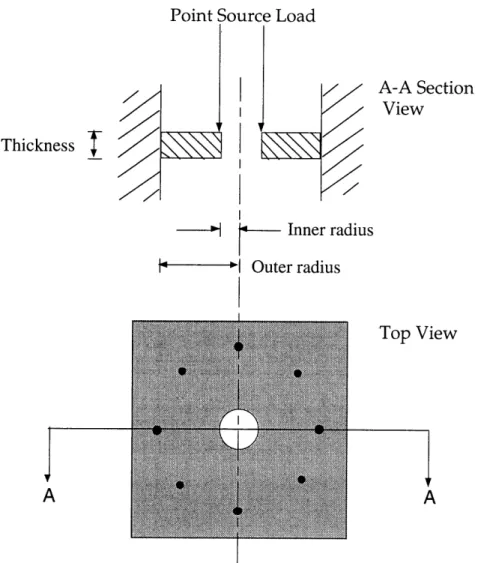
Since the cover is pinned to the gearbox, in a roughly circular fashion around the worm gear B, we can model it as roughly a circular plate, fixed at the sides, with a point source around the bearing seat edge. Figure 3.1.3.1 shows a section view and a top view of the gearbox cover.
Figure 3.1.3.1 Views of Global Model of Gearbox Cover
Point Source Load
Thickness T A-A Section View 7-Inner radius I
-
I Outer radius A Top View AThe equation for the maximum deflection [4] is,
Pr2 Ym = KEt 3
Er" (equation 3.1.3.1)
Where ym= maximum deflection (inches) P = point source load
Ki= constant from table (found from R/r) r = inner radius
E = modulus of elasticity t = thickness
Taking the largest thrust load and various thicknesses the results are shown in table 3.1.3.1 given the following values,
P = 9.41 lbs KI= 0.25 r = 0.25 inch
t = .25", 0.125", and 0.0625"
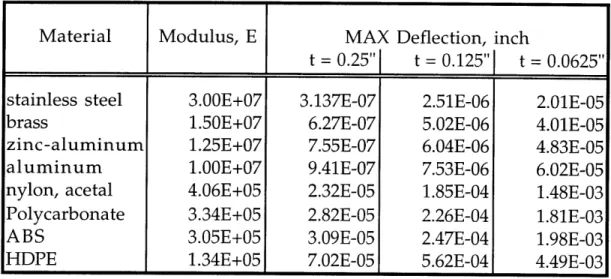
A variety of materials, with differing mechanical properties has been selected for comparison [5]. Deflection results are shown in table 3.1.3.1.
Table 3.1.3.1 Calculation of Maximum Deflection for Various Materials
Material Modulus, E MAX Deflection, inch
t = 0.25"
t = 0.125"
t = 0.0625"
stainless steel 3.00E+07 3.137E-07 2.51E-06 2.01E-05brass 1.50E+07 6.27E-07 5.02E-06 4.01E-05
zinc-aluminum 1.25E+07 7.55E-07 6.04E-06 4.83E-05
aluminum 1.00E+07 9.41E-07 7.53E-06 6.02E-05
nylon, acetal 4.06E+05 2.32E-05 1.85E-04 1.48E-03
Polycarbonate 3.34E+05 2.82E-05 2.26E-04 1.81E-03
ABS 3.05E+05 3.09E-05 2.47E-04 1.98E-03
HDPE 1.34E+05 7.02E-05 5.62E-04 4.49E-03
Since the tolerance for gear placement is + 0.001" as shown later in the chapter, the value 0.0002" has been taken as a conservative deflection limit. Given this, when the thickness of the cover is .25", any material is acceptable. When t = 0.125", a polycarbonate would be borderline, and nylon and all the metals would be acceptable. For a thickness of t = 0.0625 only the metals are
acceptable. The results are reasonable provided the maximum stress is within the elastic regions of the materials.
P
Sm
-t
2 (3.1.3.2)Where Sm = maximum stress (lbs/in2)
K = constant II (derived from table using R/r) P= point source load (lbs)
t = thickness (in)
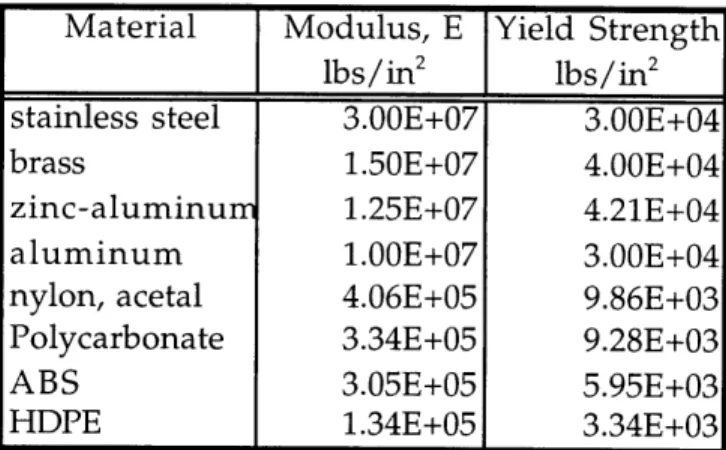
Again taking the maximum load = 9.41 lbs and K for various thicknesses are shown in table 3.1.3.2. are the yield strengths of our material selection.
= 2.5, the maximum stresses Alongside the stress values
Table 3.1.3.2 Calculation of Maximum Stress for
Yield Strengths.
Various Materials with their
To prevent plastic deformation, let us create a safety limit that the maximum stress should not be more than 80% of the yield strength. Given this, at a thickness .25" and 0.125" all materials are possible. At t = 0.0625 ABS and HDPE would not be acceptable.
Thickness MAX Stress lbs/in2
t = 0.25" 3.76E+02 t = 0.125" 1.51E+03 t = 0.0625" 6.02E+03
3.1.4 Local Deflection and Stress Calculations for Thrust Loads
If we conservatively assume that the thrust force is concentrated on the bearing seat where the bearing sits, we can approximate worst case
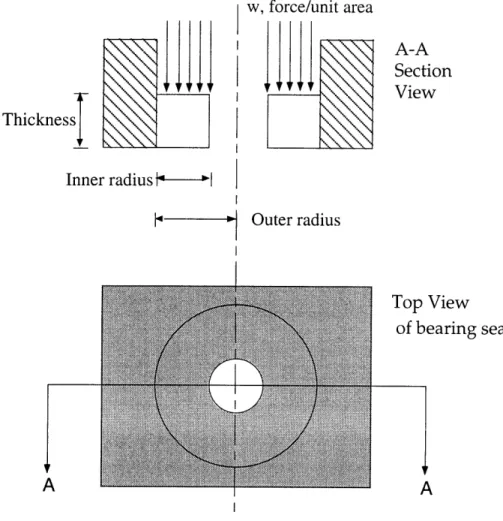
magnitudes for local deflection and stress. We can model the local area as a circular plate with fixed edges, having a distributed load, w, as shown in figure 3.1.4.1.
Figure 3.1.4.1 Views of Local Model of Gearbox Cover I w, force/unit area
~UI4
.>~
A-A Section View Thickness Inner radius1-
" Outer radius Top View of bearing seatA
The equation for deflection is given by: 4
wr
,, = K t3
Where ym= maximum deflection (inches) KI= constant from table (found from R/r) w = distributed load
(3.1.4.1)
A
~ -,
r = inner radius
E = Modulus of elasticity t = thickness
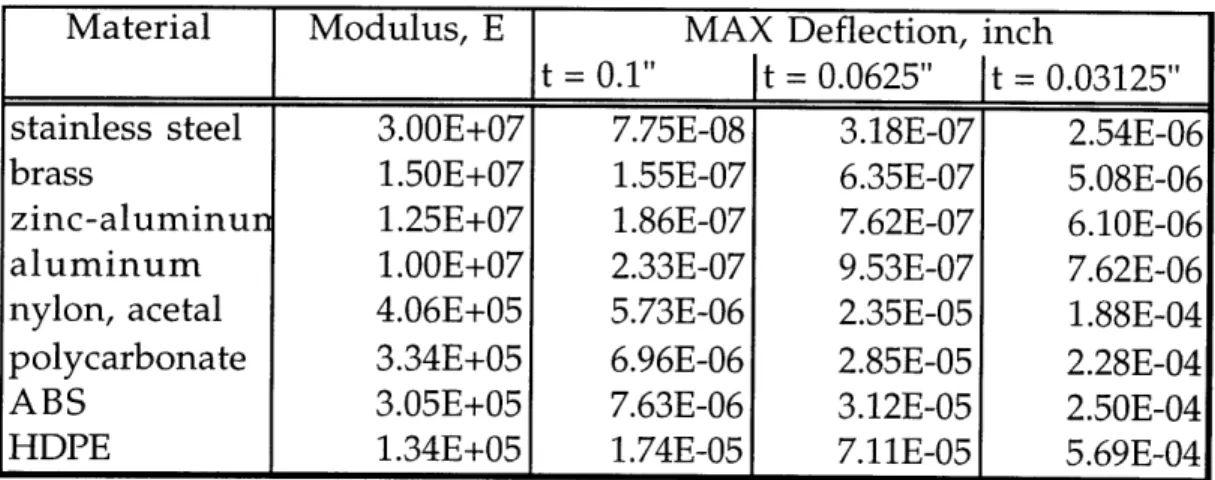
For a load of 9.41 lbs, an inner radius of .25 inches, an outer radius of .274 inches, w = 238.18 lbs/in2. Given that t = 0.102 " and K1 = 0.0025 the maximum deflection values are shown in table 3.1.4.1.
Table 3.1.4.1 Calculation of Maximum Deflection for Various Materials
Material Modulus, E MAX Deflection, inch
t = 0.1" It = 0.0625" It = 0.03125" stainless steel 3.00E+07 7.75E-08 3.18E-07 2.54E-06
brass 1.50E+07 1.55E-07 6.35E-07 5.08E-06
zinc-aluminun 1.25E+07 1.86E-07 7.62E-07 6.10E-06
aluminum 1.00E+07 2.33E-07 9.53E-07 7.62E-06
nylon, acetal 4.06E+05 5.73E-06 2.35E-05 1.88E-04
polycarbonate 3.34E+05 6.96E-06 2.85E-05 2.28E-04
ABS 3.05E+05 7.63E-06 3.12E-05 2.50E-04
HDPE 1.34E+05 1.74E-05 7.11E-05 5.69E-04
In the local case, thicknesses of 0.1", 0.0625", 0.03125" have been chosen. In this case, the thickness of the seat, will be a percentage of the thickness of the gearbox cover and so the values are smaller. Taking our maximum allowable deflection as .0002", we see that for t = 0.1 and t = 0.0625 all materials are acceptable. For the very thin t = 0.03125, nylon and all the metals would be acceptable.
For maximum stress due to the thrust force the equation is:
2
wr
S =K
m t 2 (3.1.4.2)Where Sm = maximum stress (lbs/in2)
K = constant II (derived from table using R/r) w = load/unit area (lbs/in2)
t = thickness (inches)
For the previous thicknesses, and for K= 0.105 and w = 238.18 lbs/in2, the calculations for the maximum stress are found in table 3.1.4.2. the yield strengths for our material selection are shown alongside.
Table 3.1.4.2 Calculation of Maximum Deflection for Various Materials
If we take the same benchmark as earlier we find that for all the thicknesses, the yield strength is well within the 80% bracket of maximum stress.
3.1.5 Deflection and Stress Calculations for Radial Loads
Looking at the gearbox cover geometry in the earlier figure 3.1.2.1, it can be seen that the radial load will not produce significant deflection. Since the radial load is in the direction parallel to the plate face, no significant deflection can occur.
Looking again at the geometry, there are no significant stress
concentration points. Because the radial force in acting in the plane of the plate, the stress will be distributed along the plane of the plate.
Thickness MAX Stress
lbs/in2 t = 0.1" 1.56E+02 t = 0.0625" 4.00E+02 t = 0.03125" 1.60E+03
Material Modulus, E Yield Strength
lbs/in2 lbs/in2
stainless steel 3.00E+07 3.00E+04
brass 1.50E+07 4.00E+04
zinc-aluminum 1.25E+07 4.21E+04
aluminum 1.00E+07 3.00E+04
nylon, acetal 4.06E+05 9.86E+03
polycarbonate 3.34E+05 9.28E+03
ABS 3.05E+05 5.95E+03
HDPE 1.34E+05 3.34E+03
3.2 TOLERANCE ANALYSIS
According the chosen gear manufacturer, each worm's pitch diameter has been made to the tolerance +0, -.001". Each worm gear's pitch diameter has been made to -.001, -.003". Given these tolerances, the center to center distance of each worm/wormgear mesh will have a tolerance of +0, -.001. This is illustrated below in figure 3.2.1.
Figure 3.2.1 Critical Y-axis Tolerances on the Gearbox
-0.001
* = center to center tolerance
Maintaining the tight tolerances of the center to center distances will keep the noise level of the gearbox down by ensuring proper contact ratio. However misalignment of gears, friction between gears, and looseness between gears all create noise [3]. These can be minimized if the gears are placed as accurately as possible. The noise control is only as good as the gears. In gear selection the material, pitch, contact ratio, and lubrication should be considered as these factors will also affect the noise level [6]. Therefore good gear placement can get rid of some noise but not all.
The tolerances in the x and z directions are important but not critical. They can be matched to the general gearbox tolerances, +0.002.
3.3 CONCLUSIONS
If the gearbox is injection molded, nylon or acetal will be a good material choice. From the stress and deflection results, an acceptable part thickness is .125". This fits in well to typical injection molding thicknesses.
In die casting, zinc-aluminum is a common alloy. It is easy to cast, parts can have thin walls, and dies have long lifetimes. When designing the gearbox of zinc-aluminum, a part thickness of 0.0625" will fulfill the
structural requirements.
Finally tight tolerances for the center to center distances between the gears need to be met. This will reduce the gearbox noise although the choice of gears also plays a significant role in noise control.
PRODUCT REDESIGN
FOR
MANUFACTURING
In this chapter, an evaluation of the current fabrication by machining finds the process cost ineffective. The gearbox is therefore redesigned for die casting and injection molding processes.
4.1 DESCRIPTION OF CURRENT FABRICATION PROCESS
The existing prototype has been machined. The parts have been built in Pro-Engineer CAD system and IGS files have been sent to the Lutron machine shop where they have been CNC machined. In general machining offers close dimensional accuracy. Typical tolerances are limited by the quality of the machines, but tolerances in the range we are interested in (± 0.001 over a length of 2 inches) are achievable. Currently the Lutron machine shop is achieving tolerances of ± 0.002.
4.2 EVALUATION OF THE CURRENT PROCESS
Manufacturing parts by machining can often result in increased cost due to more material needed and a longer cycle time [7]. Since machining is a material removal process there is material wastage. Unfortunately, in this case, the shape of the gearbox is complex (not near net shape of starting stock) and so there will be considerable material removal. Reducing the part
volume (or starting stock of dimension 4.5"x 4.9" x 1") is not possible even though much of the material has no structural purpose. This is due to the fact that for this gearbox in particular, it is necessary to maintain the outside dimensions to protect the cloth and roller and ease the installation by
providing stackability.
According to Boothroyd and Dewhurst, the material cost frequently will form 50% or more of the total cost of manufacturing [1]. As a result, machining is strongly discouraged for large volume production. A quick calculation of the material costs for the gearbox only in table 4.2.1 will show us why machining is not feasible for our current needs.
Table 4.2.1 Material Costs for Machining Gearbox
Stock material will be of dimension = 4.5"x4.9"x1" Volume = 361.3 cm 3 Mass of material in acetal = 0.513 kg
Cost of material per part* = $ 1.54 Material cost of 100,000 parts = $ 154,000 *Cost of acetal is $3.01 per kg.
This cost can be compared to the injection molding material cost calculated in chapter 6.
Despite this drawback, the machining process can achieve good dimensional accuracy and is able to fulfill our tolerance requirements of + 0.001" for the gearbox. This tolerance can be obtained by injection molding and die casting, but it lies at the limits of the processes' capabilities [1].
4.3 REDESIGNING THE GEARBOX FOR INJECTION MOLDING AND DIE CASTING
4.3.1 Guidelines for Redesign
Injection molding and die casting are similar processes in that they involve injecting molten material into a cavity. Many of the part design rules for the two processes are similar. The following are general guidelines that can be applied to both injection molding and die casting [7, 8].
* It is best to avoid undercuts in the part which require expensive tooling. * An even wall thickness throughout the part avoids shrinkage stresses that
build up when there is thickness variation. These stresses can lead to warpage and reduced mechanical performance.
* Sharp corners, angles, and fillets should be avoided, as they may cause cracking and tearing during solidification.
* Fillet radii should be selected from 1/8 to 1 inch to reduce stress concentration for die casting.
* Section changes should blend into each other. In casting specifically, hot spots may otherwise occur which cool at a slower rate compared to the part. This results in shrinkage cavities and porosity.
* Large flat plane surfaces should be avoided since they can warp due to uneven cooling. Surfaces can be broken up with ribs.
* The part should be designed for shrinkage. A part typically shrinks 1.3% for aluminum 1.6% for steel, and 1.5-3.0% for acetal and nylon, depending on the temperature of the mold and the injection pressure [9]. Tensile stresses can result when a section is constrained and unable to shrink.
avoided by staggering, curving or angling the beams.
* A parting line that is completely flat results in reduced mold cost.
* There must always be a draft angle of around .50 to 20 to allow for the de-molding of the part.
4.3.2 Changes to be Implemented
The following changes will be implemented: * A draft angle will be put on all parts.
* For the motormount (where snap fits can be built in) the undercut in the middle section will be taken out.
* The gearbox will be hollowed out to reduce material and to keep the thickness of the part uniform.
* The corners will been rounded.
* Part thickness will be uniform throughout.
* Fillet radii will be made within the specifications. * The part will be sized for shrinkage.
4.4 CONCLUSIONS
Machining the gearbox is not as cost effective as other processes. Injection molding and die casting are net shape processes so they do not lose material. In addition they have cycle times that are much smaller than
machining cycle times. It follows that the gearbox assembly will be redesigned for injection molding and die casting. The design changes will be
CHAPTER 5
PRODUCT REDESIGN FOR ASSEMBLY
A design for assembly analysis will be performed on the current product. The gearbox will then be redesigned for reduced assembly time, according to the DFA rules.
5.1 ANALYSIS OF CURRENT ASSEMBLY PROCESS
The Design for Assembly (DFA) analysis by Boothroyd and Dewhurst [1] provides a systematic procedure for evaluating a design for manual
assembly. Once the procedure is performed, the product is given an assembly time, an assembly cost, a theoretical minimum number of parts and a design efficiency rating.
According to Boothroyd and Dewhurst, two main factors affect the assembly time; the total number of parts in a product, and the ease of handling, insertion and fastening of each part. By performing the DFA methodology, each part of an assembly is evaluated and given a manual handling time, and an insertion time. The manual assembly efficiency can be calculated, and then the theoretical minimum number of parts. When analyzing the theoretical minimum number of parts, as each part is added to the assembly, the following questions should be asked:
1) Does the part need to move relative all other parts already in the assembly?
2) Does the part need to be a different material, or isolated from all other parts assembled?
3) Does the part need to be separate from all other parts for assembly or disassembly?
If any answer is yes to any of the previous questions, then the part is
necessary.
Results
The table in Appendix A provides a list of parts for the current design, numbered in the order that they would be taken from the main assembly if the product were to be taken apart.
As the process is described above, each of the parts on the list was evaluated and given an approximate handling and insertion time as it was added to the gearbox assembly. The design efficiency is calculated from the following equation;
Efficiency = 3 x theoretical minimum no. of parts/ assembly time.
part, as approximated by Boothroyd and Dewhurst.
The results of the analysis are shown in table 5.1.1. The design for
manual assembly worksheets are found in Appendix B. The manual assembly cost is based on a labor rate of $30 per hour.
Table 5.1.1 Results of DFA Analysis
Total Estimated Assembly Time 8.22 minutes Assembly Cost ($30/hr) $ 4.11
Total Number of Parts 44 Theoretical Minimum Number of Parts 15
Design Efficiency 9.12%
According to Boothroyd and Dewhurst, there is a great deal of
improvement possible. The design efficiency is strikingly low at 9.12%, and the theoretical minimum number of parts is 15 compared to the present 44 parts.
5.2 APPLYING THE DESIGN FOR ASSEMBLY GUIDELINES
Applying the Boothroyd and Dewhurst guidelines for optimum assembly to the gearbox, will improve the estimated assembly time and the design efficiency. Below in table 5.2.1 is a list of the design for assembly rules. In Appendix C, these rules are listed in more detail with possible design changes following each rule. When performing DFA analysis, each
suggestion should be examined carefully before implementing it into the design. Sometimes adopting changes may compromise the integrity of the design. For example, some changes may be impractical, cost ineffective, or violate the product specifications. For this reason, in Appendix C, a column called 'feasibility' is placed alongside the suggestions.
Table 5.2.1 DFA Rules to be Applied to the Gearbox Assembly
RULE 1: Reduce Part Count and Part Types RULE 2: Strive to Eliminate Adjustments
RULE 3: Design Parts to be Self-aligning and Self-locating RULE 4: Consider Access and Visibility for Each Operation RULE 5: Consider the Ease of Handling of Parts from Bulk
RULE 6: Design Parts that Cannot be Installed Incorrectly
RULE 7: Eliminate the Need for Reorientation During Assembly RULE 8: Maximize Part Symmetry or Emphasize A-symmetry
5.2.1 Changes to be Implemented
We can now apply the previous suggestions laid out in Appendix A to our current design. Two design alternatives are presented. Since it is unclear whether incorporating the motormount and the sensorhousing into the lid will reduce the cost, two alternatives are investigated in the next chapter. Design A strives to integrate all parts to create an 'integrated' design. Design B keeps the parts separate.
The following changes will be implemented: * The pins will molded into the gearbox.
* Although it is tempting to remove the inserts and have the inside shaft constrained by the gearbox and the cover, this may compromise the tight center to center tolerances necessary between the gears.
* The number of screw fasteners will be reduced.
* Chamfers for all the insertion holes will be designed into the molds. * The housing diameter for the worm 1 will be increased to facilitate easy
insertion.
* The coupling will be replaced by one that is keyed and can be simply dropped onto the worm shaft 1. It will not be fixed down since by attaching the motor, the coupling will be constrained.
* It has been decided not to have the cover snap fit to the gearbox. The alignment of the shafts may be compromised by this fastening method. This would also eliminate the option of opening the gearbox once
assembled. Eventually at the end of the product lifetime, the product may need to be disassembled for separation of parts for appropriate disposal or reuse. In addition if assembled incorrectly, the product can be
disassembled and parts can be reused.
The design changes above as well as those listed at the end of the previous chapter (Redesign for Assembly) have been incorporated into the following four designs. Design A in figure 5.2.1.1 has integrated components and is made for injection molding. Figure 5.2.1.2 is again an integrated
components design but for a die casting process. Because snap fits are not possible in metals, the design had to be slightly altered. Figures 5.2.1.3 and 5.2.1.4 have separate components and are made for injecting molding and die casting respectively.
INSEZTS
CovsR
INSER•TS
SENSo0RHOI
tNG
INSEUTS
Figure 5.2.1.3 Design B for Injection Molding Process
MO0R9AMOLANT
SENSoRHOwU1NG
INSEa-Ts
Figure 5.2.1.4 Design B for Die Casting Process
The DFA analysis showed that the current product is poorly designed for assembly. To improve this, the DFA rules have been applied, in a
selective manner so as to maintain the integrity of the gearbox. Uncertain about which design will be more cost effective, two alternatives are presented; one integrates several components, the other keeps them separate.
Implementing the design for manufacturing (from the previous chapter) and assembly changes has produced four unique designs which will be analyzed for minimum cost in the next chapter.
CHAPTER
6
COST
ANALYSIS
OF
THE
REDESIGNS
The assembly time for each design will be calculated using the
Boothroyd and Dewhurst methods described in the previous chapter. First order calculations for manufacturing the gearbox assembly by injection molding and then die casting will be made. The total costs can then be summed up and compared for each of the four designs.
6.1 CALCULATING THE ASSEMBLY COSTS
Using the Boothroyd and Dewhurst analysis, on our new designs, we can compare the assembly costs. Using the analysis illustrated in chapter 5, the assembly time, the labor cost and the design efficiency can be calculated. The results are shown in table 6.1.1 alongside the results of the original
design.
Table 6.1.1 Results of DFA Analysis for Design A and B.
Design A Design A Design B Design B
Original Injection Die Injection Die
Design Molding Casting Molding Casting
Number of Parts 44 30 32 34 36
Theoretical Min.
no. of Parts (M) 15 15 15 15 15
Assembly time (T) 493.6 sec 146.8 sec 174.1 sec 171.1 sec 186.1 sec Labor Cost
($30/hour) $4.11 $1.22 $1.45 $1.43 $1.55
Design Efficiency
(3M/T) 9.1% 30.7% 25.8% 26.3% 24.2%
There is obvious improvement when comparing the redesign assembly times with the original assembly time. This is due to
improvements that can be easily made to the original design. For instance, chamfers can be easily added into a mold and will reduce the insertion time. Attaching the coupling with 4 small set screws was clearly inefficient and so by changing to a keyed coupling many insertion and handling time issues disappeared.
The number of parts of each design varies as is expected between design A and design B. There is variance within a design due to the differences in
by screws. As expected the theoretical number of parts for each design is the same - 15.
The assembly time has been calculated, and the 'efficiency' of the design in terms of assembly is calculated according to the equation,
Efficiency = 3 x theoretical minimum no. of parts/ assembly time. 3 seconds is an average handling and insertion time for each part, as approximated by Boothroyd and Dewhurst. Looking at the efficiency
percentages, one might be surprised that they are not higher. However the calculation of the theoretical minimum number of parts should be
questioned. According then to their criterion for analyzing the theoretical minimum number of parts as described in the previous chapter, the gear and gear shaft should be one part. Thus the following sets of parts should be combined into one; worm 1 and worm 1 shaft; worm 2, worm gear 1, and inside shaft; worm gear 2 and worm gear 2 shaft. The number of parts in this example would go from 7 to 3. However the feasibility of this action has to be
questioned. Having non-standard gear configurations manufactured to reduce assembly time by several seconds would not be cheaper than buying standard off the shelf components. According to the analysis, all fasteners should be removed. In the case of this gearbox, a cover that is attached by snap fits does not allow for design for disassembly and may not align the box and the cover as accurately as is needed.
From the results, our main concern is the labor cost. Given a labor rate of $30 per hour, the assembly cost of the injection molded product is cheaper than die casting for both design configurations. Indeed, design B injection molded is cheaper than design A die casting. Therefore in this gearbox case, injection molding integrated components (design A for injection molding) gives the most cost effective assembly.
6.2 CALCULATING THE INJECTION MOLDING MANUFACTURING COSTS
The objective of this section is to estimate the cost involved in producing tooling and the fabrication cost per part. Here we are seeking maximum economic advantage.
We will perform the following cost calculations on the gearbox (see drawings for present set up). We will first look at design A and show the logic of the calculations, and then we will present the results of design B. The following equations and some given values are taken from Product Design for Manufacture and Assembly [1].
6.2.1 Design A: Injection Molding Cost Calculation for the Gearbox
Material Cost per Part
The material cost per part can be calculated of acetal is $3.01, we can find the mass of the part. shows the values needed to calculate the material
Table 6.2.1.1 Calculation of Material Cost per Part Estimated Surface Area = 405 cm2 Average Thickness of Part = 0.3175 cm
Estimated Part Volume = 128.59 cm3 Mass of Part = 0.1826 kg (density of acetal is 1420 kg/m3)
MATERIAL COST PER PART = 0.55 $
($/kg of acetal is $3.01)
since we know the cost/kg The following table 6.2.1.1 cost per part.
Molding Machine Size
The molding machine size is based on the required clamp force. The maximum separating force is found by multiplying the projected area of the shot (part and runner system) with the maximum cavity pressure in the mold during filling. Table 6.2.1.2 finds the maximum separating force, and from that the molding machine size.
Projected Area of Part = 0.014 m2
Projected Area of Shot Size = 0.0160 m2
(runner system is 14% of part area)
Maximum Cavity Pressure (N) = 5.86E+07 N
Maximum Separating Force = 9.35E+05 N
MOLDING MACHINE SIZE =
1,100 kN
It has been checked that the machine's maximum shot size is large enough and that the maximum clamp stroke is sufficient for the part.
Molding Cycle Time
The molding cycle time is made up of the injection time, the cooling time, and the mold resetting time. The cycle time is dominated by cooling and the injection time is very small in comparison. It can be estimated at 1 second.
The cooling that takes place is predominantly through heat
conduction. Heat transfer by convection is negligible. Therefore if we model the system as polymer between two metal plates, we can use the heat
conduction equation:
dT d2T
t - x2 (equation 6.2.1.1)
And by making the assumption that the thermal resistance of the mold can be neglected, the equation becomes:
h
2max
4(T
-
T
m)
tl c 2 loge
n2( Tx - )
Mold resetting time includes the time to open and close the mold and eject the part. For the mold resetting time, the equation can be given by:
t
r=
1
+ 1.75t,
[(2D
+ 5)/ L
s]12
(6.2.1.3) The cooling and resetting times are shown in table 6.2.1.3.
Table 6.2.1.3 Molding Cycle Time
Injection Time = 1.00 s
hmax, Maximum Wall Thickness = 3.175 m m Tx, Part Ejection Temperature = 129 o
Tm, Mold Temperature = 93 0 i, Polymer Injection Temperature = 216 0 x, Thermal Diffusivity Coefficient = 0.11
tc, Cooling Time = 13.67 s D, Part Depth = 2.54 cm
Ls, Maximum Clamp Stroke = 37 cm td, Dry Cycle Time = 3.9 s
t,, Resetting Time = 8.08 s
TOTAL CYCLE TIME = 22.8 seconds
Given that it costs $36/hour to operate a 1100 kN injection molding machine, the manufacturing cost per part is given by:
36
x 22.8 = $/ part= $0.23
60 x 60 (6.2.1.4)
Mold Manufacturing Cost
The mold manufacturing cost is made up of the physical mold base cost and the sum of the labor costs involved to make a working mold. This
includes fabrication hours for an ejection system, for complex geometrical features, for the size of the part, and for a non-flat parting line. In order to perform these calculations, it is necessary refer back to our sketches of the redesigns. These sketches will provide basic information about the type of mold needed. For example the design A gearbox will not need any side pulls.
The cost of the mold base is given by:
Cb
=
1000 +
0.45Ac
h0 .4 (6.2.1.5)For the cavity and core manufacturing costs, calculations will be based on a 2-plate mold. The following equations are concerned with the work that
cooling channels, the milling of pockets for the cavity and core inserts. For the ejection system the manufacturing hours are calculated from,
Me = 2.5A0.5
(6.2.1.6) The manufacturing hours for geometrical features can be calculated from,
M = [45(X, + Xo)1.27 1.3 (6.2.1.7)
To take into account the 30% increase in hours needed to reach the tolerance levels required, the equation has been multiplied by 1.3. Xi and X0 measure
the complexity of the inner surface and the outer surface to be molded respectively. Xi and Xo can be calculated by,
X= 0.01Ns, + 0.04Nhd
(6.2.1.7a)
where for the gearbox,
Inner Outer
number of surface patches, Nsp = 24 15
number of holes and depressions, Nhd = 11 2
Xinner = 0.68 Xoutter = 0.23
The size of the part also affects the cost of the cavity and core inserts. The following equation takes into account the increase in hours due to size:
M = 5 + 0.085A1.2
po
85A
(6.2.1.8)
For a non-flat parting line, the extra hours for manufacture can be calculated using,
Ms
f
A 5(6.2.1.9) where fp is the parting plane factor found from table 8.8 ( in this case fp = 2.5) and A, = projected area of the cavity (Ap =140)
Ms=29.58 hours
Table 6.2.1.4 calculates the manufacturing hours described above. Based on a skilled labor cost of $40, the total mold fabrication cost is also found.
Table 6.2.1.4 Mold Manufacturing Costs
MANUFACTURING COST IN
HOURS DOLLARS
Ac, area of mold base cavity
plate = 728.75 cm2 h,, combined thickness of
cavity and core plates = 25.2 cm
Cb, mold base = $2,192.21 Ap, projected part area = 140.3 cm2
Me, Ejection System = 29.61 $1,184.48
A,, part projected area (cm2
) = 140 cm
Mo, Part Size = 36.97 $1,478.89
Xinner = 0.68
Xouter = 0.23
Mx, Geometrical Features = 51.90 $2,075.86
fs, parting plane factor = 2.5
I
Ms, Parting Line = 29.58 $1,183.22
Table 6.2.1.5 Summary of Results for Design A Gearbox
Molding Machine Size 1100 kN
Part Volume 128.59 x 10⁻⁶ m3
Part Mass 0.1826 kg
MATERIAL COST/PART $0.55
Injection Time 1 sec
Cooling time 13.57 sec
Resetting time 8.08 sec
TOTAL CYCLE TIME 22.65 sec
($36/hr)
MANUFACTURING COST PER PART $ 0.23
Cost of Mold Base $ 2,192
Manufacturing hours - ejection system 29.61 hours Manufacturing hours - factor of size 36.97 hours Manufacturing hours - geometrical features 51.90 hours Manufacturing hours - non-flat parting line 29.58 hours ($40/hr)
TOTAL MOLD MANUFACTURING COST $ 5,922
TOTAL MOLD COST $ 8,115
TOTAL COST PER PART $ 0.78
TOTAL COST FOR 100,000 PARTS $ 86,115
6.2.2 Total Injection Molding Costs for Both Designs
Given that we have laid out the process for finding the costs for manufacturing, we can evaluate the entire product. The costs for components such as gears which are identical for each design are not
included. We are seeking a comparison of costs for the different of designs. Table 6.2.2.1 shows the costs for all the components for design A. This also includes the assembly costs worked out earlier.
Table 6.2.2.1 Design A: Total Injection Molding Costs Gearbox
Mold Cost $ 8,115 Cost per Part $ 0.78
Total Cost for 100,000 Parts $ 86,115
Gearbox Cover
Mold Cost $ 11,908 Cost per Part $ 0.38
Total Cost for 100,000 Parts $ 49,908
Cost to Manufacture 100,000 Gearbox Assemblies $ 136,023 Assembly Cost $ 122,000
TOTAL $ 258,023
While performing the calculations, it was found that it was costly to mold the sensorhousing and motormount separately. In practice, the two parts would be coupled into one mold. Therefore the following cost
calculations were made based on this coupling. The overall costs for design B are in Table 6.2.2.2.
Table 6.2.2.2 Design B: Total Injection Molding Costs Gearbox
Mold Cost $ 8,115 Cost per Part $ 0.78
Total Cost for 100,000 Parts $ 86,115
Gearbox Cover
Mold Cost $ 5,556 Cost per Part $ 0.36
Total Cost for 100,000 Part $ 41,556 Sensorhousing and Motormount
Mold Cost $ 6,265 Cost per Part Set $ 0.20
Total Cost for 100,000 Part Sets $ 26,265 Cost to Manufacture 100,000 Gearbox Assemblies $ 153,936 Assembly Cost $ 143,000
TOTAL $ 296,936
Comparing the two designs, it is clear that design A, or integrated components is cheaper for injection molding, both for manufacturing costs, and assembly costs. Let us see how die casting the gearbox assembly compares to this.
Once again we are estimating the cost involved in producing tooling and the fabrication cost per part for the die-casting. The process is laid out in chapter 10 of Product Design for Manufacture and Assembly [1].
According to our specifications, a zinc-aluminum compound (ZA8) will fit our requirements. Its yield strength is 290 MN/m 2 and its elastic
modulus is 86 GN/m 2. Compared to the injection molded part, the walls of a
zinc-aluminum alloy can be thinner and so less material is used. However this material choice will require that we use a cold-chamber machine which has a longer cycle time. ZA8 costs around $1.78 per kg.
It is important to note, that the die life for die casting is much less than that of injection molding. For an aluminum alloy the mold is good for
around 100,000 parts. Since we will be producing 100,000 parts, this works well for us.
An extra process necessary when die casting is the trimming stage. This takes place after the extraction from the mold to remove the parting line flash, the runners and the overflow wells.
6.3.1 Design A: Die Casting Cost Calculation for the Gearbox
Design A will have to be altered to account for the material change. Let us assume that we continue to have the inserts made of a polymer. Since
they are identical to the injection molding inserts, they can be neglected in the overall cost comparison.
The motormount will have to be redesigned as snap fits are not possible in metal. The redesign will require two side pulls to accommodate the 3600 lip on the motormount. Please see figure 5.2.1.2 for clarification.
The gearbox will remain unchanged in its general shape. Like the injection molded part, there will be a draft for easy extraction, constant wall thickness and smooth corners to facilitate the flow of molten material.
Before we begin our calculations, it is necessary to find the most
economical number of cavities per mold. Given that we are running a small production of 100,000 parts, it was found that one cavity was the optimum number for our needs.
Material Cost per Part
The walls of the die cast part are 1/16" thick compared to 1/8" for injection molding. The cost per kg of ZA8 is $ 1.78. Even so, the material cost per part is still more expensive than injection molding. The results are shown in table 6.3.1.1 below.
Table 6.3.1.1 Calculation of Material Cost per Part
Casting Machine Size
The casting machine size is based on the required clamp force. The
machine clamp force F, must be greater than the separating force f of the molten metal on the die. The separating force can be approximated by:
f = Apt
10
Table 6.3.1.2 Casting Machine Size Calculation
Projected Area of Part = 140.30 cm2 Total Projected Area = 245.53 cm 2
(feed and overflow is 75% of part area)
pm, Molten Metal Pressure in Die = 3.50E+01 MPa
f, Force of Molten Metal on Die = 8.59E+02 kN
CASTING MACHINE SIZE = 900 kN
(6.3.1.1)
Referring to table 10.4 in Boothroyd and Dewhurst, a suitable machine has a clamping force of 900 kN. We have checked that the machine's maximum
Estimated Surface Area = 405 cm2 Average Thickness of Part = 0.1588 cm
Estimated Part Volume = 64.29 cm3 Mass of Part = 0.4051 kg (density of ZA8 is 6300 kg/m3)
MATERIAL COST PER PART = 0.72 $ ($/kg of ZA8 is $1.78)
platen area is large enough.
Total Shot Volume
It is necessary to calculate total shot volume since the cycle time will depend on it. Shot volume is made up of the cavities Vc, the overflow wells
Vo, and the feed system Vf.
The following are their equations:
0.8v
V h 2 5 (6.3.1.
V
V
J=
_
c
and their results are shown in table 6.3.1.3 where h is the average and their results are shown in table 6.3.1.3 where h is the average thickness of the part and is taken to be 1/16" or 0.159 cm.
Table 6.3.1.3 Total Shot Volume Calculation
2)
3)
Die Casting Cycle Time
The casting cycle time is made up of ladling, cooling, part extraction, and die lubrication. Although trimming is performed separately from the casting, the trimming cycle time needs to be calculated. The injection time is so small in comparison to the cycle time, that it can simply be neglected.
The time to ladle the molten shot into the cold-chamber machine depends on the total shot volume which was calculated above and is given
by:
tim
2 +
0.0048V
Vc, vol. of part (cavity) = 64.294 cm3
Vo, vol. of overflow shells (cm3) = 28.865 cm3
Vf, vol. of feed system (cm3) = 40.500 cm3
TOTAL SHOT VOLUME
= 133.66 cm3In die casting the cooling process is different from injection molding. The main resistance to heat flow is at the interface layer between the casting and the die. Lubricants are sprayed on the die to provide slow cooling so that the die can be filled properly.
Cooling time can be approximated by:
tc K•jf hmax (6.3.1.5)
Extraction time is given by the following equation;
t = 1 +.08(W + L) for W+L > 25 cm otherwise tx =3 sec (6.3.1.6)
where W and L are the width and length of the smallest possible rectangle which will enclose the cavities, overflow wells, and feed systems.
The open/close time of the die is given by;
t,+c
= 1.7 5td (6.3.1.7)The lubricant forms a barrier to heat flow in addition to protecting the die surface. With ZA alloys the mold must be lubricated for every second part. The equation is given by;
t= 3 + (n,nc) + (nc - 1) (6.3.1.8)
Given that it costs $66/hour to operate a 900 kN machine, the manufacturing cost per part is given by:
injection molding
6666 x 14 = $ / part = $0.26
60 x 60 (6.3.1.9)
Trimming Cycle Time
Since the trimming takes place outside of the mold, in a separate die, this does not add to the total cycle time. However we have to account for it in the manufacturing cost since it costs $40 per hour to run the machine. The hourly trimming rate can be considered the same as the labor rate.
tp = 5.4 + 0.18(L + W)
Vs, Total Shot Volume = 133.66 cm3
tm, Ladling Time = 2.64 Af, Cavity Surface Area = 405 mm
Ap, Cavity Projected Area = 140.3 cm2
for ZA8, b = 0.42 hmax Maximum Part Thickness = 3.175 m m
tc, Cooling Time = 2.27 s L= 12.5 cm
W= 26.3 cm
tx, Extraction Time = 4.10 s
td, dry cycle time (sec) = 2.2 s
to+c, Open and Close Time = 3.85 s n s, no. Side Pulls per Cavity = 0
nc, no. of Cavities = 1 t,, Die Lubrication Time = 3 s of Machine Cycles per Lubrication = 2
Die Lubrication Time per Part = 1.5 s
TOTAL CYCLE TIME = 14 seconds
where L and W are defined earlier. It is found that tp = 12 seconds. Therefore performing a similar calculation to that described in equation (6.3.1.9), the trimming manufacturing cost/ part = $ 0.13.
Die Cost Estimation
The equations used for injection molding can be applied directly to die casting with minor changes. The answers must be multiplied by a factor of 1.25 to take into account the difficulty involved in machining the steels and the machining of the overflow wells.
For the same plate sizes, a die casting die set will usually cost 25% more than an injection molding. The equation for the die set cost is given by;
Cd
=
1250
+ 0.56Ach
0.
4 (6.3.1.11)For the ejection system the manufacturing hours are calculated from,
Me = [2.5A°
.
5]1.25
(6.3.1.12)
The manufacturing hours for geometrical features can be calculated from,
M
= [45(Xi + Xo)1.271.625
(6.3.1.13)To take into account the 30% increase in hours needed to reach the tolerance levels required, the equation has been multiplied by 1.3.
Xi and X0 measure the complexity of the inner surface and the outer surface to
be molded respectively.
The size of the part also affects the cost of the cavity and core inserts. The following equation takes into account the increase in cost due to size;
Mpo
= [5 + 0.085A
.2]
1.25
(6.3.1.14)For a non-flat parting line, the extra hours for manufacture can be calculated using,
where fp is the parting plane factor found from table 8.8 ( in this case f, = 2.5) and A = projected area of the cavity. The costs displayed in the following table 6.3.1.5.
Table 6.3.1.5 Casting Manufacturing Costs
MANUFACTURING COST IN
HOURS DOLLARS
A,, area of Die Set Cavity Plate
= 1135.75 cm2 h,, Combined Thickness of
Cavity and Core Plates = 18.175 cm
Cb, mold base = $ 3,278.90 Ap, Projected Part Area = 140.3 cm 2
Me, Ejection System = 37.02 $ 1,480.60
Ap, Part Projected Area (cm2) = 140.3 cm
Mpo, Part Size = 46.32 $ 1,852.72
Xinner = 0.68 Xouter = 0.23
Mx, Geometrical Features = 64.87 $ 2,594.83 fs, Parting Plane Factor = 2.5
Ms, Parting Line = 37.02 $ 1,480.60
TOTAL MOLD COST = $ 10,688
Trim Die Cost
A trim die is similar to a blanking die, but cheaper because of the
smaller forces. The flash is usually around 1 mm thick. cost is given by;
The equation for the
(6.3.1.16) where f ,, Mto and X, are given by;