DENSITY LIMITS IN TOROIDAL PLASMAS
Martin Greenwald
MIT - Plasma Science & Fusion Center
Abstract
In addition to the operational limits imposed by MHD stability on plasma current and pressure, an independent limit on plasma density is observed in confined toroidal plasmas. This review attempts to summarize recent work on the phenomenology and physics of the density limit. Perhaps the most surprising result is that all of the toroidal confinement devices considered operate in similar ranges of (suitably normalized) densities. The empirical scalings derived independently for tokamaks and reversed field pinches (RFP) are essentially identical, while stellarators appear to operate at
somewhat higher densities with a different scaling. Dedicated density limit experiments have not been carried out for spheromaks and field-reversed configurations (FRC), however "optimized" discharges in these devices are also well characterized by the same empirical law. In tokamaks, where the most extensive studies have been conducted, there is strong evidence linking the limit to physics near the plasma
boundary thus it is possible to extend the operational range for line-averaged density by operating with peaked density profiles. Additional particles in the plasma core
apparently have no effect on density limit physics. While there is no widely accepted, first principles model for the density limit, research in this area has focussed on
mechanisms which lead to strong edge cooling. Theoretical work has concentrated on the consequences of increased impurity radiation which may dominate power balance at high densities and low temperatures. These theories are not entirely satisfactory as they require assumptions about edge transport and make predictions for power and impurity scaling that may not be consistent with experimental results. A separate thread of research looks for the cause in collisionality enhanced turbulent transport. While there is experimental and theoretical support for this approach, understanding of the underlying mechanisms is only at a rudimentary stage and no predictive capability is yet available..
1. Introduction 1.1 Motivation
Magnetic confinement experiments cannot operate over an arbitrary range of plasma densities. In addition to the operational limits imposed by MHD stability on plasma current and pressure, an apparently independent limit on plasma density is observed. Even after extensive running time and sophisticated wall conditioning, each machine typically finds lower and upper density limits. The upper density limit is more important to the goal of practical fusion power since the fusion reaction rate scales with n2. At constant pressure, the fusion reaction is maximized at an optimum temperature on the order of 10 keV so plasma pressure cannot be arbitrarily partitioned between density and temperature. Reactor design studies typically find that densities on the order of 1020 /m3 are required [1]. The density at the optimum temperature can be computed as follows [2], 2 optimum optimum T n T B β ∝ (1.1)
then using standard definitions N T
P aB
I
β ≡ β where IP is in MA, BT is in T, and a is in m.
N P T optimum I B n a β ∝ (1.2)
using the most common empirical scaling for the density limit [3]
2 P G I n a π = (1.3)
optimum N T G n aB n ∝β (1.4)
The design for ITER (international thermonuclear experimental reactor) was constrained by the need to operate at these high densities with prediction of the density limit one of its most critical needs [4]. For the ITER EDA, equation 1.4 yields nOPTIMUM that exceeds
nG by 70%. The reference discharge for the newer ITER-FEAT design is optimized for n/
nG ~ 0.9 [5]. Note that a reactor may still ignite even at a sub-optimum density, it simply
is not achieving the maximum possible fusion yield at a given plasma pressure. The accessible density range affects other aspects of machine operation as well. In tokamaks, a transition from H to L-mode occurs as the limit is approached and
disruptions are more frequent when running near the limit. Plasma purity and radiated power levels are typically strong functions of the density as are fueling and pumping efficiencies, the performance of divertors, (particularly their ability to dissipate heat effectively) and the efficiency of current drive schemes.
Density limit experiments have two principal goals. The first is to find operational scenarios which maximize the density, particularly the central density, and second, to investigate the physics which underlies the limit. Techniques for wall conditioning [6-15] have been developed which enable operation at higher densities. Methods such as central fueling or edge pumping which can lead to peaked density profiles have allowed operation at higher average and peak density as described below in sections 2.2.3 and 2.2.6. Understanding the mechanism for the density limit is crucial for extrapolating machine performance into untested regimes. For example, if the density limit were determined entirely by global power balance between input power and radiation, a fusion device might be able to run at arbitrarily high densities since both fusion heating power and radiation losses would increase with n2 [16]. On the other hand, there is a substantial body of evidence which suggests that a limit exists which is largely
independent of the input or radiated power. While empirical scaling laws have done a reasonable job in describing data from many recent experiments, they can only hint at the underlying physics. It seems likely that robust, reliable predictions will only come
from the development of a first-principles theory for the density limit backed up by detailed experimental observations. The extensive work already accomplished and reviewed here should provide a solid basis for such development.
1.2 Background
1.2.1 Early Observations and Empirical Studies
Reports of a disruptive density limit go back to some of the earliest experiments on tokamaks carried out in the mid to late 1960s [17-19]. While the plasmas in these experiments were burdened with impurities, and techniques for wall conditioning and fueling were not well developed, many of the basic features of the limit were observed and catalogued. Strong MHD oscillations accompanied by shrinkage of the current channel, inferred from changes in plasma induction, were seen as the disruptive limit was approached. By the mid 1970s, enough data on this phenomenon had accumulated to begin scaling studies. Data from 13 circular, ohmically heated machines with a wide range of operating parameters (maximum densities ranged from 0.1 - 3.5 x 10²⁰) were compiled and compared [20]. A scaling law was found where the maximum denstiy, nM
= BT/R with R the major radius in m. This relation, which became known as the
"Murakami limit" was interpreted as an expression of global power balance between neutral or radiation losses and the ohmic input power which was roughly proportional to the central current density j0 ~ BT/R. Most of the data was for experiments with fill gas
only and no puffing and yielded plasmas densities which clustered at about 1/3 of the value predicted by later scalings. Results with gas puffing from Pulsator and Alcator showed densities about a factor of 2 higher. The DITE group plotted the operating space for their device by graphing plasma current vs density [21], later using a normalized form showing 1/q vs n/nM [22, 6]. This "Hugill" plot showed the disruptive
limit for high current (low q) operation as well as the density limit and became a standard method of displaying the operating space for tokamaks as well as reversed field pinches. Figure 1 shows a rough schematic of the operating space for a tokamak and the various limits discussed in this section. As data were added to these plots,
particularly from discharges with auxiliary heating, it became clear that there was an important relationship between the maximum attainable plasma density and the current density [23, 24]. Note that for circular, high aspect ratio plasmas, BT/qR ~ IP/a2. Results
with neutral beam injection (NBI) heating showed that this relationship did not depend in an important way on input power [25]. (This conclusion cannot be demonstrated with ohmically heated experiments alone since the power and current are strongly covariant in this case.) This scaling, in the form n = B/qR came to be called the Hugill limit. It was also recognized that reversed field pinch (RFP) devices showed a very similar density limit [26, 25]. In these devices, the operating range was parameterized as I/N where I is the plasma current and N is the number of particles per unit toroidal length. Simple algebra shows that this is equivalent to n = IP/a2 or B/qR.
During the next decade, as data from new experiments became available, quantitative discrepancies with the density limit scaling were found. That is, the coefficient in front of B/qR was found to vary from machine to machine. (This was not always readily
apparent since different definitions for q were used in publications.) For a high aspect ratio circular device, the difference between the simplest analytic expressions for q in a straight cylinder wasn't much different than the MHD q derived from an equilibrium calculation. However, for strongly shaped plasmas the difference could be a factor of 2 or more. As part of the conceptual design for a burning plasma experiment, an effort to assess this problem was undertaken [3]. Figure 2 shows the boundaries in operating space in Hugill space for the set of tokamaks used in this study. With 1/qϕ as the dependent parameter, no common limit was seen. The new scaling, nG IP2
a
π
= was
found which was equal to the Hugill limit for circular machines but which was
substantially higher for experiments with shaped cross sections. Results of that scaling using the same data that went into figure 2, can be seen in figure 3. (Recent data from strongly shaped tokamaks, for example the spherical tokamak, MAST, demonstrate how important these shaping factors can become [27]). This limit has become known as the Greenwald limit and is a common figure of merit for high density operation. It has been written in the literature as nG, nGR, or nGW; this review will use the former notation in
equations and will also use it synonymously with "empirical density limit". The ratio n/nG
will be referred to as the "normalized density". In general, subsequent experiments have been in rough agreement with this scaling; there has not been a renewed effort to
assemble a multi-machine database and refine the scaling. Discharge regimes which allow operation above the empirical limit have been the subject of intense investigation. Further information on these regimes and more detail on empirical scaling of the density limit can be found in section 2.
1.2.2 Physics correlated with the density limit scaling
The density limit provides a normalization for many density dependent phenomena, even when far from the disruptive limit. Plasma density would seem to be bounded by two limits, both of which are proportional to plasma current density. In the absence of field errors which can cause locked modes and reduce the accessible operational range, the low density limit for tokamaks and RFPs sets in at about 5-10% of the high density limit [28, 29]. This limit is often associated with slide-away or run-away regimes in which the drift parameter, vDRIFT/vTHERMAL is critical. Note that VDRIFT ∝J n/ . As
reported by Murakami, the "natural" density for unfueled ohmic discharges turns out to be about 0.3-0.4nG [20]. The data in this reference included a scan from the ORMAK
device which showed a linear dependence between the achieved density and the plasma current. Analysis of data from the international tokamak database has shown that the boundary between the linear and saturated confinement regimes scales like the density limit, occurring at about n/nG ~ 0.4 [30, 4]. The "natural" density for ELMy
H-modes (achieved when gas puffing is turned off at the L/H transition) also falls within a well defined range in density normalized to the density limit, typically 0.4-0.6 [31, 32]. With moderate gas puffing, JET reports n/ nG of 0.75 independent of heating method or
power [33]. Overall, data residing in the international database for ELMy H-modes from 17 tokamaks have an average value of 0.55nG with a standard deviation of 0.2 [31]. In
H-mode, the transition from type I to type III ELMs and the back transition to L-mode can both be characterized by n/ nG. (for references and further details see section
scale lengths and floating potential scale with n/IP [34, 35]. In RFPs, I/N provides a good
scaling parameter for ZEFF and β [36]. Finally, note that the critical β for the onset ofN
tearing modes can be scaled with n/ nG. All of these results suggest that the density limit
may not be due to critical phenomena which arise only near the limit, but rather is the result of gradual trends which hold across a broad range of densities.
1.3 Approach and organization
This review will attempt to survey recent work on the density limit with a particular emphasis on those studies which may shed light on the underlying physical
mechanisms. Extension of the empirical scaling to include recent data will not be attempted, though parameters which lead to significant deviations from the current scaling will be identified. Since the ultimate goal is to predict where in parameter space the density limit will occur, this physics will be stressed rather than the details of the limiting collapse. Thus the MHD phenomenon observed during a density limit collapse will be discussed only briefly. The limit is apparently not extended by special attention to equilibrium, or MHD stability. While results from the widest possible range of toroidal confinement types will be presented, the balance of the published work necessarily leads to more detail from tokamak experiments than from others. Section 2 describes experimental observations of the density limit for a variety of confinement experiments and device types. The importance of various parameters is discussed with emphasis on those which are not explicitly included in the empirical scalings. Section 3 summarizes various mechanisms proposed for the density limit including supporting and
contradictory experimental data. A brief summary is outlined in section 4 followed by a discussion of the major issues and prospects for future work in section 5.
2. Observations and parametric dependence of density limits 2.1 Introduction
Investigations into operational limits must necessarily deal with certain complexities and ambiguities. The density limit is usually studied by vigorously fueling a plasma and observing the effects. Researchers must assess the degree to which the effects
observed are due to the intrinsic physics of the device or to the techniques used for fueling. Unfortunately, the plasma physics responsible for gas fueling, the transport of particles up a density gradient from the edge to the core, is only poorly understood. Further, gas fueling necessarily involves the complications of neutral interactions, wall recycling, atomic radiation and so forth. The relevant atomic processes are well
understood but calculation of the rates requires detailed knowledge of edge profiles and the two (or three) dimensional distribution of neutrals. The role of fueling from neutral beams is not discussed much in the literature, but can clearly play an important role. Researchers on many experiments have reported "fueling limits" where the ability to raise the density is attributed to a deficiency in the particle source rather than in the plasma response [37, 38, 8, 39-41, 32, 27]. In assessing density limits in general, one must also note that experiments typically do not achieve their highest densities until they reach a certain maturity - there is clearly a learning curve which must be traversed - and it would not be wise to place too much emphasis on the earliest data from a new machine.
The plasma response which defines the density limit, may be a degradation in temperature or confinement, a change of regimes, or a sudden termination of the discharge. Density limits in stellarators are apparently always of the first type, while RFPs and tokamaks manifest all three types of behavior. Tokamaks in H-mode first show degraded confinement and a change in ELM activity [42] before making a transition to L-mode and finally disrupting. RFPs also show disruptive behavior when the density is pushed at high density and current [13]. When data from different
are being compared. Finally, the limit often manifests itself as a catastrophe - a disruption or a discontinuous change in regimes which is accompanied by nearly simultaneous changes in many observable parameters. Sorting out cause and effect in such a situation can be extremely difficult. Defining an operational boundary
quantitatively presents its own difficulties. These issues will be addressed in section 2.2.2
2.2 Tokamaks
Tokamaks confine plasma with poloidal fields which arise from currents driven in the plasma itself. Flux surface averaged stability is provided by a strong toroidal field. The plasma is subject to large scale instabilities, driven by the plasma current and pressure, which can destroy the plasma if excited. Small scale instabilities are typically present and lead to significant particle and energy transport.
2.2.1 Plasma behavior at high densities 2.2.1.1 General Observations
As the density is raised toward the limit in a tokamak, a wide variety of phenomena is encountered in sequence. Summarized in table 1, these phenomena include the
appearance of MARFEs, divertor detachment, a drop in H-mode confinement, changes in ELM activity, the H/L transition, poloidal detachment, current channel shrinkage, a rise in MHD activity, and finally major disruptions. Cooling of the plasma edge is a key element in all of them, reinforcing the importance of the edge plasma in the density limit that was suggested by early experiments [19, 22]. This notion has been more firmly established by studies of plasmas with peaked density profiles [43-51] as detailed in section 2.2.6 below. The effects listed are essentially universal with only the obvious exceptions - devices without divertors don't observe divertor detachment, experiments in L-mode won't see the H-mode effects, and so forth. The first four, MARFEs, divertor detachment, H-mode confinement degradation and the changes in ELM behavior can
have their onset over a wide range of densities (from perhaps 0.3nG to 0.9nG depending
on machine details) which are not entirely understood. The precise definitions of these phenomena and the densities at which they occur are crucial quantitative questions since their onset have been used as criteria for various theoretical calculations of the density limit. The last five, the H/L transition, poloidal detachment, shrinkage of the current channel, strong MHD activity and disruptions tend to occur at or very near the limit. Of course, the H/L transition defines the H-mode density limit and a disruption, by its nature, defines the overall limit.
The edge cooling which precedes density limiting phenomena is generally attributed to radiation. While the impurity content, as measured by ZEFF, usually drops with density
[52], overall radiation, which scales as nenZ, usually increases. Improvements in wall
conditioning which leads to lower levels of impurities have also allowed operation at higher densities [22, 6-15] at least up to a point. It is notable however, that experiments where ZEFF is reduced below 2-2.5 don't see a further increase in the limit [3, 53].
Recent experiments have identified an increase in edge turbulence as the possible source for edge cooling at higher densities [54]. In some cases, most notably JET, the density limit is reported to correspond to PRAD/PIN ~ 1 [55, 56]. Radiation is seen to
increase non-linearly with density, growing by about a factor of two in the last half second before the disruption during which time the density rises by no more than 5% [57]. This result is similar for discharges run in JET with both carbon and beryllium plasma facing components [58]. In the case of beryllium walls, the discharge does not proceed to a disruption but instead undergoes a series of relaxation oscillations driven by changes in radiated power, fueling efficiency and density [59]. ASDEX has found much lower radiated power fractions at the density limit, in the range of 30-40% from the main chamber [8, 9] and not exceeding 60-70% when radiation from the divertor is included [7]. ASDEX Upgrade reports density limits with the PRAD/PIN between 60% and
80% [60, 41]. These differences are perhaps due to different interpretations of the transient behavior which occurs as a discharge proceeds to the limit. During this period, the radiation increases rapidly in a positive feedback loop with the rapidly dropping electron temperature. It is worth noting that the observation of density limiting
disruptions with radiation at only a fraction of the input power has a long history. T3 reported an increase in PRAD/PIN with density reaching a maximum of about 30% as the
disruptive limit was approached [61]. DITE reported the radiated fraction at about 50% at the limit. The role of radiation as a principal cause for the density limit, rather than as a correlation is discussed in detail in section 3.2.
2.2.1.2 MARFEs
First reported on the Alcator C, ASDEX, Doublet III and FTU tokamaks, a MARFE is a toroidally symmetric, poloidally localized, strongly radiating region of high density and low temperature, typically seen on the high field side of a tokamak [62-65, 34]. The original observations were on limited machines, [66] however similar phenomena have been observed on divertor experiments as well [67, 46, 47]. Divertor machines also exhibit what are sometimes called "X-point MARFEs" and "divertor MARFEs" which correspond to conduction-limited and detached operation and are due to similar but not identical physics. Note that these terms do not have universally accepted definitions.
MARFEs are a manifestation of a radiative collapse or "condensation" which results from the local imbalance between input power and radiation. Over certain temperature ranges, partially ionized impurities radiate more power at lower temperatures; that is, dPRAD /dTe < 0. If conduction and convection are not able to supply enough power, the
situation is unstable, with the temperature dropping and radiation further increasing. The requirement for pressure balance leads to a concomitant increase in local density, further accelerating the collapse. The temperature will continue to drop until dPRAD /dTe
becomes sufficiently less negative to bring the local plasma back into equilibrium, usually at temperatures less than 10 eV [66, 9]. Since atomic ionization and excitation increase as nenZ, radiated collapses are more likely as the density is raised. The
conditions for radiative instability occur at low temperature, radially localizing MARFEs to the plasma periphery, typically to the SOL. As the density is raised, MARFEs have been observed to expand radially inward toward the core plasma [68, 69, 46, 70].
In some cases, MARFEs are seen just before the density limit is reached prompting theories of the density limit based on the stability condition for MARFE formation.
ASDEX, ASDEX-Upgrade, FT, JT-60, DIII-D, and JET have reported the appearance of MARFEs at densities just below the disruptive limit [57, 71, 9, 72-74]. However, while the formation of MARFEs is generally well parameterized by the density normalized to the density limit, n/nG, many experiments report MARFE formation at densities well
below the limit. Machines as diverse as Alcator-C, C-Mod, Doublet III, DITE, and TFTR found MARFE thresholds in the range 0.4 - 0.55 nG [66]. FTU has found that MARFEs
form at a variable fraction of the density limit with dependences on input power, ZEFF
and limiter material [39]. Experiments with beryllium first wall materials in JET found a MARFE formation density which scaled as PIN0.5 [37]. In part, the difference in these
observations may be the result of differences in definitions or diagnostics. In some cases, MARFEs were seen to begin as highly localized structures which would not have been visible in machines without good diagnostic coverage. As the density was raised, the MARFEs expanded poloidally and radially, becoming more visible. In some cases, where the full dynamics are observed, authors have used the expansion of MARFEs as the cited precursor. The differences in diagnostics and interpretation do not seem to be sufficient, in all cases, to account for the different observations of the threshold which must instead, be due to some persistent but poorly understood physics.
2.2.1.3 Divertor Detachment
At high density, conditions of low temperature and strong radiation occur in the divertor region as well. An ordered succession of regimes occurs as the power per particle is reduced. These operational regimes are defined in terms of the variation in plasma parameters along the open field lines from the midplane to the divertor strike point. At the lowest densities (and/or highest input powers) the plasma is in the "sheath limited" regime where density temperature and pressure are constant. As the density is raised (and/or power lowered) the SOL plasma enters the "conduction limited" regime in which the temperature drops near the divertor strike point. Momentum conservation requires constant pressure so the density near the strike point increases accordingly. At this
point a radiative collapse can occur leading to what some (but not all) authors term a "divertor MARFE". At still higher densities (and/or low powers), collisions between plasma ions and neutrals become important providing a sink for momentum and leading to a drop in plasma pressure near the strike point. This condition is called "divertor detachment" and is seen to occur when the electron temperature at the strike point drops to around 5 eV. Detachment can be seen in data from ASDEX as early as 1983 [75] but was not studied extensively until the early 1990's [75, 72, 76-81]. Detachment does not occur on all flux surfaces simultaneously, but begins near the separatrix and extends radially outward into the SOL as the density is raised [82, 46]. In the early stages of this process, usually termed "partial detachment", the low temperature, strongly radiating region is tied to the strike point, however as the detachment
completes its radial extension, it jumps to the X-point. This phenomena is often called an "X-point MARFE". The divertor often exhibits in-out asymmetries, with plasma parameters differing in the inner and outer divertor legs. These asymmetries can depend on the direction of the toroidal field, with higher densities on the inner divertor leg when the field is in the "normal" configuration, that is with the∇Bdrift toward a single null divertor [83]. Detachment follows the asymmetry, occurring more readily on the inner divertor leg in this case.
Detachment tends to occur as the power per particle is reduced. Just as in the case with MARFEs, the detachment threshold does not occur at the same fixed fraction of the density limit on all machines. ASDEX [9] and JET [84] report complete detachment at densities just below the limit. In DIII-D, detachment is seen at 0.6-0.7 x nG [85], with
some weak dependence on input power, nDETACHMENT ~ P0.15. Good H-mode
confinement was maintained in this case, until the detachment completed and an X-point MARFE was formed. An increase in fueling efficiency and impurity levels accompanied complete detachment [86, 47]. JT60-U saw detachment at similar densities, roughly 0.7-0.75nG but almost independent of power in this case. In its
standard configuration, Alcator C-Mod, reported detachment in the range 0.3-0.4nG with
a nearly linear dependence on input power [77]. However, divertor geometry was found to have an important influence on the detachment threshold in C-Mod, with flat-plate
divertor configurations detaching at densities 50-80% above the levels found for the standard inclined-plate geometry [87]. ASDEX-upgrade observed X-point MARFEs which existed stably at densities well below the limit (nDETACHMENT ~ 0.5nG). The limit was
associated instead with the movement and expansion of the MARFE. In this device, the threshold for X-point MARFE formation was linear with power [73], the plasma could always be made to detach if the power were low enough. ASDEX-upgrade also reported the "completely detached H-mode" (CDH) regime which began at about 0.65nG [88].
The MARFEs were less stable for plasmas with the∇Bdrift away from a single null divertor and disrupted at densities at only 60-70% of those with the "normal" field direction. This difference was attributed to an increase in impurity fluxes for the "reversed" field case.
2.2.1.4 Effects on H-mode confinement and character
Density limit disruptions do not occur directly from H-mode plasmas. As the density is raised toward the limit, confinement usually degrades accompanied by a change in ELM character, followed by a transition to L-mode. This phenomenon is extremely important as fusion reactors based on the H-mode regime require both high density and good confinement. Discharges with peaked density profiles can compensate to some extent by increasing the peak density relative to the average and by improvements in core confinement which are correlated with peaked density or pressure profiles. These effects are discussed in greater detail in section 2.2.6 The H/L transition occurs quite close to the disruptive limit in all machines and for standard H-modes with flat density profiles, the transition is reasonably well characterized by the Greenwald scaling. ASDEX-upgrade, C-Mod, DIII-D, JET, and JT60-U report an "H-mode" limit at 0.9, 0.8, 0.85, 0.95, and 1 x nG, respectively [89, 85, 90, 32, 91]. The relation between the H/L
and disruptive limits can be seen clearly when the threshold power is plotted against the normalized density as in figure 4 [68, 41, 92, 93]. The required power increases
dramatically as the density limit is approached, deviating from the linear density scaling usually seen for the power threshold [94, 95]. While some small differences in scaling
for the H/L and disruptive limits have been found, it is probably best to think of them as part of the same progression.
The L/H transition and good H-mode confinement are correlated with high edge temperatures [96-100, 91, 101], so it is not surprising that the strong edge cooling associated with the approach to the density limit results in lower confinement and back transitions. Note that this cooling must be stronger than that implied by constant
pressure, TEDGE ~ 1/ nEDGE. With stiff, self-similar temperature profiles (∇ ∝T T), and
relatively flat density profiles typical of H-mode, this relation results in total stored energy, nTdV
∫
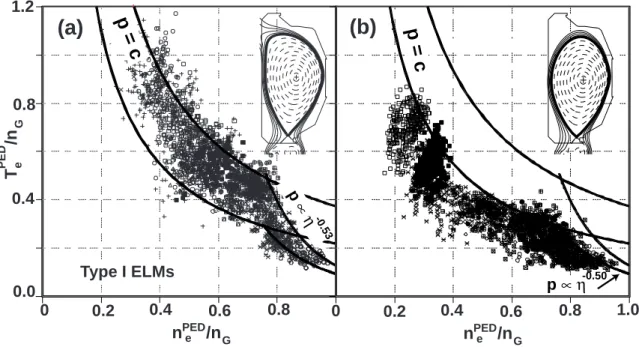
, which is independent of density. Confinement degradation results from situations where the temperature drops faster than 1/ nEDGE as can be clearly seen infigure 5 from DIII-D [102],. Discharges follow a constant pressure curve until n/ nG ~
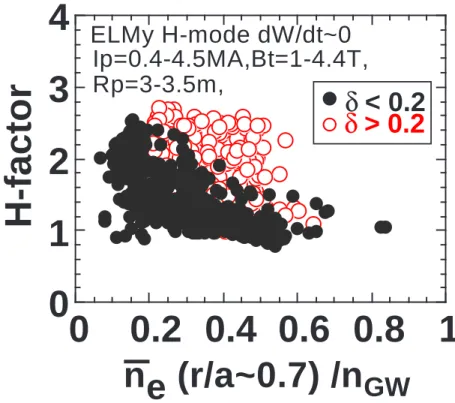
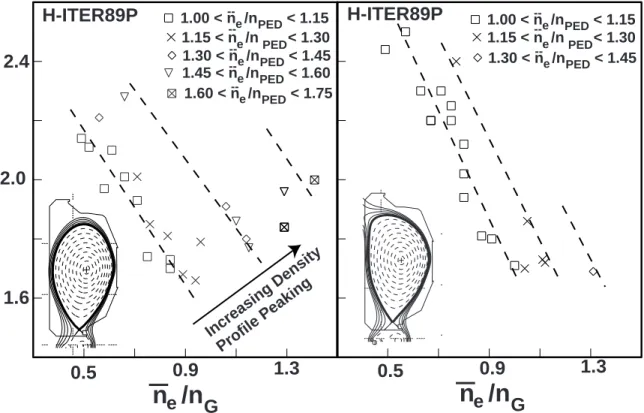
0.75 after which they drop precipitously [102, 50]. No shift to higher densities in the confinement curve is seen as the triangularity is increased, however the higher triangularity discharges have better confinement and higher pedestals overall. The degradation in H-mode confinement shows considerable variation from experiment to experiment. Plasma shape, particularly triangularity has been found to be an important variable in determining the density at which confinement begins to drop. This is likely connected to the pedestal stability which is predicted to depend on shape. Figure 6 shows data from JT-60U which demonstrates a clear increase in the density at which confinement degradation sets in as the triangularity is raised. (The H factor shown is the ratio of the measured energy confinement time, τE, to the confinement time predicted by
the L-mode scaling law, τITER89P). At low triangularity, the drop can begin as low as
0.2-0.4 nG with confinement no better than L-mode by n/ nG ~ 0.7 [89]. Confinement
degradation was held off to n/ nG ~ 0.5 at higher triangularity (δ > 0.2) [103].
JET has reported a dependence on triangularity with confinement degradation setting in at n/ nG ~ 0.5 for δ = 0.14 and at n/ nG ~ 0.8 for δ = 0.38 [90, 32] . The edge temperature
was seen to drop, but divertor detachment and MARFE formation did not account for the observed loss of confinement. The drop in edge temperature was correlated with a change in the ELMs which diminished in amplitude and increased in frequency, finally
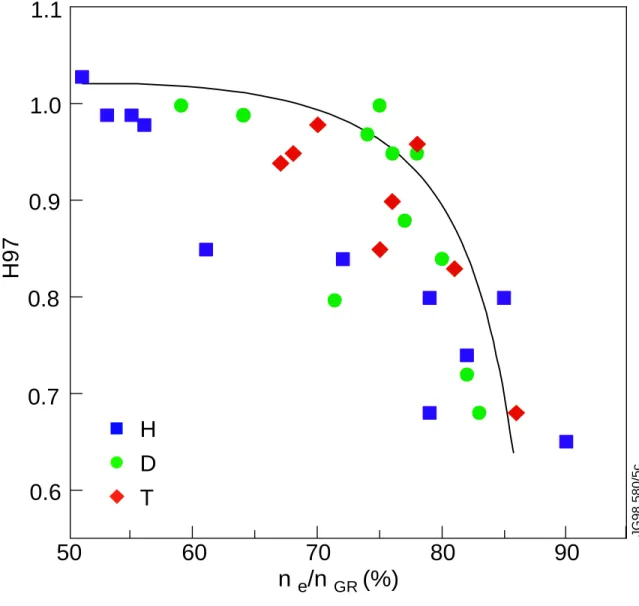
reverting to type III. The effect did not seem to depend on which hydrogen isotope was used (figure 7), input power, divertor geometry or pumping. The drop was correlated with fueling rate, with the fueling efficiency going to zero at the density limit. Radiated power increased but remained below 50% of the input power. The change in
confinement has also been correlated to a change in the relative magnitudes of the ExB shearing rate and the linear growth rate for ITG modes in the region just inboard of the pedestal [104]. At high densities, n/nG ~ 0.85, the balance shifts to the instability growth,
implying less stabilization and higher transport. ASDEX-upgrade observed the drop in confinement starting at n/ nG ~ 0.4 at low triangularity (δ ~ 0.2) and at 0.6-0.7 for high
triangularity (δ~0.3) [91, 105, 106]. The change in shape also increased the H/L limit by about 20%. Discharges near the density limit had low edge temperatures and could readily be distinguished on an edge operational space diagram from standard H-modes which maintain a constant edge pressure [98]. The pedestal temperature gradient dropped implying a significant increase in χ⊥. As the density was raised, the divertor plasma began to detach between ELMs, eventually reverting from type I to type III with confinement barely distinguishable from L-mode (though a small pedestal was clearly present). Strong gas puffing increased the density at the separatrix, but the line
averaged density saturated. In C-Mod which ran with δ ~ 0.4, degradation began at n = 0.65 - 0.7nG reaching H89 factors ~ 1 at n/nG ~ .85, where the back transition to L-mode
occurred [107]. Without density profile peaking, DIII-D found that energy confinement began to drop at about 0.6-0.7nG [50].
2.2.1.5 MHD and Disruptions
At the highest densities, the region of cool radiating plasma expands from the separatrix and intrudes into the core plasma. The closed field lines of the core plasma provide a short connecting path resulting in poloidal symmetrization of the radiating layer. In effect, the plasma now rests on a radiating gas mantle rather than on a solid limiter. This process can be stable, resulting in long-lived "poloidally detached" plasmas, but is more often unstable, leading to an uncontrolled contraction of the temperature profile. This has the effect of shrinking the current channel and destroying the MHD stability of
the discharge [57, 108]. The growth of MHD fluctuations and the termination of the discharge have been studied numerically [109-115] and experimentally [116, 55, 56, 117-120]. While the details can be complicated, involving non-linear growth and coupling of numerous MHD modes, the basic process is straightforward. Uncontrolled profile shrinkage leads to unstable current profiles driving resonant modes with large magnetic islands which break up the flux surfaces and connect the plasma directly to the wall. The growth of large islands tends to slow any mode rotation, diminishing the beneficial effects of conductive wall stabilization and accelerating the process [108]. Work from MHD simulations has suggested that skin currents, produced as the current profile shrinks, can drive large internal kink modes [113, 115]. Evidence from
tomographic Xray measurements confirms the intrusion of a "cold bubble" of plasma into the plasma core [117, 121]. The disruption itself proceeds in two steps. In the first step, heat flows along field lines now connected to the wall and quickly cool the plasma in the so called "thermal quench". The thermal plasma can now no longer support the plasma current which is transferred inductively to the vacuum vessel and support structure or to runaway electrons in the "current quench phase" [57]. The combined effects of heat from the thermal quench or deposition of runaway electrons and
mechanical forces arising from induced currents and the toroidal field can damage large devices and are a critical design concern for future reactors [122]. Attempts to influence the evolution with localized heating [119] or ergodic divertors [123] have had only limited success and have not led to higher density limits. Radical changes in wall materials have led to density limiting behavior without disruptions [37]. In this case, a strong relaxation oscillation sets in at high density involving fueling, particle balance and radiation.
2.2.2 Global scaling
Introduced in section 1, the first attempts to achieve a predictive capability for the density limit were based on empirical scaling of global parameters. While generally successful, one must keep in mind that this approach misses any local or profile
The density profile, unlike the temperature profile, shows no tendency for stiffness or self-similarity and thus may vary considerably. Discharges with significant density peaking are able to reach higher average densities than those with flat profiles. This effect constitutes an important "hidden variable" for global scaling which may attribute its effect to parameters which are correlated with the degree of profile peakedness. It is widely recognized that there are several density limiting mechanisms. For example, plasmas contaminated with large quantities of high Z impurities have fairly low density limits due to excessive core radiation. It is desirable to eliminate such "special cases" from consideration. The underlying assumption (which looks reasonable but which has not been proven) is that there is a common, well characterized limit that can be
achieved when all parasitic effects are eliminated by wall conditioning or other
optimizations. Under some circumstances, the thermal contraction which precedes the disruptive limit can be stable leading to a poloidally detached state [124, 125]. This usually occurs at densities well below the limit in cases where the plasma contains a large quantity of low Z impurities. The detached zone can be quite large, for example 5 cm out of a minor radius of 26 cm on DITE [67]. Care must be taken when comparing such discharges to empirical expressions as their effective minor radius is smaller than those attached to the wall. In these cases the plasma is effectively limited by a cool gas mantle rather than a material wall and values for the plasma radius would have to be adjusted accordingly.
Additional difficulties attend the calculation of global scaling laws for the density limit. Operational boundaries may be described in terms of global variables like total current or average density or local variables, like the edge temperature and density and their gradients. The latter are presumably the basis for the underlying physics but are more difficult to measure and not uniformly available from device to device. Moreover,
designers of future machines cannot yet predict local parameters from first principles and thus cannot make use of an operational boundary described in terms of these variables. Scaling studies typically combine data from standard operation and a
relatively few dedicated sets of experiments. Most experimental operation is carried out far from the limit so post-hoc mining of existing databases is not always sufficient. In
determining the density limit, it is tempting to draw a boundary to enclose all data points. This procedure, however, gives great weight to outliers and can be misleading. The Greenwald limit was derived so that 95% of the data had n/nG < 1 [3]. Thus by
construction, 5% of the data set used in the derivation exceeded the published limit. This figure was essentially an arbitrary one, based on pragmatic grounds; the scaling expression was derived originally to predict the maximum operating density for a proposed ignition experiment [126]. Significant covariance among the nominally independent variables often exists as well and frustrates statistical analysis. Since the goal is to obtain a quantitative description of the accessible parameter space. The potential for systematic errors in data and definitions suggests that it is wise not to carry out fits with a large number of parameters or to express the coefficient or exponents with many significant digits.
Given these limitations, the derived scaling expressions have been remarkably
successful, perhaps fortuitously. The Greenwald limit was derived from a relatively small set of data, but predicted the density limits (at least for discharges with flat profiles) for a wide range of devices that were subsequently commisioned including FTU [127, 39], JET [57, 40], DIII-D [72], TFTR [128], TUMAN-3 [11], TEXTOR [53, 48], C-Mod [54], START [129, 130], JT60-U [38], TCV [12], ASDEX-Upgrade [41], NSTX [15], MAST [27]. The last devices, large spherical tokamaks with aspect ration R/a < 1.8, may have a density limit 20-40% higher than nG, reasonably good agreement given that the
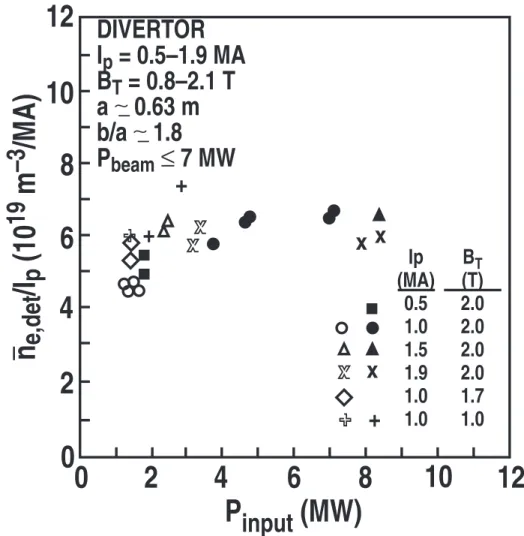
scaling law was derived for machines with a narrow range (3-5) of aspect ratios. Figures 8 and 9 show data from machines that were not part of the original scaling studies and give an idea of the agreement which has been observed. On DIII-D, a series of density limit experiments with L-mode and H-mode plasmas were performed over a wide range of plasma current, field, plasma shape and input power [72]. The basic linear scaling with plasma current was found in scans from 0.5 to 1.9 MA at constant toroidal field and plasma shape. Scans of magnetic field from 0.8 to 2.1 T at fixed current and shape and scans of elongation from 1.1 to 1.9 at constant current found no significant
dependence on the MHD safety factor q. Scans of minor radius from 0.2 to 0.67 m found a slightly stronger dependence than the empirical relation, 1/a2.4 rather than 1/a2.
It may or may not be significant that the commonly used global scaling laws for the density limit are not quite "dimensionally correct". That is, they cannot be constructed from the dimensionless variables believed to important for plasma physics namely the normalized pressure, gyro-radius and collisionality, β =nT B/ 2, ρ* =ρ/ a, ν* =νVT /a. When expressed in this form, the Hugill and Greenwald scalings have a residual R1/4, for example; 2 3 / 4 *1/ 4 1/ 4 *1/ 2 P na R I β ν ρ ∝ (2.1)
Simple modifications of the expression for nG could make it dimensionally correct for
example, 8 / 9 2 7 / 4 P P I I n or n a a ∝ ∝ (2.2)
However, both differ from the original form by a factor of about 1.5 when evaluated across the current tokamak database, and would not be consistent with data and estimated errors. The expression could be made dimensionally correct by inclusion of other dimensioned variables, an exercise which would require compilation of a
significant database and great care over data conditioning and covariance. (Note that even with much larger and better conditioned data sets, the unconstrained energy confinement scalings are only slightly more dimensionally correct [4]) . Alternately, there may be additional important non-dimensional parameters, for example those connected with atomic physics processes.
The empirical law discussed above does not describe the results of all experiments. In particular, it fails badly in those cases where the density profile is peaked. It is not
surprising that an expression based on a global quantity like the line-averaged density is unable to capture profile effects. The observation that discharges with peaked density profiles can routinely exceed the empirical limit confirms the hypothesis that the physics underlying the density limit is to be found in the edge plasma. A more complete
discussion of profile effects on the density limit can be found in section 2.2.3 below. Recent experiments from low aspect ratio tokamaks indicate that there may be higher order effects due to extreme shaping [15, 27]. New data, particularly from machines like MAST, NSTX, and TCV, will help clarify these issues. Caution must also be taken when extrapolating an empirical law far from the parameter ranges of the data from which it was constructed. The empirical law also fails to capture the weak power dependence which has been observed in some experiments (see section 2.2.4). Since these results are in machines heated by neutral beams, some care must be taken to separate the effects of heating and fueling - noting that a future reactor would not have a strong central fueling source.
2.2.3 Effects of Density Profile on the limit
While the empirical law for the line averaged density, nG, described above, has been
successful for a wide range of experiments and configurations, the density limit can be extended by operating in regimes where central fueling, edge pumping, or modification of particle transport lead to peaked density profiles. Peaked density profiles have long been associated with the suppression of anomalous transport [131-137] resulting in self-sustained regimes with improved confinement and very high central densities. Studies of pellet fueled discharges yielded densities 1.5 to 2 times the limit compared to those fueled at the edge by gas [43, 44, 46, 47]. Cryopumping [47], impurity puffing [45, 48] or spontaneous transitions [49, 50] can also lead to peaked density profiles and higher density limits. A systematic investigation on ASDEX included discharges where the density was peaked via pellet injection, neutral beam injection and transport
modification [138]. In these experiments, the edge density stayed below the empirical density limits, the increase in line average coming from particles in the plasma core. This was consistent with models which attribute the density limit to physics in the
plasma edge. Further experiments on ASDEX showed a critical edge temperature for density limit disruption [9]. Figure 10 shows data from ASDEX-Upgrade, supporting the idea that the operating regimes can be defined in terms of edge temperature and density. Particles added to the central plasma apparently don't induce density limiting phenomena.
If the central fueling is increased by very strong NBI and the edge source reduced through wall pumping, peaked density profiles can be produced. Early NBI work on DITE with gettered walls showed highly peaked profiles with peak to average values up to three [22, 6, 23, 24]. Essentially all the fueling in this case could be attributed to the beams. TFTR was able to reach 1.2nG in L-modes with strong neutral beam heating
[128] while in ASDEX-upgrade experiments with NBI, the disruptive density limit was raised to 1.4nG. DIII-D has carried out a series of studies aimed at exploring regimes
with good H-mode confinement above the empirical limit [47]. By a combination of cryopumping in the divertor and beam fueling, densities up to 1.4nG were obtained.
Peak to average densities in this case were around 1.3. Good confinement (H89 ~ 1.9)
was maintained despite a sharp decrease in edge pressure [50]. This deterioration was attributed to the loss of second stability brought about by a drop in bootstrap current at higher collisionality. Average confinement was maintained by an improvement in the core, likely the result of the peaked density profile. Achieving these conditions was difficult for several reasons, low edge confinement produced MARFEs increasing the fueling demand; the increased fueling rate led to divertor collapse; raising the magnetic field increased the L/H threshold, limiting the available operating space. The density peaking and good confinement were not sustained at high power, limiting the regime to a narrow operating window [49].
Density peaking can be accomplished most directly by deep pellet fueling [133] and can easily lead, at least transiently, to line average densities in excess of nG [139, 3, 140,
38]. By repetitive injection of small pellets, ASDEX was able to reach 1.5nG in a
quasi-steady state [43, 9]. The edge densities measured on that device remained well below the limit [9]. TFTR obtained a similar result, reaching 2nG by injection of six large
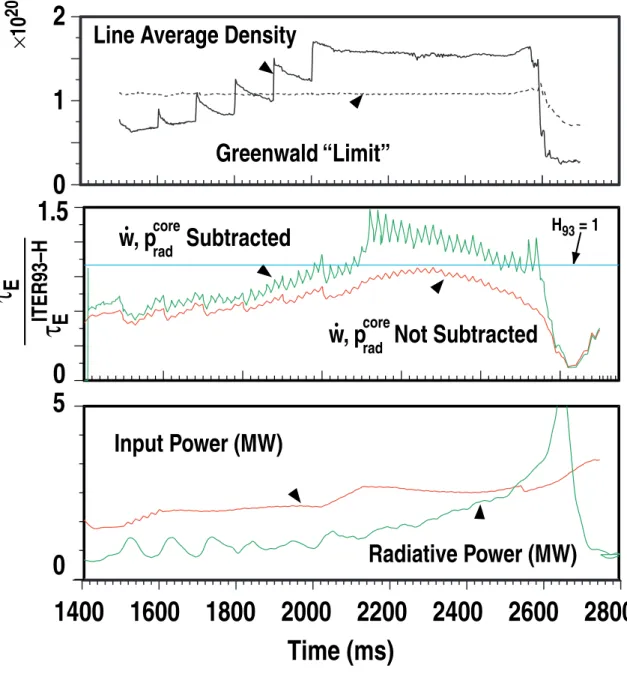
deuterium pellets [128]. ASDEX-upgrade has reached equal levels of performance with low-field launch [141] and high-field launch [142, 60], the latter showing much higher fueling efficiency even with lower velocity pellets. High-field launch also enabled operation in H-mode with good confinement at densities up to 1.5 times the limit [68]. Figure 11 shows time traces of the normalized confinement time and normalized density from experiments on DIII-D [143, 144]. A divertor cryopump was used to reduce the neutral density, keeping the edge temperature from falling, thus avoiding divertor detachment (X-point MARFES). The good confinement could not be maintained with NBI power above 3 MW. It is possible that the additional heating power lowered the core particle transport and destroyed the peaked profiles. Figure 12 shows the multi-variate dependence of density, density profile and triangularity on H-mode confinement [102].
It is also possible to obtain peaked density profiles by modifying particle transport. While this is usually accomplished in discharges with some central particle source from neutral beams, it has also been demonstrated in ohmic and RF-heated plasmas with no core fueling whatsoever [145, 146, 39, 147]. The physics which initiates this transport modification is not well understood, but is generally thought to be due to a drop in ITG growth rate via modification of the ion density profile [148, 147]. The peaked pressure profiles that result can be sustained via suppression of turbulence via sheared plasma flows [149]. Another possibility is that off axis heating in the context of marginally stable turbulence can lead to low diffusivity on axis. In the presence of even a small particle pinch, peaked profiles could result. The radiation enhanced mode (RI-mode) provides the most abundant examples of high averaged densities achieved in steady-state discharges with peaked profiles [74, 45, 150-152, 48, 14, 153, 154]. Both particle and energy confinement were improved allowing achievement of H-mode like confinement at densities up to 1.5nG [155]. (The comparison with H-mode is for illustration only;
these discharges have improved confinement via an internal rather than edge transport barrier.) The RI-mode does not seem to be degraded by input power and the achieved densities are often the highest at high power. A similar regime has been observed in ASDEX-Upgrade but includes an H-mode edge barrier [88]. Dubbed CDH for
completely detached H-mode, this regime is produced by neon puffing which creates a mantle of cold radiating plasma. It combines good confinement, high density, somewhat peaked profiles and a drop in power loading on the divertor plates [156, 98].
Operation with peaked density profiles does not eliminate the edge limit, it simply allows operation at higher averaged or peak density. This points out the care that must be taken when using global parameters like n and e τE to characterize what is essentially
local physics. Extrapolation of these results to reactor regimes is attractive but
uncertain. In principle, operation with peaked profiles can allow almost arbitrarily high central densities, limited only by MHD stability constraints on the pressure profile. On the other hand, they are based either on fueling approaches which may not scale to very large devices or on transport control techniques with incompletely understood physics. Core transport tends to degrade with additional heating power, limiting these regimes mostly to low power so far. In current experiments with NBI, heating and fueling are progressively farther off axis as the density is raised. With alpha heating, the power will be centrally peaked and provide no fueling. There are indications from current experiments that this could lead to flat profiles [157]. Shear-flow stabilization would seem to be more problematic as ρ* drops to the values characteristic of a reactor.
2.2.4 Power Dependence
The empirical limit, nG, does not include any dependence on input power or plasma
purity. Early work on NBI heating found that while higher densities were reached with auxiliary power the ratio of n/IP was constant [24]. Studies that led to the Greenwald
empirical density limit had found no significant dependence on power in a database from the Alcator-C, Doublet III, ISX, PBX, and PDX. Experiments on DIII-D (figure 13) confirmed this observation over a range in input powers up to 8 MW [72]. More recent work on DIII-D found a dependence of P0.1[46]. On ASDEX, power scans at q = 2.9 found a significant dependence with nLIMIT ~ P0.25 [7, 9]. The power dependence was
stronger at q = 2, though these discharges are near the current limit as well and could not attain densities as high as plasmas with larger q. ASDEX-Upgrade investigated the
H/L density limit, deriving a scaling with field, power and q, 0.15 0.61 0.95
/ 5.0 /( )
H L SEP
n = P B qR , where PSEP = PIN - PRAD [92, 105]. A somewhat larger
power dependence, P0.3, was seen on the L-mode disruptive limit resulting in a greater separation between the two limits at high power [68, 41]. Overall, it must be concluded that compared to the expectations from arguments based on power balance, the density limit is not found to increase strongly with input power. This result has significance for the extrapolation into the reactor regime. Since, like radiated power, fusion power scales with n2, mechanisms based entirely on impurity radiation imply no real density limit for ignited plasmas [16].
Most studies of the power scaling of the density limit have been in experiments with neutral beam heating. For these cases, the role of core fueling by the beams must be considered. The ionization source from the beams is always much smaller than that from gas impinging on the plasma edge. However, it would not be correct to conclude from this that the beams are not important in the particle balance. Low energy neutrals from molecular dissociation of hydrogen gas do not penetrate deeply, often ionizing on open field lines in the scrape-off layer. As a result, the efficiency of gas fueling is
typically 10-30 times lower than beam fueling [38]. This difference may become greater as the density limit is approached. Particle transport experiments in JET have compared NBI and ICRF heated plasmas [158]. The beam heated discharges had somewhat higher average densities and mildly peaked profiles when compared to those heated by RF. The difference could be accounted for by the change in particle source rather than any change in transport. Alcator C-Mod, which uses ICRF as its only auxiliary heating scheme, sees no dependence of the density limit on input power.
2.2.5 Impurities, isotope dependence and wall conditioning
The achievable density in a tokamak is clearly reduced when the plasmas are heavily contaminated by impurities. Wall conditioning has become a standard technique for increasing the accessible range of densities. Analysis of an early multi-machine
8.5 [159]. Achievable densities for the dirtiest plasmas were less than half of those which could be obtained at ZEFF ~ 1. Studies on Alcator-C found that the density limit
was reduced only for ZEFF > 2.5 [3]. In ASDEX, the greatest effects of wall conditioning
were seen for ZEFF > 2.5. The increase in achievable density when ZEFF was lowered
from 2.5 down to 1 was 15% at most [9]. FTU was able to reach the empirical limit after a program of baking and discharge conditioning cleaned the metallic walls of that device [127]. On TEXTOR, studies with auxiliary heating found that poloidal detachment
followed by major disruptions occurred at n/nG ~ 0.75 for ZEFF ~ 5 and dropping to n/ nG
~ 0.3 at ZEFF ~ 10, consistent with a model for radiative/thermal collapse. However, for
ZEFF < 2.5, densities up to the empirical limit could be achieved (figure 14) with no
dependence on ZEFF below this value. Experiments with auxiliary heating are crucial for
these studies, since the increase in ZEFF is accompanied by an increase in ohmic
heating power, entangling the effects of these two parameters. Lowering the atomic number of the impurities is a clear advantage, since this typically results in less power lost through radiation. Covering the walls with a layer of boron enabled operation of clean plasmas even at high input power. With uncovered metallic walls the achievable density can be much lower [10]. TCV has also shown a clear increase in the accessible density following boronization [160]. In JET, when graphite first wall components were replaced by beryllium, there was no plasma contraction and no disruption, though the density limit remained roughly the same. Instead a relaxation oscillation set in, involving radiation, fueling rates and MARFE formation [37].
For some circumstances, introduction of impurities may have a beneficial effect on the plasma, allowing good energy confinement at densities at or somewhat above the empirical density limit [152]. This phenomenon was first reported by the ISX-B group as "Z-mode" [161, 162]. In these experiments, a small amount of neon was puffed in neutral beam heated discharges resulting in peaked density profiles and somewhat improved energy confinement. These early results have been extended and explored extensively on many devices, particularly by the TEXTOR group [163, 132, 45, 150] which has referred to the regime as RI-mode, for radiative improved confinement mode. In addition to impurity puffing, RI-mode requires operation at high densities with low
recycling walls. Plasmas obtained by this recipe have energy confinement which increases roughly linearly with density and have moderately peaked density profiles. The result is reminiscent of the improved confinement regime obtained by pellet injection [164, 131] and has been attributed to a similar mechanism, namely the suppression of ITG modes [165].
The hydrogen ion isotope is not found to be particularly important for the density limit. TEXTOR reported slightly higher limits in deuterium and slightly more peaked density profiles as compared to hydrogen [166], while JET found no significant difference as the tritium content was raised [167]. ASDEX has reported significantly higher density limits for helium discharges compared to deuterium, particularly at low current where the helium discharges had very peaked density profiles [9]. NSTX has recently reported higher density limits with helium as well [15].
2.2.6 Fueling effects
Though many studies have focussed on power balance, it is important not to overlook the role of particle balance in the density limit. Gas fueling becomes less and less efficient and the neutral pressure surrounding the plasma grows exponentially as the density is raised [168, 169]. Studies of high-density operation in ASDEX-Upgrade found that the central density didn't respond at all to increases in gas puffing, while the
separatrix density increased only weakly and the SOL density increased strongly [41]. This general behavior is due at least in part to the decline in neutral penetration that occurs at high density. Above about 10 eV, the ionization and charge exchange
processes that limit neutral transport are not strong functions of temperature, yielding a mean free path (and thus the plasma source rate) for neutral penetration which is
proportional to 1/ ne. The plasma "self-shields", causing ionization to occur further out in
the plasma edge and lowering fueling efficiency. Note that this is not particularly an issue of machine size, but may depend more strongly on the magnetic field. If the figure of merit for neutral fueling is the neutral mean free path, λno, divided by the minor radius,
zero as the limit was approached has been reported in FTU [39] and JET [32]. A drop in the observed density limit for the MIIa divertor in JET was blamed on the lower fueling efficiency achieved with a closed divertor. While it is clear that the efficiency of fueling is higher for more deeply deposited particles [38], fueling dynamics also depends critically on particle transport which is only poorly understood. It is not clear at this point whether the drop in neutral penetration or changes in particle transport is more important in reducing fueling efficiency at high density.
There are practical limits to machine operations at very high neutral densities. As the fueling efficiency drops, each ion which ends up in the plasma requires more
interactions at the plasma edge. Since each ionization and charge exchange event causes energy loss, the process may ultimately be unsustainable. JET reported a drop in H-mode confinement which was correlated with the lower fueling efficiency of their Mark IIa divertor configuration [40, 170]. Machine geometry, the choice of wall materials and vessel conditioning can all play an important role in the neutral dynamics of
experiments. Materials with a strong affinity for hydrogen can lower the density through strong wall pumping. Note that in future long pulse or steady state experiments, the walls will saturate and should cease to be a factor in the fueling processes.
Overall however, observations suggest that the density limit as embodied by nG is not
due to a drop in neutral fueling by itself. For example, in cases where the neutral density is held down by strong wall pumping, the standard limit can be recovered by alternate fueling techniques [171, 172, 37]. Beam and pellet fueling alter the particle balance by moving the source into regions of lower transport. The core particle confinement time is typically measured to be the same order of magnitude as the global energy confinement time, much higher than the global particle confinement time which is dominated by edge recycling. The limitations of gas fueling relative to that of high energy neutral beams may account for the lower density limits reported at high current in DITE [6] or during early operation of JET [173], where significant power scaling was seen as well, but only with NBI. ICRF heated discharges had density limits similar to those seen with ohmic heating alone. Beams or pellet fueling can also lead to more peaked density profiles
which may allow operation at central densities higher than the empirical limit. Studies in JET showed much flatter profiles for ICRH, n(0)/ nEDGE ~ 1 than for NBI which had
n(0)/nEDGE ~ 1.2-1.3 [158]. This difference was most apparent at high densities, as
would be expected.
2.3 Reversed Field Pinch
As in a tokamak, the reversed field pinch (RFP) has a poloidal field produced by toroidal current flowing in the plasma and a toroidal field produced by external coils. The two fields are of roughly equal strength in an RFP, resulting in bad local and average curvature. To provide stability, the toroidal field is reversed near the plasma edge creating very strong magnetic shear. Consequently the MHD and transport properties can be rather different from those in a tokamak. In modern RFPs the field reversal is maintained through a turbulent dynamo effect permitting relatively long discharge times. In general, the density limit in RFPs is characterized by an increase in fluctuation levels and a slow decay of the plasma current [174, 175]. In RFX, fast termination has also been observed for IP > 0.9 MA [13]. The fast termination begins with a thermal quench,
loss of field reversal and finally to the loss of plasma current. At lower plasma currents, only the slow termination is observed. While there have been only a few dedicated studies of the density limit in the reversed field pinch configuration, sufficient data exist for quantitative comparisons between RFPs and tokamaks. Note that plasma heating in most RFP experiments is through ohmic dissipation alone so it is not possible to
separate, with certainty, effects due to power balance from those linked to the magnetic field strength.
In the RFP literature, the operating range has been parameterized by the ratio I/N, where I was the toroidal plasma current and N was the density of particles per unit toroidal length [176]. Simple algebra shows that for a circular, high aspect ratio device, this parameter is equivalent to πa I2 P/n which is proportional to nG/n, the inverse of the
normalized density using definitions from section 1.1. An "optimum range" for RFP operation was reported on ETA-BETA II with I/N ~ 1 - 1.5 10-14 A m [176].
corresponding to n ~ 0.6 - 1 nG. Extensive heating and confinement studies were carried
out in this device with n ~ nG. The quantitative similarity in the density limits between the
two devices was noted in papers which suggested that a similar mechanism might be at work for both [26, 25, 177]. Other RFPs have reported operation in the same density range, for example HBTX1A operated at 0.2 - 1.0 nG [178], OHTE, which incorporated
helical windings into the RFP configuration reached ~ 1.0 x nG [179], ZT-40M ~ 0.6nG
[180], MST ~ 0.5nG [181]. It is an interesting historical note that the earliest reports of
"quiescent" behavior in the Zeta device described operation at 0.8nG [182] .
Linear scaling of plasma density with current was found in TPE-1R(M), but at values of I/N that were about 10 times higher than that reported in other devices [183]. ETA-BETA II reported linear scaling of the limit at n ~ nG over a range in plasma current from 0.1 to
0.22 MA [184]. Perhaps the most comprehensive work on density limit scaling in the reversed field pinch has been carried out recently by the RFX group (figure 15 [13]). In these experiments, the limit matched the Greenwald scaling within about 15% over a wide range in plasma current for both "soft" and "hard" terminations, similar to tokamak disruptions. The "hard" limit was seen only for current densities higher than 1.2 MA/m2, while the "soft" limits occurred at all densities. Pellet fueling in RFX allowed the limit to be overcome, but only transiently. The I/N ratio has proved to be a good scaling quantity for other phenomena in the RFP, including the plasma β, ZEFF, energy confinement
[185, 36] and the low density limit [174, 175]. Poor performance at low density (high I/N) has been attributed to instabilities driven by large values of the streaming parameter VDRIFT/VTHERMAL [174].
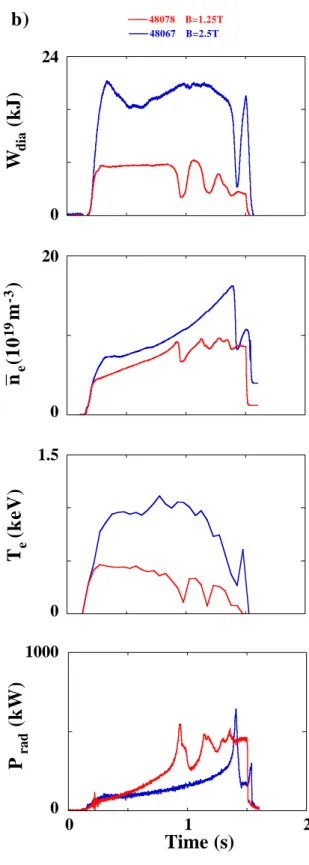
Radiation is seen to increase sharply with density in RFX, but rarely goes beyond 20-30% of the input power (figure 16 [186]). Analysis of the local power balance showed that radiation played only a minor role everywhere in the plasma. Coating the walls with a thin film of boron reduced radiated power still farther and allowed slightly higher
densities to be reached. Discharges with neon impurities deliberately added have higher levels of radiation, but essentially the same density limit [187]. These discharges are apparently not subject to fast termination even at high current. Earlier researchers on
ETA-BETA II had reported somewhat contradictory data, first suggesting that radiation is always low - on the order of 20% of the input power - though rising with density [176], then later concluding that operation at high density was associated with excessive radiation losses from low Z impurities, principally oxygen [26]. The lack of a clear result on this point may have been the result of the rudimentary diagnostics and short
discharge times that prevailed at this time. In the same time frame, radiation was found not to be a major component of power losses carrying out only about 10% of the input power in HBTX1A [178] and accounting for only about 50% of the input power in OHTE [179]. The low fraction of radiated power suggested that this mechanism is not
responsible for the density limit in RFPs, however the precipitous increase as the limit was approached leaves the question unresolved.
2.4 Stellarators
Unlike the tokamak or RFP, which are toroidally symmetric, stellarator equilibria are fully three dimensional. The rotational transform, which is necessary for toroidal
confinement, is produced by external coils resulting in greater flexibility in design though with perhaps less flexibility for an operating experiment. Despite the obvious differences between the configurations, stellarators and tokamaks show many similarities in their physics and operating regimes [188] and in their edge turbulence [189].
2.4.1 Behavior at limit
With no plasma current, the feedback between the temperature profile and MHD stability is not strong in stellarators, thus the density limit is not accompanied by a disruption as in tokamaks. Instead, a "soft" limit or quench is encountered with the plasma temperature decaying away on a confinement time scale [190, 8]. Typical thermal quench behavior can be seen in traces from the W7-AS device in figure 17. If gas puffing is reduced, it is possible for a stellarator to recover from the quench [8, 191]. The density limit in an early stellarator, CLEO, was found to be associated with energy losses from radiation by low Z impurities [192], though the densities obtained in this
experiment, on the order 0.6x10²⁰, were well below those achieved in modern
machines. Densities approaching 3x10²⁰ were achieved in the Wendelstein 7-AS (W7-AS) device following boronization [188] and extended to 3.5x10²⁰ with the installation of an island divertor [193]. In these experiments thermal collapse could be triggered by strong gas puffing or by lowered heating power in an established high density
discharge. During the collapse, a large increase in radiation from partially ionized low Z impurities was observed, similar to MARFE or poloidal detachment phenomena. While these observations suggested an important role for radiation in the limit, total plasma radiation was found to be significantly less than the input power [8]. The inferrence was that local rather than global power balance was the determining factor. By contrast, values of PRAD/PIN ~ 1 were reported in Heliotron E [194]. Pellet fueling in this device
allowed attainment of high density quasi-steady discharges, however, these were still subject to the collapse phenomena which led to rapid loss of both energy and particles. More recent data from W7-AS also show the collapse occurring when total radiation and input power are balanced [191]. In these cases, the plasma density and radiation
profiles were peaked, with core radiation from higher Z elements predominating. In H-mode, ELMs were capable of reducing impurity content by lowering particle
confinement. While ELMfree modes proceeded to a radiative collapse, ELMy H-modes could reach a quasi-steady state equilibrium.
2.4.2 Empirical scaling
Since the density limit in stellarators is not associated with disruptions, the maximum density used for scaling studies is typically the value at maximum stored energy - that is before the density limit quench sets in. Early attempts to find an empirical law for the density limit in stellarators were based mostly on data from Heliotron E [194, 190]. The result was
(
2)
0.50.25 /
LIM IN T
![Table 1 Phenomena Range of Normalized Densities (n/n LIMIT ) References MARFEs 0.4-1 [62, 64, 65, 219, 220, 34, 221, 66, 217, 222, 57, 37, 226, 71, 9, 227, 72, 224, 73, 39, 74, 225, 143, 46, 223] Divertor detachment 0.3-1 [75-81] [234, 235, 9, 72, 73, 88,](https://thumb-eu.123doks.com/thumbv2/123doknet/14675644.557891/86.918.116.791.165.765/table-phenomena-normalized-densities-references-marfes-divertor-detachment.webp)
![Figure 4 02468 0 0.2 0.4 0.6 0.8 1H-mode L-modeP [MW]sep n [10 m ] e 20 -310 Marfe LimitL → H thresholdGreenwald Limit 1.2](https://thumb-eu.123doks.com/thumbv2/123doknet/14675644.557891/95.918.148.771.147.717/figure-mode-modep-mw-marfe-limitl-thresholdgreenwald-limit.webp)