See discussions, stats, and author profiles for this publication at: https://www.researchgate.net/publication/321299859
Brief paper A soft sensor development with dsPIC implementation for water
quality monitoring
Article · January 2016 CITATION 1 READS 107 2 authors, including:Some of the authors of this publication are also working on these related projects:
Monitoring of rotating machines by vibration analysisView project
Water quality monitoringView project Mourad Benziane
Université de Bouira
14PUBLICATIONS 9CITATIONS SEE PROFILE
All content following this page was uploaded by Mourad Benziane on 04 July 2018.
Brief paper
A soft sensor development with dsPIC implementation for water quality monitoring
Mourad BENZIANE1
and Mohamed BOUAMAR2
1
Department of EE, University of Bouira, Algeria
2
University of M’SILA, Algeria
Abstract- In the field of water quality monitoring, there is a huge number of heterogeneous sensors which may be time-consuming in the measurement and processing stages. For several reasons, such as the high cost of some sensors, their number, the cleaning operation, and the calibration routines, make their proper operation hard to ensure. However, soft sensors approach can provide an effective and economic way to solve this problem. This work is part of a clean and wastewater monitoring system design, where dissolved oxygen (DO) represents a very important parameter of water quality. The measurement of DO is done conventionally by specific probes but with very strict conditions of measurement hence the emergence of prediction methods to make a soft measurement. In this paper, we propose a soft sensor allowing the DO estimation in the surface water where Artificial Neural Network (ANN) architecture is used as a prediction model. The developed model is then implemented in a dsPIC microcontroller for a possible use in a water quality monitoring system.
Keywords: Water quality monitoring, Dissolved oxygen, Soft sensor, ANN, dsPIC.
1. INTRODUCTION
Many parameters affect the quality of surface water, such as dissolved oxygen (DO), pH, temperature (T°), conductivity (C) etc. The most important factor is the concentration of DO and its value should not be too great or too small. This will have an impact on water quality. According to WHO (World Health Organization), high-quality water contains more than 7 mg / l of oxygen. It is of good quality when its concentration varies from 5 to 7 mg / l, and is mediocre at less than 3 mg / l. The DO deficiency will lead to vigorous activities, producing ammonia, nitrite, and other toxic substances. It is important to note that DO is a very important index for water quality [1]. At present, monitoring of this parameter is difficult and measurement conditions can not satisfy the demand for real-time monitoring, so its detection becomes a key issue.
Measurement of DO is conventionally carried out by using "physical" sensors. Currently soft sensors represent a new alternative for measurement.
Many techniques can be used to develop such sensors, besides artificial neural networks [2] [3], support vector machines [4] [5], hybrid methods based on optimization algorithms [6] [7] or ELM (Extreme Learning Machine [8], are all methods used for this purpose. Our objective in this work is to develop and implement a soft sensor for the DO prediction based on an ANN model. This soft sensor is developed from a few water parameters such as pH, T°, and conductivity, assumed as inputs to this model. The development will give the possibility of integrating the output calculated by this model with the system or as an
J. Automation & Systems Engineering 10-3 (2016): 180-186
181 follows: Section 2 gives the definition of soft sensors. The methodology used to design the soft sensor based on ANN technique is given in section 3. Finally, simulation and results discussion are presented in section 4.
2. SOFT SENSOR
The relation between DO and other water parameters is strongly non-linear [9]. Among the different types of possible behavior models, the ANN model has the advantage of being able intrinsically to describe non-linear relations between the input and the output variables of a system [10].
The selected database consists of actual measurements taken over several years of surface water derived from various physicochemical parameters. For this application, the following parameters: pH, T° and conductivity were taken because of their correlation with dissolved oxygen. Part of this database is devoted to the identification of the weights assigned to the connections of the ANN model; this stage known under the term of learning is none other than a step of identifying the parameters of the non-linear model. For this purpose, the dataset is separated into two groups: a group of data constituting the learning data to be covered by the determination of the weights and a group of data intended for the test phase.
3. NEURAL NETWORK ARCHITECTURE
ANNs are networks of highly connected elementary processors operating in parallel. Each processor calculates a single output based on the information it receives. Each neuron-neuron bond is associated with a weight. The development of a neural network is done in different stages as the choice of the architecture and the identification of the parameters. This last phase known as learning is none other than the identification of the parameters of a nonlinear model, by an iterative method of modifying the weights of the connections. There are two types of learning: unsupervised and supervised. Unsupervised learning relies on self-organization of the network through local rules that control the evolution of weights. Supervised learning is based on a learning dataset of input-output examples. In our case, we have daily data (dissolved oxygen content and raw water characteristics) covering a few years monitoring the quality of surface water so we opted for supervised learning. The most studied ANN architecture is the multi-layer neural network (or Multi-Layer Perceptron MLP). It consists of neurons distributed over several layers, the neurons of which are all connected to the neurons of the adjacent layers. Layers between the input and output are called "hidden layers". It was shown that a single hidden layer with a sufficient number of neurons is necessary to describe any continuous function with a given precision [10].
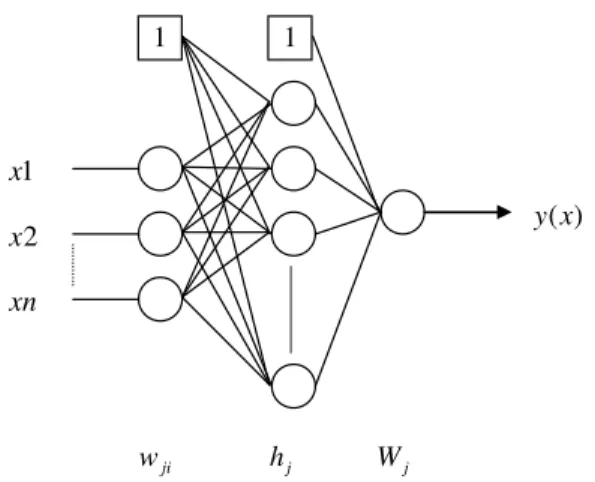
Prediction of the DO parameter is a non-linear regression problem that can be addressed using the MLP with a single hidden layer. Figure 1 shows this type of architecture with three layers: an input layer (variables of raw water quality) with n neurons, a hidden layer with h neurons and an output layer with one neuron [11] [12] [13].
1 1 ji w h j W j ) (x y 1 x 2 x xn
Figure 1 Multi-Layer Perceptron
The main function of the input neurons is to associate the values to the neurons and transmit them to the hidden layer. The neurons in the hidden layer have the ability to process the information received. Each of them performs two different operations: the weighted sum of its inputs (using the weights associated with the links between this neuron and the others in the previous layer), followed by a non-linear transformation (called activation function). The output of these two actions is then sent to the next layer which is the output layer in our case. Mathematically, if the nonlinear transformation f is identical for all neurons, the expression of the output of the multi-layer perceptron is given by:
h
j=
∑
w
jix
i+
w
j0 And
+
=
∑
= 0 1)
(
x
f
W
h
W
y
j H j j (1) jiw
are the weights between the input layer and the hidden layer and Wj are the weights between the hidden layer and the output layer.
The activation function f can be anyone, but in practice and in particular when performing supervised learning, it is necessary to have a continuous and completely differentiable function. In fact, there are several activation functions. In our case, we have a high correlation between dissolved oxygen and water parameters such pH, T°, C and our choice is a sigmoid function. Supervised learning consists in determining the network weights which minimize on all the data of the learning dataset, the deviations between the output values (measured values) and the computed output values by the network. Mathematically it consists of finding the minimum of the quadratic criterion:
2 1
)
(
1
)
,
(
∑
=−
=
N i i iy
t
N
W
w
C
(2)Where N is the number of examples of the learning dataset, W and w are the vectors of the weights of the two layers.
J. Automation & Systems Engineering 10-3 (2016): 180-186
183 optimization method. This method is well known to have an oscillatory behavior close to the solution. This is why the so-called second-order methods (based on a Hessian approximation) are preferred because they provide much better results. Among the best known are the Quasi-Newton method and Levenberg-Marquardt which is used in our case [11] [13].
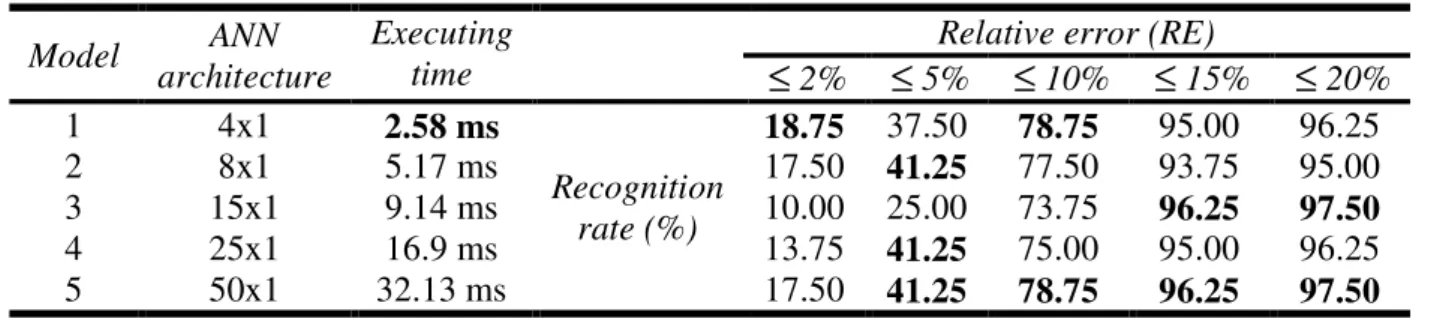
Table 1 Performance evaluation of different ANN architectures
4. SOFT SENSOR DEVELOPMENT
Simulation is carried out in two different stages: first, we develop and simulate with MATLAB the DO soft sensor and in a second stage we used PROTEUS for its implementation in a dsPIC based architecture.
4.1. Soft sensor architecture
The dataset is composed of: pH, T°, and conductivity. These parameters are correlated
with the desired output which represents the dissolved oxygen. Correlation aspect plays a predominant role in the choice of the input parameters of a soft sensor (Zacheus, O-M., Martikainen, P-J., 1997). Figure 2 shows the evolution of output (DO) and the three parameters used as inputs to the soft sensor model. Note also that 720 vectors of the dataset are used for the learning phase and 80 vectors for the testing phase.
Learning phase is done from the dataset described above This step which makes it possible to obtain the elements characterizing the network (weight and bias), uses the method of learning back-propagation based on the Levenberg-Marquardt algorithm. After a sufficient number of iterations, we obtain the weights and the biases for each of the neurons in the network. The network thus obtained is then tested with the testing data, composed of 80 vectors. The number of neurons in the hidden layer should be increased gradually in order to achieve the desired precision and at the same time avoid over-learning which may eventually degrade performance in generalization. Table 1 shows the results obtained for different ANN architectures with a single hidden layer.
Performance evaluation of these five different ANN architectures (models 1 to 5), is made with respect to the output relative error obtained for each sample. We note that the first model (model 1 with 4 neurons in the hidden layer) and the fifth one (model 5 with 50 neurons) give the best results. However, evaluation of execution time shows that the model 1 is much better compared to all the others.
Model ANN
architecture
Executing time
Relative error (RE)
≤
2%≤
5%≤
10%≤
15%≤
20% 1 4x1 2.58 ms Recognition rate (%) 18.75 37.50 78.75 95.00 96.25 2 8x1 5.17 ms 17.50 41.25 77.50 93.75 95.00 3 15x1 9.14 ms 10.00 25.00 73.75 96.25 97.50 4 25x1 16.9 ms 13.75 41.25 75.00 95.00 96.25 5 50x1 32.13 ms 17.50 41.25 78.75 96.25 97.500 100 200 300 400 500 600 700 800 6 7 8 9 P H 0 100 200 300 400 500 600 700 800 -20 0 20 40 T e m p 0 100 200 300 400 500 600 700 800 0 100 200 300 C o n d 0 100 200 300 400 500 600 700 800 0 10 20 D O
Figure 2 Evolution of the physicochemical parameters: pH, T°, C and DO
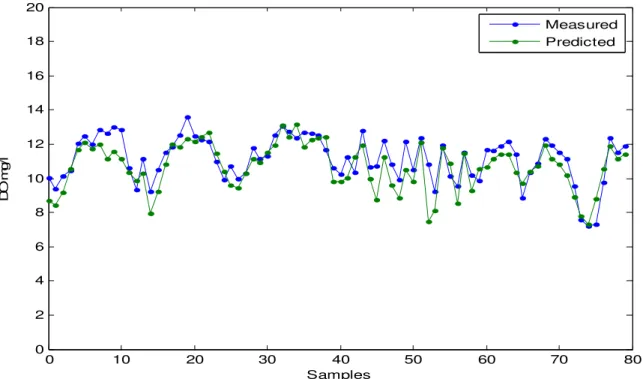
Figure 3 and Figure 4 represent the results obtained for the first ANN model and the fifth one respectively. 0 10 20 30 40 50 60 70 80 0 2 4 6 8 10 12 14 16 18 20 Samples D O m g /l Measured Predicted
J. Automation & Systems Engineering 10-3 (2016): 180-186 185 0 10 20 30 40 50 60 70 80 0 2 4 6 8 10 12 14 16 18 20 Samples D O m g /l Measured Predicted
Figure 4 Predicted and measured DO using the fifth model
4.2. Soft sensor implementation
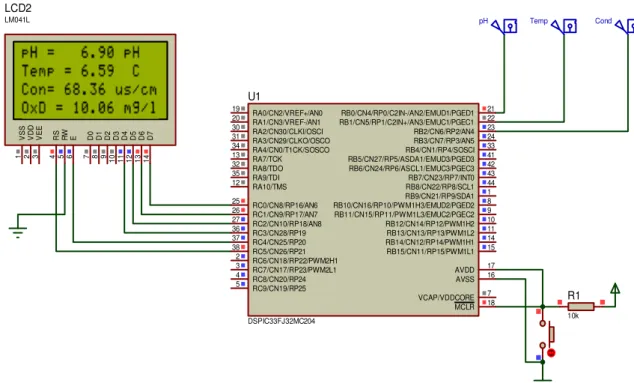
dsPICs are fast 16-bit microcontrollers dedicated to signal processing applications. These devices are used in various control and processing domains and could be adapted to many embedded "real-time" acquisition and processing applications. This could be suitable for our application where multi-channel acquisition and dynamic signal processing is conceivable. The microcontroller chosen for this application is the dsPIC 33FJ32MC204 which contains more than 35 programmable digital I/O and more than 6 analog inputs. In this work, three (03) analog inputs are used to receive the three signals (pH, temperature, conductivity) and six (06) digital outputs to control the display. A test program developed in C language makes it possible to calculate the output of the network from an input sample. The program thus produced is subsequently compiled and executed on the development tool.
To verify and validate the implemented program, another simulation is carried on PROTEUS, where a 16x4 LCD display is used to show the measurements of the three physical sensors and the calculation result obtained at the output of the soft sensor program. Figure 5 shows the simulation block diagram.
5. CONCLUSION
It is in the great interest of the water monitoring field that we have attempted in this paper to explain our application. The implementation of a soft sensor based on ANN model can serve as a means to replace a faulty sensor or to perform a measurement that is difficult to achieve by conventional methods. ANN model is therefore well suited to learning this type of database and presents an adaptation in the regression problem. The results have globally shown a very good fit of ANN architecture. The use of dsPIC to implement the developed soft sensor has given flexibility which allows the implementation of other soft sensors. Applying this type of technique could have a direct impact and economic way on the design and development of water quality monitoring systems.
RB2/CN6/RP2/AN4 23 RB3/CN7/RP3/AN5 24 RB6/CN24/RP6/ASCL1/EMUC3/PGEC3 42 RB10/CN16/RP10/PWM1H3/EMUD2/PGED2 8 RB11/CN15/RP11/PWM1L3/EMUC2/PGEC2 9 RB12/CN14/RP12/PWM1H2 10 RB13/CN13/RP13/PWM1L2 11 RB5/CN27/RP5/ASDA1/EMUD3/PGED3 41 MCLR 18 RA0/CN2/VREF+/AN0 19 RA1/CN3/VREF-/AN1 20 RA2/CN30/CLKI/OSCI 30 RA3/CN29/CLKO/OSCO 31 RA4/CN0/T1CK/SOSCO 34 RB0/CN4/RP0/C2IN-/AN2/EMUD1/PGED1 21 RB1/CN5/RP1/C2IN+/AN3/EMUC1/PGEC1 22 RB4/CN1/RP4/SOSCI 33 RB7/CN23/RP7/INT0 43 RB8/CN22/RP8/SCL1 44 RB9/CN21/RP9/SDA1 1 RB14/CN12/RP14/PWM1H1 14 RB15/CN11/RP15/PWM1L1 15 VCAP/VDDCORE 7 RA8/TDO 32 RA9/TDI 35 RA10/TMS 12 RA7/TCK 13 RC0/CN8/RP16/AN6 25 RC1/CN9/RP17/AN7 26 RC2/CN10/RP18/AN8 27 RC3/CN28/RP19 36 RC4/CN25/RP20 37 RC6/CN18/RP22/PWM2H1 2 RC7/CN17/RP23/PWM2L1 3 RC9/CN19/RP25 5 RC5/CN26/RP21 38 RC8/CN20/RP24 4 AVDD 17 AVSS 16 U1 DSPIC33FJ32MC204 R1 10k D 7 1 4 D 6 1 3 D 5 1 2 D 4 1 1 D 3 1 0 D 2 9 D 1 8 D 0 7 E 6 R W 5 R S 4 V S S 1 V D D 2 V E E 3 LCD2 LM041L pH Temp Cond
Figure 5 dsPIC implementation with PROTEUS REFERENCES
[1] Sanchez, E., Colmenarejo, M-F., Vicente, J., Rubio A., Garcia, M-G., Travieso, L., Borja, R., (2007) ‘Use of the water quality index and dissolved oxygen deficit as simple indicators of watersheds pollution’
Ecological Indicators, Vol. 7, No. 2, pp.315–328.
[2] Schmid, B-H., ASCE, M. and Koskiaho, J., (2006) ‘Artificial Neural Network Modeling of Dissolved Oxygen in a Wetland Pond: The Case of Hovi, Finland’ Journal of Hydrologic Engineering, Vol.12, No.2, pp. 188-192.
[3] Charef, A., Ghauch, A., Baussand, P., Martin-Bouyer, M., (2000) ‘Water quality monitoring using a smart sensing system’ Measurement, Vol. 28, No.3, pp.219–224.
[4] Tarmizi, A., Ahmed, A-N. and El-Shafie, A., (2014) ‘Dissolved Oxygen Prediction Using Support Vector Machine in Terengganu River’ Middle-East Journal of Scientific Research, Vol.21, No. 11, pp.2182-2188. [5] Tan, J., Dai, H., Hu, T., Wang, Yu., (2013) ‘Predicting dissolved oxygen saturation downstream of Three
Gorges dam: A support vector machine model approach’ Journal of Food, Agriculture & Environment, Vol.11, No. 2, pp.977-980.
[6] Liu, S-Y., Tai H-J., Ding, Q-S., Li, D-L., Xu, L-Q., Wei, Y-G., (2013) ‘A hybrid approach of support vector regression with genetic algorithm optimization for aquaculture water quality prediction’, Mathematical and
Computer Modelling, Vol. 58, No. 3-4, pp.458-465.
[7] Deng, C-H., Wei, X-J., Guo, L-X., (2006) ‘Application of Neural Network Based on PSO Algorithm in Prediction Model for Dissolved Oxygen in Fishpond’, Proceedings of the 6th World Congress on
Intelligent Control and Automation, pp.9401-9405.
[8] Wang, W., Deng, C., Li, X., (2014) ‘Soft Sensing of Dissolved Oxygen in Fishpond via Extreme Learning Machine’ Proceeding of the 11th World Congress on Intelligent Control and Automation Shenyang, China, pp.3393-3395.
[9] Zacheus, O-M., Martikainen, P-J., (1997) ‘Physicochemical quality of drinking and hot waters in Finnish buildings originated from groundwater or surface water plants’ The Science of the Total Environment, Vol. 204, No. 1, pp.l-10.
[10] Hennig, K., de Vries, T., Paetzold, R., Jantos, K., Voss, E. and Anders, A., (2000) ‘Multi sensor system for fast analysis in environmental monitoring with an application in waste water treatment’ Proceedings of
EARSeL-SIG-Workshop LIDAR, Dresden/FRG, pp.61-67.
[10] Hernandez, H., (2006) ‘Supervision et diagnostic des procèdes de production d'eau potable’ Thèse Préparée
au Laboratoire d'Analyse et d'Architecture des Systèmes du CNRS En vue de l'obtention du titre de Docteur de l'Institut National des Sciences Appliquées de Toulouse.