HAL Id: hal-02391896
https://hal.archives-ouvertes.fr/hal-02391896
Submitted on 6 Dec 2019HAL is a multi-disciplinary open access archive for the deposit and dissemination of sci-entific research documents, whether they are pub-lished or not. The documents may come from teaching and research institutions in France or abroad, or from public or private research centers.
L’archive ouverte pluridisciplinaire HAL, est destinée au dépôt et à la diffusion de documents scientifiques de niveau recherche, publiés ou non, émanant des établissements d’enseignement et de recherche français ou étrangers, des laboratoires publics ou privés.
Evidencing Fast, Massive, and Reversible H + Insertion
in Nanostructured TiO2 Electrodes at Neutral pH.
Where Do Protons Come From?
Yee-Seul Kim, Sébastien Kriegel, Kenneth Harris, Cyrille Costentin, Benoit
Limoges, Véronique Balland
To cite this version:
Yee-Seul Kim, Sébastien Kriegel, Kenneth Harris, Cyrille Costentin, Benoit Limoges, et al.. Evidenc-ing Fast, Massive, and Reversible H + Insertion in Nanostructured TiO2 Electrodes at Neutral pH. Where Do Protons Come From?. Journal of Physical Chemistry C, American Chemical Society, 2017, 121 (19), pp.10325-10335. �10.1021/acs.jpcc.7b02395�. �hal-02391896�
1
Evidencing Fast, Massive and Reversible H
+
-Insertion in Nanostructured TiO
2
Electrodes at
Neutral pH. Where Do Protons Come From?
Yee-Seul Kim, † Sébastien Kriegel, † Kenneth D. Harris, #,§ Cyrille Costentin, † Benoît Limoges†,*
and Véronique Balland†,*
† Laboratoire d’Electrochimie Moléculaire, UMR CNRS 7591, Université Paris Diderot,
Sorbonne Paris Cité, 15 rue Jean-Antoine de Baïf, F-75205 Paris Cedex 13, France
# NRC National Institute for Nanotechnology, Edmonton, Alberta, Canada T6G 2M9 and
Department of Mechanical Engineering, University of Alberta, Edmonton, Alberta, Canada T6G
2V4 .
2 ABSTRACT.
Ongoing developments of sustainable energy technologies based on high-surface area
semiconductive metal oxide electrodes operating under mild and safe aqueous conditions,
requires deep understanding of proton and electron transfer/transport throughout their porous
structure. To address this issue, we investigated the electrochemical reductive protonation of
high surface area nanostructured amorphous TiO2 electrodes (produced by glancing angle
deposition) in both buffered and unbuffered aqueous solutions. Quantitative analysis of the two
charge storage mechanisms was achieved, allowing proper deconvolution of the electrical
double-layer capacitive charge storage from the reversible faradaic one resulting from the
proton-coupled reduction of bulk TiO2. We evidence that this later process occurs reversibly and
extensively (up to an intercalation ratio of 20%) not only under strongly acidic pH conditions but
also, more interestingly, under neutral pH with the intercalated proton arising from the buffer
rather than water. Moreover, we show that in comparison with reductive Li+ intercalation, the
proton-coupled electron charge storage occurs more rapidly (in a few seconds). This important
finding suggests that a high-rate and high-power charge storage device could potentially be
achieved with the reversible H+-coupled charge/discharge process in TiO2 at neutral pH, opening
3 INTRODUCTION
TiO2-based mesoporous semiconductive electrodes have attracted exponentially-increasing
attention in the past decades. The unique electrical, optical, and chemical properties of TiO2
(including low-cost, high availability, low toxicity, and excellent chemical/photochemical
stability) makes it a prime candidate in the large-scale fabrication of transparent high-surface
area electrodes, and also enables an increasing range of applications in which mesoporous TiO2
electrodes play a central role.1,2 Among the most promising applications are the dye-sensitized
solar cells (DSSC),3 rechargeable lithium-ion batteries,4,5 gas sensors,6 electrochromic smart
windows,7 self-cleaning surfaces,8 and photo(electro)catalytic processes for fuel generation9,10 or
pollutant remediation.11 A large fraction of these applications typically require operation in dry,
aprotic organic solvents (e.g. DSSC or lithium-ion batteries), which leads to issues for the
environment and safety, and in some cases for long-term stability. With the increasing demand
for eco-friendly and sustainable technologies, there is thus a need to work toward systems
operating in aqueous electrolytes and ideally under non-corrosive conditions. Consequently,
growing efforts have been made recently towards the design of TiO2-based aqueous DSSCs12,13
and aqueous ion-insertion batteries,14,15 but also the development of TiO2-based
photoelectrocatalytic aqueous cells for water-splitting,9 CO2 reduction,10 biocatalysis,16 and
biosensing.17
Significantly, many of the above applications incorporate complex processes of charge carrier
generation, separation, transport and recombination in the metal oxide films which are currently
not fully understood and predictable. This is particularly true for mesoporous TiO2 electrodes
operating in aqueous media, wherein the complex interplay between electron and proton
4
applying negative bias to a TiO2 electrode in strongly acidic conditions (pH < 2), protons have
the ability to not only adsorb at the TiO2/solution interface, but also to intercalate within the
metal oxide lattice according to reaction 1.1
TiO2 + x e- + x H+ HxTiO2 (1)
(where x is the maximal mole fraction of protons that can be inserted in the metal oxide lattice)
This process is also often referred to as electrochemical doping of the semiconductor. It has been
reported over a wide range of TiO2 film morphologies and crystallinities, mostly anatase
nanocrystalline films18 or nanotube arrays,19–21 but also rutile,22 mixed anatase-rutile,23,24
nanostructured films and amorphous TiO2 nanotube arrays.21 Accordingly, proton
insertion/intercalation appears as a general feature of mesoporous TiO2 films
By analogy to Li+ intercalation in TiO2, proton intercalation is assumed to result from local
compensation of the loss of charge that is generated during the formal reduction of TiIV sites into
TiIII in the bulk material,24 a process associated to a strong electrochromic effect which
interpretation is still a matter of debate.18,22,24–26 Proton intercalation can thus be expected,
similarly to Li+, to lead to a strong increase of the electron storage capacity of TiO2 under
accumulation conditions.27,28 In contrast to Li+ intercalation in TiO2 that has been the subject of
intense research due to its fundamental role in lithium-ion intercalation batteries,5 H+ insertion in
TiO2 has been much less investigated and many questions remain unanswered. For instance, the
insertion speed, reversibility and long-term cyclability have not been determined. It is moreover
not clear which parameters influence the extent of proton insertion, at which potential it occurs
and if strongly acidic condition is a necessary prerequisite.
The purpose of the present work is to answer these questions by investigating the
5
solution in the presence of either a strong acid (HCl) in an unbuffered solution or a weak acid in
a neutral buffered solution (HEPES buffer). Nanostructured TiO2 films were prepared by
glancing angle deposition (GLAD) on planar ITO conductive substrates, a vacuum-based
physical vapor deposition method allowing well-controlled and reproducible batch-to-batch
sample fabrication.29 GLAD-TiO2 films also have the advantage of an open, solution-accessible
porosity, allowing a relatively free and fast diffusion of chemical species throughout the void
volume of the film. These nanostructured transparent TiO2 electrodes are thus quite
advantageous for quantitative analyses of factors that may affect the coupled proton-electron
transfer/transport in TiO2 using combined optical/electrochemical techniques such as cyclic
voltabsorptometry.30 As will be shown in the present work, we were able to clearly distinguish
between two charge storage mechanisms. The first is purely capacitive and related to charging of
the electrical double-layer capacitance when the electrode is converted to its fully conductive
state at negative bias potentials. The second storage mechanism occurs at a well-defined formal
potential, negative with respect to the conduction band, and corresponds to a faradaic process
associated with reductive proton intercalation in the solid phase of TiO2. We demonstrate that
this faradaic electron storage process is fast, electrochemically reversible, diffusion controlled,
and occurs extensively at a well-defined potential not only under unbuffered strong acidic
conditions but also, more remarkably, under neutral pH conditions in a buffered solution.
MATERIALS AND METHODS
Chemicals and Materials. HEPES, HEPES sodium salt (puriss. p.a.), and lithium perchlorate
(puriss. p.a.) were purchased from Sigma-Aldrich. Potassium chloride (Merck & Co., puriss.
6
with highly purified water (18.2 MΩ∙cm) obtained from a TKA MicroPure UV purification
system.
GLAD-TiO2 mesoporous electrodes. Mesoporous 1-µm TiO2 thin films were prepared on
commercial tin-doped indium oxide (ITO) conducting glass (Delta Technologies, 8-12 /) by the glancing angle deposition (GLAD) method followed by thermal treatment. Briefly, TiO2
films were deposited from TiO2 evaporant (Cerac, 99.9% pure rutile) in an electron-beam
physical vapor deposition system (Axxis, Kurt J Lesker). Throughout the deposition, substrates
were maintained at a 72° angle with respect to impinging evaporant flux while rotating as a
feedback-controlled function of the deposition rate. Following deposition, TiO2 was annealed at
100 °C for 24 h to ensure stoichiometric TiO2 films and as a result, to enhance and stabilize the
optical transmission of the film. Prior to electrochemical experiments, the electrodes were treated
with UV/O3 (UV/O3 ProcleanerTM plus, Bioforce nanosciences) for 15 min, and further cleaned
by subsequent immersion at room temperature in acetone and ethanol for 15 min and 30 min,
respectively. A portion of the TiO2 surface was then delimited with an insulating layer to define
square working electrode areas of 0.30 ± 0.02 cm2 (evaluated from a set of N = 10 independent
electrodes). In the case of experiments conducted in HEPES buffer, GLAD-TiO2 electrodes were
first washed in water and then pre-equilibrated in a 50 mM HEPES buffer solution (including 0.3
M KCl, pH 7.0) overnight before use.
Spectroelectrochemistry. The spectroelectrochemical experiments were performed in a
one-compartment electrochemical cell using an Autolab PGSTAT-12 potentiostat controlled by
GPES-4 software and coupled to a TORUS UV-visible spectrophotometer (Ocean Optics)
7
experiments, the electrochemical cell was thermostated at a constant temperature of 25°C using a
dedicated Peltier-heater (Quantum Northwest). The potentiostat and spectrophotometer were
synchronized through an input trigger signal generated by the potentiostat, thus allowing
simultaneous recording of the optical absorbance and current as a function of the time-varying
potential applied to the working GLAD-TiO2 electrode. Electrodes were inserted in a 1 cm
path-length quartz cell, and the working TiO2-coated ITO electrodes were positioned perpendicular to
the optical path in the cell. The cell was filled with 1.2 mL buffer solution and thoroughly
degassed by bubbling argon (for at least 20 min) prior to each experiment. An Ag/AgCl electrode
in 3 M KCl (WPI, Dri-Ref, +0.2 V vs. NHE at 25°C) was used as the reference electrode, and a
Pt wire was used as the counter electrode. Unless otherwise stated, all noted potentials are with
respect to the Ag/AgCl reference electrode. Integration time was fixed to 3 ms and satisfactory
signal-to-noise ratios were obtained by averaging 7 scans for experiments performed at 50
mV∙s-1 and 100 mV∙s-1, or 4 scans for experiments performed at 200 mV∙s-1 – 1 V∙s-1. The
average value of ohmic drop compensation was 45 ± 9 Ω (N = 12). During experiments, argon
was continuously flowed over the solution. Experimental reproducibility is attested by the good overlap of cyclic voltamograms recorded under identical experimental conditions for different
GLAD-TiO2 electrodes arising from different GLAD deposition batches (Figure S1, relative
standard deviation RSD < 5%, N = 7). The reproducibility of the corresponding cyclic
voltabsorptograms was not as good (RSD < 40%), suggesting a higher sensitivity of the
absorbance measurement to batch-to-batch variations in the GLAD-TiO2 samples. Experimental
derivative cyclic voltabsorptograms were smoothed using a second order Savizky-Golay
8 RESULTS AND DISCUSSION
GLAD-TiO2 films. All experiments were carried out with 1-m-thick amorphous TiO2
mesoporous films deposited by glancing angle deposition (deposition angle of 72°) on flat
conductive ITO surfaces (Figure 1). Nanostructured GLAD-TiO2 films exhibit a high density of
vertically aligned nanosized columnar structures, with a well-opened mesoporosity and
controlled film thickness. From the volumetric mass density of the film (i.e. 2.5 g cm-3) and the
bulk density of compact amorphous GLAD-TiO2 film (3.8 g cm-3 for a TiO2 film prepared with a
0° deposition angle)29, a film porosity P of 0.34 can be estimated. A film surface area enhancement (SA) of 540 per μmfilm thickness was deduced from BET krypton gas adsorption
isotherms.29 It has been previously established that SA increases linearly with film thickness,29,31
while nanorod diameter and intercolumn spacing follow power-law growth patterns.32 In order to
estimate the mean nanorod diameter (that is difficult to infer from Figure 1), we have considered
a simplified geometrical representation of the GLAD films by assuming an array of uniform
cylindrical nanorods homogeneously distributed perpendicular to the underlying flat ITO
surface. According to this simplified picture, the mean nanorod diameter d and nanorod surface
density were roughly estimated from both P and SA by solving the following set of two linear equations:
4
10 4
SAd d and 1 P
d2 4. Using the experimentally determined values of P and SA, the mean nanorod diameter and number density of 5 nm and 3.3 × 1012 cm-2were calculated, respectively.
Spectroelectrochemical studies in aqueous solution. GLAD-TiO2 electrodes were investigated
by the coupled techniques of cyclic voltammetry and cyclic voltabsorptometry, which allow
9
during cyclic potential scans at the semiconductive films.30 Experiments were conducted in
aqueous solutions containing a fixed concentration of KCl (0.3 M) as a supporting electrolyte.33
The influence of different concentrations of two soluble proton donors were studied, either (i)
free protons (i.e. H3O+) resulting from the addition of HCl in water (pH values ranging from 7 to
1.85, equivalent thus to [H3O+] concentrations ranging from 10-7 to 0.014 M), or (ii) the acidic
AH form of the HEPES buffer at pH 7 (the concentration of which was altered by changing the
buffer concentration CB from 0 to 0.86 M with [AH] = CB/1.3 at pH 7). The simultaneously
recorded cyclic voltammograms (CVs) and cyclic voltabsorptograms (CVAs, monitored at 780
nm) under different proton donor concentrations and pHs are reported in Figures 2, S2 and S3.
Cyclic scans were systematically initiated at anodic potentials where the semiconductive TiO2
films were insulating. The potential was then increased to sufficiently cathodic potentials where
TiO2 was fully converted into a metal-like conductive film, and then the potential sweep was
reversed to recover the initial insulating state. During the charging process (forward scan), all
CVs and CVAs share some common features (Figures 2, S2, and S3). First of all, the current
recorded at the beginning of the forward cathodic scan is very small and nearly constant,
engendering no significant absorbance change at 780 nm. These observations indicate that TiO2
behaves as an insulator within this potential window, and that the small recorded current on the
CVs only arises from the double-layer charging capacitance of the underlying exposed ITO
surface. At negative potentials to -0.60 V at pH 7.0 (or -0.30 V at pH 1.85), the exponential
increase of current in CVs reflects both the progressive filling of electronic states that are
localized in traps distributed in the band gap of TiO2 and the filling of extended conduction band
states when the applied potential becomes sufficiently negative (i.e., when it is raised close to the
10
Ag/AgCl at pH 1.85).25 This transition thus characterizes the increase of the Fermi level of
electrons in the TiO2 film and also the transition from an insulating to a conductive state by
increasing the chemical capacitance (Cchem) of the semiconductive material. (To preserve the
electrical neutrality, negative charges accumulated in TiO2 are assumed to be compensated by
electrosorption of cations at the metal oxide interface).1,34 This process is associated with a
simultaneous increase of the TiO2 film absorbance monitored at 780 nm. Accumulated electrons
can thus be quantitatively analyzed in CVs through the exponential increase of current occurring
from an onset potential less negative than ECB, but also in CVAs through absorbance increase in
the near-IR region from the same onset potential (an increase which linearly scales with the
amount of electrons accumulated in the semiconductive material).18,26 As attested by complete
restoration of the initial metal oxide transparency upon scanning the potential back in the anodic
direction, the charging/discharging process is fully reversible under the present experimental
conditions, indicating complete removal of all injected charges. The onset potential at which
both current and absorbance start to increase is pH dependent, showing a 60 mV anodic shift per
unit of pH decrease, fully consistent with the reported Nernstian pH dependence of the TiO2
conduction band edge.35,36 The potential at which the amorphous GLAD-TiO2 electrode becomes
fully degenerate at pH 7.0 (i.e., at E < -0.75 V vs. Ag/AgCl, corresponding also to the transition
from the exponential growth of the current to a constant double-layer capacitive current) is also
consistent with the ECB reported for sintered nanoparticulate films of anatase at the same pH
(-0.8 V vs. SCE).25 One may however notice that the onset potential at which the film transitions
from an insulating to a conductive state is steadily downshifted as the scan rate is increased,
suggesting a transition process which does not occur at thermodynamic equilibrium within the
11
delivery of electrons to the semiconductive material that for the moment we cannot clearly
interpret and which is beyond the scope of this work.
Once the applied potential lies within the potential window corresponding to the fully conductive
state of TiO2, shapes and magnitudes of both CVs and CVAs exhibit strong differences and
changes as a function of the proton donor concentration (Figures 2, S2, and S3). Two distinct
behaviors can be clearly identified as detailed below.
Low proton donor concentrations (unbuffered aqueous solutions of pH > 3.5 or poorly buffered aqueous solutions with [AH] < 5 mM). For very low acid concentrations and for
potentials more negative than the conduction band edge of TiO2, CVs display a
rectangular-shaped current response almost independent of the applied potential and scaling linearly with the
scan rate (Figures 2 and also Figures S2, S3 wherein CVs are normalized to the scan rate). This
behavior is typical of the double-layer capacitive charging current that can be recorded at a high
surface area electrode immersed in an inert supporting electrolyte (differing from the chemical
capacitive charging current by its independence from the applied potential). This is corroborated
in CVAs by the near overlap of absorbance change between the forward and backward potential
scans at 0.1 V∙s-1 (absence of significant hysteresis), a behavior that is reminiscent of a fast charging/discharging of a double-layer capacitive current. Since the double-layer capacitance
(Cdl) is connected in series with the chemical capacitance, it can only be assessed when Cchem >>
Cdl (i.e., at potentials more negative than the ECB of TiO2).30,34
It is worth mentioning that CVs normalized to v at neutral pH (Figures S2) do not all completely
overlap in the lowest range of negative potentials; under -1.1 V, a small rise of current is
12
this arises not from the hydrogen evolution reaction (HER) as often assumed, but from the
reductive coloration of the underlying ITO substrate, a phenomenon that was recently ascribed to
the reductive formation of metallic nanoparticles of indium and tin at the ITO surface and which
strongly depends on the electrolyte composition and pH.37,38 Control CV experiments were thus
performed at bare ITO electrodes under the same experimental conditions as those for
GLAD-TiO2 electrodes, and the same increases in current and absorbance were observed at potentials
more negative than -1.0 V (not shown).
The above results allowed us to conclude that when the applied potential is more negative than
ECB and when there is no significant concentration of free protons or weak acid in solution, the
GLAD-TiO2 electrode behaves like a high surface area electrical capacitor. Assuming that at low
proton donor concentration the CV current is purely capacitive at pH 7.0 in the potential window
-0.7 to -1.1 V, an average electrical capacitance density of 18 ± 2 mF∙cm-2 (i.e. normalized to the geometric electrode area) can be inferred (which also corresponds to a specific double-layer
capacitance of 72 F∙g-1), which is far more than expected for a standard flat conductive electrode in an electrolyte solution (10-40 F∙cm-2).39,40 The value is, however, consistent with the large specific surface area generated by the quasi-metallic GLAD-TiO2 films at these potentials. Once
corrected for film surface area enhancement (i.e. 540 µm-1), an intrinsic capacitance density of
33 F∙cm-2 was found for the degenerate semiconductive film, a value that is close to the theoretical one (10-20 F∙cm-2) calculated for a flat conductive surface in an aqueous electrolyte solution.41 The measured capacitance density, however, is in the lower end of values previously
reported for nanocrystalline films of TiO2 in aprotic solvents (30-120 F∙cm-2),42–44 which is
unsurprising in light of the fact that all of the previously-reported intrinsic capacitances were
13
of the true capacitive contribution on account of their intercalating faradaic contribution to the
current. Another factor that can also significantly affect a reliable evaluation of the intrinsic
capacitance density is the extent of correlation between the inner surface area of the
nanostructured electrode (i.e., measured using the BET measurement, see Materials and Methods
section) and the effective electroactive surface area.
High proton donor concentrations (unbuffered aqueous solutions with pH < 3.5 or buffered aqueous solutions with [AH] > 5 mM). Upon either increasing the buffer concentration (up to
860 mM at pH 7) or decreasing the pH below pH 3, the shapes and magnitudes of
current/absorbance changes in CVs/CVAs are strongly modified and increased for cathodic
potentials wherein TiO2 is conductive (Figures 2, S2 and S3). The strong increase in current is
linked to the growth of a broad reversible wave on top of the capacitive current. Depending on
the pH, this reversible wave is centered on formal potentials (E0) of -1.06 V vs. Ag/AgCl at pH
7.0 (0.1 M HEPES) and -0.68 V vs. Ag/AgCl at pH 1.85 (Figure 2 and Table S1), exhibiting thus
a shift of -74 mV per unit of pH, which is again reminiscent of the -60 mV pH dependence of the
ECB of TiO2.1,36 The current of this reversible wave is clearly not proportional to the scan rate as
shown from CVs normalized to v in Figure S2 and S3. In order to further analyze this wave, CVs
recorded at different proton donor concentrations were systematically corrected for the
electrochemical double-layer capacitance contribution by subtracting the CVs obtained under
negligible proton donor concentration (i.e. by subtracting the CVs in 0.3 M KCl). Once corrected
for capacitive current and normalized to v, the resulting CVs gathered in Figure S4 show good
overlap, especially in terms of magnitudes of cathodic and anodic peaks. These results clearly
demonstrate that the reversible wave is proportional to v over the entire range of buffer
14
occurrence of a reversible faradaic process rate-limited by diffusion-controlled mass transport.
On account of its E0 position, strong dependence on proton donor concentration, and also
diffusion-controlled response, the reversible wave can be reasonably ascribed to the reversible
faradaic reduction of TiIV sites in the metal oxide lattice coupled with proton uptake for local
charge compensation. Depending on the experimental conditions, this proton-coupled electron
transfer reaction, when fast, can be assumed to be rate-limited either by the solid-state diffusion
of protons inserted within the TiO2 lattice or by the solution diffusion of proton donors in the
bulk electrolyte. This process is formally equivalent to the Li+-coupled electron transfer reaction
occurring in intercalation metal oxide materials, a process that has been and continues to be
widely studied based on its great importance in the field of Li-ion batteries.4,5 Compared to the
CVs reported in literature for Li+ intercalation in nanocrystalline TiO2 films, it is remarkable
here to note the rather high electrochemical reversibility of proton intercalation (characterized by
a small potential separation between the anodic and cathodic peaks, i.e. Ep < 0.23 V at 0.1 V∙s -1, see Table S1), as compared to corresponding reports for Li+-intercalation in nanocrystalline
TiO2 films (Ep > 0.4 V at CV scan rates < 10 mV∙s-1).43–45 The poor reversibility of lithium ion
intercalation is often associated with crystallographic phase changes during the faradaic process,
so the good electrochemical reversibility we observed here for H+ intercalation suggests that
crystallographic variations may not be a major issue. The disordered structure and defects in
amorphous TiO2 may also contribute to facilitate the interfacial proton-coupled electron transfer
reaction.
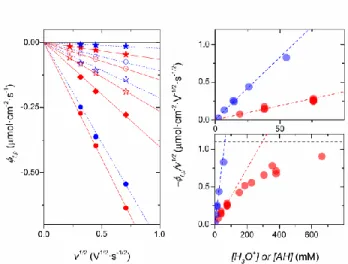
In order to get deeper insights into the diffusion-limited faradaic charge storage process, the
electron flux density of the cathodic peak f,p, normalized to v, was plotted as a function of the
15
remains low, the data clearly show a linear relationship which is indicative of a process
rate-controlled by the diffusional mass transport of proton donors in the electrolyte. Upon further
increasing the proton donor concentration (i.e. > 100 mM), a progressive deviation from linearity
with a tendency to asymptotically reach a maximal value at high buffer concentrations is
well-discerned at pH 7.0. That the diffusion-controlled cathodic peak current is independent of the
proton donor concentration at high buffer concentrations, but still proportional to v, allows us
to conclude that the faradaic process is now rate-controlled by the solid-state diffusion of protons
within the TiO2 lattice, rather than by the mass transport of proton donor in solution (the latter
being sufficiently fast to support the redox process at the interface under these conditions). Such
a transition from one limiting case to the other was unfortunately not observable under acidic pH
conditions for the reason that we were unable to perform CV experiments at pH < 1.0 without
generating an irreversible loss of the electrical properties of TiO2 together with a concomitant
and permanent coloration of the metal oxide film. (This blue/black coloration was observed after
exceeding a certain charge accumulation threshold or upon scanning the potential into
excessively negative values). Such an abrupt alteration of the physico-chemical properties of
TiO2 might be related to a significant structural/morphological change of the metal oxide lattice,
which under strong electron/proton accumulation may lead to delamination or breakage/collapse
of the GLAD-TiO2 film.
From the above experimental observations, it can be concluded that the charging/discharging
process related to the reversible proton-coupled reduction of TiIV ions can, depending on the
experimental conditions, be rate-limited by any of (i) the mass transport of proton donor in
solution, (ii) the solid-state diffusion of protons in the TiO2 lattice, (iii) the interfacial
16
Another important finding from the above results is that the aqueous solvent is an ineffective
proton donor in comparison to the acidic form of HEPES or H3O+. This might be explained by
the very low acidity of water (pKa = 14 which is 6.5 orders of magnitude higher than the pKa of
the HEPES buffer), which would suggest that the thermodynamic ease with which the proton
donor can deliver a proton to the metal oxide is a key factor in the proton intercalation
mechanism.
Intercalation process. The proton-coupled reduction of TiIV is assumed to be induced at the
metal oxide/electrolyte interface. It thus involves the soluble proton donor locally available at
this interface, which according to the experimental conditions, can be either free protons in
solution or the acidic form [AH] of the buffer (in the present case, the zwitterionic protonated
form of HEPES). We can thus write the following electron transfer reactions at the metal oxide
interface for each proton donor:
TiIVO2 + e- + H3O+ TiIII(O)(OH) + H2O (2)
TiIVO2 + e- + AH TiIII(O)(OH) + A- (3)
These reactions are expected to occur more favorably at grain boundaries where interfacial TiIV
sites are more accessible and solvent-exposed.46 According to the high specific surface area of
GLAD-TiO2 electrodes and the high surface concentration of TiIV ions, these reactions are
assumed to provoke massive consumption of the proton donor present at the metal
oxide/electrolyte interface (i.e., in the void volume of the porous film). Under these
circumstances, consumption is sufficient to rapidly induce rate-limitation by the mass transport
17
proton donor is low, thus leading to a current response of the diffusion-controlled reversible
wave linearly dependent on the soluble proton donor concentration.
Once surface TiIV sites are reduced and charge compensated by protonation, we can assume that
the paired electron/proton couple (e-/H+) can be transferred between adjacent titanium ions
localized in the sub-surface region of the amorphous TiO2 material, formally according to the
following electron-proton transfer reaction:
TiIVO2 + TiIII(O)(OH) TiIII(O)(OH) + TiIVO2 (4)
This mechanism of charge transfer propagation throughout the metal-oxide lattice can be
assumed to be equivalent to a diffusion-like process considering an isotropic random walk of
e-/H+ throughout the TiO2 lattice. (It is worth noting that in this process, electrons may not
originate from hopping electron transfer reactions between adjacent titanium ions, but rather
from transfer with electrons accumulated in the delocalized states of the conduction band.
Therefore during this e-/H+ migration, only protons can truly be considered to hop between
adjacent titanium sites.) To determine the rate of this solid-state diffusion-like process, it is
essential to ensure that the mass transport of proton donor in solution does not play a role. Such a
situation is encountered in Figure 3 when the magnitude of the reversible wave is nearly
independent of the proton donor concentration.
The linear relationship observed between f,p/v1/2 and the soluble proton donor concentration,
[H], at low and intermediate concentrations, in Figure 3 (i.e., < 100 mM) is typically associated
with the first situation where the diffusion-controlled reversible current response is limited by
18
reversible proton-coupled electron transfer reaction), the following Randles-Sevcik equation can
applied for both reactions 2 and 3 at low proton donor concentrations:40,47
, , , 1 1 2 2 0.4463 H f p f p H out i F D RT v FSv (1)where f,p and if,p are the faradaic peak flux density (C∙mol-1∙cm-2) and peak current (A),
respectively, v is the scan rate (V∙s-1), S is the delimited geometric electrode area (or projected electrode area, cm2), DH,out is the diffusion coefficient of proton donor in the bulk aqueous
solution (cm2∙s-1), and [H] is the concentration of proton donor in solution (mol∙cm-3). The geometric electrode area is utilized in this equation due to the fact that the diffusion layer
thickness of soluble proton donor is much larger than the 1-µm film-thickness of GLAD-TiO2
within the range of scan rates used in the present study. From the linear regression fit of eq 1 to
the linear part of experimental plots in Figure 3, it becomes possible to determine the diffusion
coefficient DH,out of each proton donor we have investigated. Diffusion coefficients of 3 10-5
cm2∙s-1 and 1.5 10-6 cm2∙s-1 were found for H3O+ and the protonated form of HEPES,
respectively. These values are in good agreement with the diffusion coefficient values reported in
the literature (i.e. 2.3 10-5 cm2∙s-1 for H3O+ 48,49 and 6.2 10-6 cm2∙s-1 for HEPES,50 both at
25°C).
In highly concentrated solutions of proton donor, it was not possible to definitely reach the
limiting case where f,p is uniquely rate-controlled by the apparent diffusion of H+ in TiO2,
however, the apparent diffusion coefficient of protons within the metal oxide lattice could be
estimated from the maximal electron flux density that was extrapolated at high buffer
19
and must be modified to consider reaction 4 as the rate-limiting diffusion-like process. On
account of the small solid-state diffusion coefficients reported for cations in TiO2 (10-13–10-17
cm2∙s-1), 42–44,51–55 the diffusion length of H+ within the bulk metal oxide is expected to be much
smaller than the smallest dimension of nanorods (5 nm diameter) such that the proton gradient
can be considered as a semi-infinite linear diffusion-like process occurring normal to the metal
oxide interface (i.e., normal to the vertical walls of the nanorods). Under these conditions, the
following Randles-Sevcik equation can be used (assuming again a Nernstian redox reaction):
, , 0 , 1 1 2 2 0.4463 f p f p e H in Ti i F S D xC RT S v FSv (2)
where Se (in cm2) is here the specific electroactive surface area of the mesoporous electrode,
DH,in (in cm2∙s-1) is the apparent diffusion coefficient of H+ within the metal oxide lattice, 𝐶𝑇𝑖0
(0.048 mol∙cm-3) is the maximal concentration of titanium ions in amorphous TiO2, and x is the
maximal mole fraction of protons that can be inserted in the fully reduced phase HxTiO2. This
equation can thus be used to calculate the diffusion coefficient of H+ within the TiO2 lattice using
the limiting value of f,p/v1/2 extrapolated in Figure 3 (dotted black line, f,p/v1/2 = 1.1 10-6 mol
cm-2∙s-1/2∙V-1/2). Two issues must, however, be considered. First, an appropriate estimate of the
maximal value of x must be available. Unfortunately, we were experimentally unable to reach
full reduction of TiO2 before permanent failure of the GLAD-TiO2 electrode. The second issue is
related to the difficulty of reliably evaluating the true specific electroactive surface area, Se,
through which the proton-coupled charge transfer occurs, an area which does not necessarily
correspond to that determined by BET. This is indeed supported by the idea that ion-insertion
20
percolation channels within single grains, as it has been recently demonstrated by nanoscale
imaging of a lithium titanate surface at various states of Li+ intercalation.56 Consequently, the
diffusion coefficient for ion intercalation determined from eq 2 is an apparent value (one can
finally hardly deconvolute the two parameters contained in the Se DH in, product).
Assuming a Se value of 540 cm2 (estimated from BET) for the 1-m thick GLAD-TiO2 film and
a mole fraction x = 0.5 by analogy to that usually reported for Li+ in anatase,5,52 an apparent
solid-state proton diffusion coefficient of DH,in = 10-15 cm2∙s-1 is obtained. From such a value, the
penetration length, l, of protons within the metal oxide lattice during the time course of a typical
CV experiment can be estimated using eq 3, where t is the charging time of the experiment.
, H in
l D t (3)
At the slowest scan rate (0.1 V∙s-1) we have used and for the highest buffer concentration (860 mM HEPES at pH 7), a proton penetration length l of 1.25 nm was calculated. This diffusion
length is less than the smallest dimension of GLAD-TiO2 nanorods (5 nm) we have roughly
estimated from our simple model in Figure 1, a result which therefore justifies a posteriori the
validity of eq 2 and, therefore, the assumption of 1D semi-infinite linear diffusion. It also
suggests that for the strongest accumulation conditions we were able to reach, the concentration
gradient layer of reduced TiIV extends from the TiO2 nanorod walls up to 40% of the total metal
oxide volume.
Comparative study with lithium intercalation. With the aim of directly comparing proton-ion
versus lithium-ion insertion in a 1-µm thick amorphous GLAD-TiO2 film, a series of CV and
21
6.5) or 76 mM acid form of HEPES (pH 7.0) for a set of scan rates (Figure S5). The marked
differences between the shapes of CVs (and also CVAs) recorded in the presence of a proton ion
donor and those recorded in the presence of lithium ion, suggests that Li+ intercalation does not
proceed as fast as proton intercalation under the selected conditions. One may argue that at the
low Li+ concentration used, the lack of discernable lithium intercalation within GLAD-TiO2
films would result from a slow diffusion rate of Li+ in the bulk of solution, leading thus to a low
faradaic current response according to eq 1. This is however unlikely because the diffusion
coefficient of Li+ in aqueous solution is quite high (10-5 cm2∙s-1),57 and so its diffusion rate in water is even faster than the AH form of HEPES. Still, an additional CV experiment was
performed at a much higher concentration of Li+ (1 M) (Figure S5), but again the small increase
of current compared with that obtained with a proton donor such as the protonated form of
HEPES at 0.66 M definitely indicates the much slower insertion of Li+ than H+ in the amorphous
film of GLAD-TiO2. One should note that the broad and small reversible waves we observed
here for Li+ intercalation in amorphous GLAD-TiO2 are in line with previous reports of Li+
intercalation in other types of amorphous mesoporous TiO2 films in aprotic solvents, exhibiting a
similar broad and small reversible wave in CV, much smaller and less well-defined than for Li+
intercalation in mesoscopic films of pure anatase.51,58 All of these observations allow us to
conclude that, under our conditions, proton ion insertion occurs in amorphous mesoporous
GLAD-TiO2 films immersed in a neutral aqueous buffer solution through a remarkably faster
and more favorable process than lithium ion insertion.
On account of the above observations, it is interesting to return to the value we have determined
for the solid-state diffusion coefficient of protons in GLAD-TiO2 (DH,in = 10-15 cm2∙s-1) because
22
Analyzing in detail the solid-state diffusion coefficients of Li+ reported in literature (in particular
those obtained at nanoporous TiO2 films made of 7-8 nm anatase particles) allows us to identify
consistent values in the range of 1 × 10-17 to 6 × 10-17 cm2∙s-1.42,43,51 Assuming these data as the
most relevant for direct comparison to the present value of DH,in in GLAD-TiO2, we can
conclude that protons diffuse 20- to 100-fold faster in amorphous TiO2 than Li+ in anatase. This
strong difference may explain the obvious contrast we observe between proton and lithium ion
insertion in amorphous GLAD-TiO2 electrodes.
Charge Storage. One great advantage of cyclic voltabsorptometry lies in the correlation that can
be done between electrochemical and spectroscopic data. In the present study, it allows for
real-time analysis of the spectroscopic features of TiO2 films during the electrochemical charging
process. Assuming that all injected electrons give rise to absorbance at 780 nm, cyclic
voltabsorptograms can be converted to derivative cyclic voltabsorptograms (DCVA) according
to eq 4 (where both current and absorbance are expressed in flux density in mol∙cm-2∙s-1) and directly compared to each other.
780 780 1 1000 dA i dt FS
(4)where A780 is the absorbance monitored at 780 nm and 780, in M-1∙cm-1, is the extinction
coefficient of the stored electron.
As shown in Figure S6, when using an extinction coefficient value of 800 or 1200 M-1∙cm-1 at
780 nm, depending on the electrode batch, a perfect overlap of the DCVAs and CVs is obtained
over the entire potential window, regardless of the pHs and buffer concentrations. The
23
surprising since it indicates that all electrons stored within the material share common
spectroscopic features in the visible range, regardless of their origin or nature (i.e., either the
electrons are associated with the filling of electronic states in the band-gap and/or conduction
band, or stored in the double-layer capacitance at the TiO2-electrolyte interface, or associated
with the faradaic charging process leading to the reductive protonation of TiIV ions within the
TiO2 lattice). Such an observation seems to contradict a previous report in literature suggesting
that electrons associated with lithium ion insertion in TiO2 have a marked increase in average
extinction coefficient (in the near-IR range) with respect to electrons accumulated in the
conduction band.35 This previous report, however, was performed under strong accumulation
conditions, which are known to lead to a long lasting coloration of the metal oxide film. In the
present study, such strong accumulation conditions are not encountered. The extinction
coefficient values used in the present study, 900 ± 300 M-1∙cm-1, are in good agreement with
those previously found under different experimental conditions and for different types of
mesoporous TiO2 films.18,25,35
The charge density Q (in C∙cm-2) stored in the 1 m-thick GLAD-TiO2 film can be easily
determined for each electrode either from the maximum absorbance change monitored at 780 nm
or integration of the charging/discharging current in CV, using eq 5.
780 780 Q 1000 A i F F dt S
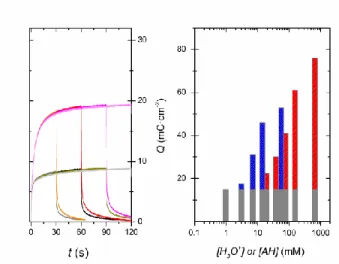
(5)This equation was used to estimate the total charge stored at the highest tested concentration of
proton donor (0.66 M AH in 0.86 M HEPES buffer, pH 7) and 0.1 V∙s-1 (Figure 4). A value of 78 mC∙cm-2 was obtained, corresponding thus to a total charge capacity of 310 C∙g-1. This total
24
stored charge results from the combined contributions of charges stored from faradaic reduction
of TiO2 and charges accumulated at the double-layer interface of the nanostructured metal oxide.
The charge fraction associated with the faradaic contribution can be determined by subtraction of
charge accumulated in the absence of significant proton intercalation (corresponding to the
double-layer capacitance charge) from the total charge. From the magnitude of absorbance
changes recorded at the lowest concentration of proton donor, a capacitive charge density of 18
mC∙cm-2 (or 72 C∙g-1) could be recovered. This implies that 23% of the total stored charge results from the double-layer capacitance of the nanoporous TiO2 film, while the remaining 77% (i.e.,
60 mC∙cm-2 or 240 C∙g-1 or 66 mA∙h∙g-1) arises from the proton-coupled electron transfer reaction within the metal-oxide network (Table 1). This latter value is equivalent to 0.6 mol∙cm -2 of intercalated protons, and thus corresponds to the reductive protonation of 20% of the total
titanium ions in the lattice (equivalent to a x value of 0.2). As the charging process is
diffusion-limited under the experimental conditions, the maximal mole fraction x is manifestly not
reached. It could theoretically be attained experimentally by either decreasing the scan rate or
prolonging the time the electrode is biased at negative potentials (< 0
E ). However, the scan rate
could not be decreased below 0.05 V∙s-1 in the present study without the strong charge accumulation condition inducing a sudden irreversible failure of the GLAD-TiO2 electrodes (see
above).
Despite the inability to reach the maximum mole fraction, it is still possible to compare the total
e-/H+ charges that could be reversibly stored in the 1-m thick GLAD-TiO2 electrode against
previous reports for Li+-storage in various mesoporous anatase films (in aprotic solvents) (Table
1). It is remarkable to note in Table 1 that under our experimental conditions, proton ion
25
intercalation in mesoporous crystalline films of anatase. Moreover, this extensive proton
insertion is achieved much more rapidly than reported for lithium ion insertion (the 0.2 mole
fraction was attained here at a scan rate of 100 mV∙s-1, while for Li+, the 0.15 to 0.31 mole fractions were obtained at 0.5 mV∙s-1, see Table 1). Interestingly, in spite of completely different experimental conditions, a similarly extensive reductive protonation of TiO2 (16%) was
obtained by prolonged UV-irradiation in toluene of amorphous nanoparticles capped with
organic ligands.59
To better characterize the long-term stability, reversibility and speed of e-/H+ charge/discharge in
GLAD-TiO2, mesoporous films were investigated by double potential-step chronoabsorptometric
experiments in HEPES buffer at two different proton donor concentrations (i.e., 0.77 and 77 mM
AH). To avoid excessive charge accumulation, the forward potential was stepped from 0.0 V to
-1.0 V, a moderate cathodic potential only slightly more positive than the formal potential ( 0
E =
-1.06 V) of the reversible proton insertion/disinsertion wave. In the absence of significant proton
donor in solution, the time-course absorbance change in Figure 4 grows rapidly until it reaches a
steady state value of 8.7 mC∙cm2 (in less than 30 s). This fast absorbance increase is representative of the electrode capacitive charging rate (i.e., the charging of both the chemical
and double-layer capacitances) when there is no significant contribution of proton insertion to
charge storage. At an appreciable proton donor concentration of 77 mM (0.1 M HEPES), a
significantly higher limiting charge storage value of 19.3 mC∙cm2 (an increase of 120%) is reached after only slightly longer accumulation time (ca. 60 s). This result confirms the
remarkably fast reductive protonation of GLAD-TiO2 and allows for easy estimation of the
additional stored charges resulting from the faradaic proton insertion at the selected applied
26
points to thermodynamic control of the accumulated charge (i.e., in equilibrium with the Fermi
level of -1.0 V applied to the metal oxide film), which is here assumed governed by the Nernst’s
law. (This is a reasonable assumption when one considers the good electrochemical reversibility
of the proton insertion/disinsertion waves on the CVs). From the maximal faradaic charge
density extracted in Figure 4 (i.e., Q = 11 mC∙cm-2 after subtraction of the capacitive charge density), it can be calculated that 4% of the total Ti ions present in the metal oxide film are
electrochemically reduced after only 1 min of electrode polarization at -1.0 V. Inserting this ratio
into the Nernst equation and assuming the law remains valid regardless of the amount of charge
injected into TiO2 allows us to estimate an x value of 0.45 (using E0= -1.06 V and E = -1.0 V).
This maximum insertion ratio is close to the mole fraction of 0.5 found for lithiated anatase
(Li0.5TiO2) wherein lithium ions are randomly distributed over half of the available interstitial
octahedral sites.60 It also validates a posteriori the x value of 0.5 used in eq 2 for the calculation
of DH,in. Another important merit of the chronoabsorptometric experiments in Figure 4 is to
clearly highlight the high-rate electrochemical charging and discharging processes as well as
their high reversibility and cyclability as attested by the perfect overlay of the multiple double
potential-step experiments repetitively recorded.
CONCLUSION
In the present work, we demonstrate that the charge storage capacity of amorphous GLAD-TiO2
electrodes can be strongly enhanced upon reductive protonation of lattice TiIV ions. This process
is characterized by a reversible and fast faradaic proton-coupled electron transfer reaction
centered at a well-defined formal potential (i.e., a well-defined localized state), energetically
27
TiO2 is fully degenerate), and that we can reasonably attribute to the TiIVO2/TiIIIO(OH) redox
couple. This reversible process can however only be revealed by the presence of a sufficiently
large concentration of an appropriate proton donor in solution, i.e., free protons or a much
weaker acid such as the acidic form of the buffer. We demonstrate moreover that reductive
doping of amorphous mesoporous TiO2 in aqueous solution is highly specific for protons and
that Li+ insertion does not compete with proton insertion under the present experimental
conditions, most likely because of the short time window used. Despite this, the total charge
stored in the GLAD-TiO2 electrode upon proton insertion falls within the range of values
reported for mesoporous TiO2 electrodes upon lithium insertion in aprotic solvent.
The present study is of special interest for the development of devices operating under
mildly-aqueous conditions as it demonstrates that electron/proton accumulation within mesoporous TiO2
films can occur massively and rapidly at neutral pH conditions. This, in turn, indicates that high-rate and high-power could be achieved for reversible proton charge/discharge storage within the
material. It provides moreover an easy methodology to distinguish the faradaic current density
related to proton intercalation from that associated with the classical electrical capacitance by
28
Figure 1. SEM images (top- and side-views) of the 1-m GLAD-TiO2 films. The right cartoon is
a schematic representation of the film consisting of an array of homogenously distributed cylindrical nanorods. The indicated diameter (5 nm) was calculated based on BET measurements of surface area and characterizes the high surface area fine structure internal to TiO2 columns
29
Figure 2. (Left) CVs and (right) CVAs (monitored at 780 nm) recorded simultaneously at a
1 m-thick GLAD-TiO2 electrode in an aqueous solution of (blue) 14 mM HCl (pH 1.85), or
buffered solutions (pH 7.0) of (black) 1 mM HEPES or (red) 100 mM HEPES. All solutions also contained 0.3 M KCl as supporting electrolyte. Electrodes were scanned from 0 to -1.25 V at pH 7, and from 0 to –0.96 V at pH 1.85. CVs are expressed in flux density and CVAs in surface concentrations (i.e., A780/(1000∙). Scan rate: 0.1 V∙s-1. T = 25°C.
30
Figure 3. (Left) Cathodic peak electron flux density in CV as a function of v (for scan rates ranging from 0.05 to 0.5 V∙s-1) and for different concentrations of (blue data) free protons, i.e. [H3O+] = () 2.5,() 7, () 14 and 50 () mM, or (red data) the acidic form of HEPES buffer,
i.e. [AH] = () 19, () 38, () 77, () 153 and () 656 mM. (Right) Cathodic peak electron flux density normalized to v and plotted as a function of proton donor concentration: (blue) free protons and (red) the acidic form of HEPES buffer. Dashed lines correspond to the linear regression fits of eq 1 to the data determined at low proton donor concentrations. The horizontal dotted black line corresponds to the extrapolated limiting value of f,p/v1/2.
31
Figure 4. (Left) Double potential step chronoabsorptometric responses (the absorbance has been
converted into charge per unit of geometric electrode area using eq 5) monitored at 780 nm in a 0.3 M KCl aqueous solution containing (black and grey lines) 1 mM or (orange, red, magenta, pink lines) 100 mM HEPES at pH 7. The potential was stepped from 0.0 to – 1.0 V and then back to 0.0 V (vs. Ag/AgCl). The double potential step experiment was repeated several times by progressively increasing both the cathodic and anodic polarization time from 30 to 120 s. (Right) charge contributions of the (grey) double layer charging and (blue and red) faradaic proton intercalation to the total charge stored in a GLAD-TiO2 film during a CV performed at 0.1 V∙s-1.
Bars in blue are for free protons, while those in red are for the acidic form, AH, of the HEPES buffer.
32
Scheme 1. Schematic representation of the faradaic charging processes occurring at the TiO2
mesoporous electrodes involving concerted electron-proton transfer to solvent-accessible TiIV ions according to the interfacial reactions 2 or 3, depending on the proton provider, followed by coupled electron/proton diffusion within the TiO2 lattice according to reaction 4.
33
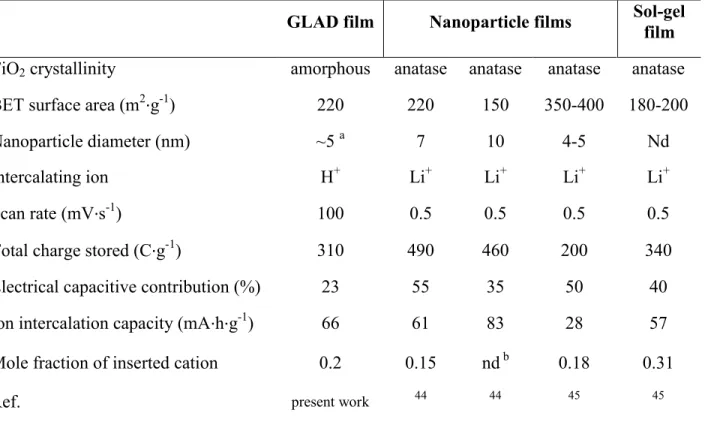
Table 1. Structural characteristics and charge storage properties of the present GLAD TiO2 films
compared to those previously established for other mesoporous TiO2 films.
GLAD film Nanoparticle films Sol-gel film
TiO2 crystallinity amorphous anatase anatase anatase anatase
BET surface area (m2∙g-1) 220 220 150 350-400 180-200 Nanoparticle diameter (nm) ~5 a 7 10 4-5 Nd Intercalating ion H+ Li+ Li+ Li+ Li+ Scan rate (mV∙s-1) 100 0.5 0.5 0.5 0.5 Total charge stored (C∙g-1) 310 490 460 200 340 Electrical capacitive contribution (%) 23 55 35 50 40 Ion intercalation capacity (mA∙h∙g-1) 66 61 83 28 57 Mole fraction of inserted cation 0.2 0.15 nd b 0.18 0.31
Ref. present work 44 44 45 45
34 ASSOCIATED CONTENT
Supporting Information. Figures S1 to S6 (CVs and CVAs recorded at different scan rates in
presence of increasing concentrations of strong or weak acid and lithium, DCVAs) and Table S1.
This material is available free of charge via the Internet at http://pubs.acs.org.
AUTHOR INFORMATION
Corresponding Authors
* veronique.balland@univ-paris-diderot.fr, limoges@univ-paris-diderot.fr
Author Contributions
The manuscript was written through contributions of all authors. All authors have given approval
to the final version of the manuscript.
Acknowledgments
Financial support for S.K. was obtained from Agence Nationale pour la Recherche
(3D-BIOELEC / ANR-11-JS08-011). K.D.H. thanks Jae-Young Cho for the SEM imaging, and
35 REFERENCES
(1) Berger, T.; Monllor-Satoca, D.; Jankulovska, M.; Lana-Villarreal, T.; Gomez, R. The
electrochemistry of nanostructured titanium dioxide electrodes. ChemPhysChem 2012, 13,
2824–2875.
(2) Li, W.; Wu, Z.; Wang, J.; Elzatahry, A. A.; Zhao, D. A Perspective on Mesoporous TiO2
Materials. Chem. Mater. 2014, 26, 287–298.
(3) Hagfeldt, A.; Boschloo, G.; Sun, L.; Kloo, L.; Pettersson, H. Dye-sensitized Solar Cells.
Chem. Rev. 2010, 110, 6595–6663.
(4) Reddy, M. V; Subba Rao, G. V; Chowdari, B. V Metal oxides and oxysalts as anode
materials for Li ion batteries. Chem Rev 2013, 113, 5364–5457.
(5) Dylla, A. G.; Henkelman, G.; Stevenson, K. J. Lithium Insertion in Nanostructured TiO2
(B) Architectures. Acc. Chem. Res. 2013, 46, 1104–1112.
(6) Bai, J.; Zhou, B. Titanium dioxide nanomaterials for sensor applications. Chem. Rev.
2014, 114, 10131–10176.
(7) Nang Dinh, N.; Minh Quyen, N.; Chung, D. N.; Zikova, M.; Truong, V. Van
Highly-efficient electrochromic performance of nanostructured TiO2 films made by doctor blade
technique. Sol. Energy Mater. Sol. Cells 2011, 95, 618–623.
(8) Watanabe, T.; Nakajima, A.; Wang, R.; Minabe, M.; Koizumi, S.; Fujishima, A.;
Hashimoto, K. Photocatalytic activity and photoinduced hydrophilicity of titanium dioxide
coated glass. Thin Solid Films 1999, 351, 260–263.
36
Papanikolas, J. M.; Meyer, T. J. Molecular Chromophore-Catalyst Assemblies for Solar
Fuel Applications. Chem. Rev. 2015, 115, 13006–13049.
(10) Ma, Y.; Wang, X. L.; Jia, Y. S.; Chen, X. B.; Han, H. X.; Li, C. Titanium Dioxide-Based
Nanomaterials for Photocatalytic Fuel Generations. Chem. Rev. 2014, 114, 9987–10043.
(11) Zhang, Y.; Xiong, X.; Han, Y.; Zhang, X.; Shen, F.; Deng, S.; Xiao, H.; Yang, X.; Yang,
G.; Peng, H. Photoelectrocatalytic degradation of recalcitrant organic pollutants using
TiO2 film electrodes: An overview. Chemosphere 2012, 88, 145–154.
(12) Bella, F.; Gerbaldi, C.; Barolo, C.; Grätzel, M. Aqueous dye-sensitized solar cells. Chem.
Soc. Rev. 2015, 44, 3431–3473.
(13) Bella, F.; Galliano, S.; Falco, M.; Viscardi, G.; Barolo, C.; Grätzel, M.; Gerbaldi, C.
Unveiling iodine-based electrolytes chemistry in aqueous dye-sensitized solar cells. Chem.
Sci. 2016, 4880–4890.
(14) Liu, S.; Pan, G. L.; Yan, N. F.; Gao, X. P. Aqueous TiO2/Ni(OH)2 rechargeable battery
with a high voltage based on proton and lithium insertion/extraction reactions. Energy
Environ. Sci. 2010, 3, 1732.
(15) Liu, J.; Wang, J.; Ku, Z.; Wang, H.; Chen, S.; Zhang, L.; Lin, J.; Shen, Z. X. Aqueous
Rechargeable Alkaline Cox Ni2 S2-x/TiO2 Battery. ACS Nano 2016, 10, 1007–1016.
(16) Moore, T.; Gust, D.; Hambourger, M.; Kodis, G.; Moore, A.; Moore, G. F. Solar energy
conversion in a photoelectrochemical biofuel cell. Dalton Trans. 2009, 9979–9989.
(17) Zhao, W.-W.; Xu, J.-J.; Chen, H.-Y. Photoelectrochemical bioanalysis: the state of the art.
37
(18) Berger, T.; Anta, J. A.; Morales-Florez, V. Electrons in the band gap: Spectroscopic
characterization of anatase TiO2 nanocrystal electrodes under fermi level control. J. Phys.
Chem. C 2012, 116, 11444–11455.
(19) Fabregat-Santiago, F.; Barea, E. M.; Bisquert, J.; Mor, G. K.; Shankar, K.; Grimes, C. A.
High carrier density and capacitance in TiO2 nanotube arrays induced by electrochemical
doping. J. Am. Chem. Soc. 2008, 130, 11312–11316.
(20) Meekins, B. H.; Kamat, P. V Got TiO2 Nanotubes? Lithium Ion Intercalation can Boost
Their Photoelectrochemical Performance Supporting Information. ACS Nano 2009, 3,
3437–3446.
(21) Ghicov, A.; Tsuchiya, H.; Hahn, R.; MacAk, J. M.; Munoz, A. G.; Schmuki, P. TiO2
nanotubes: H+insertion and strong electrochromic effects. Electrochem. commun. 2006, 8,
528–532.
(22) Berger, T.; Anta, J. A.; Morales-Flórez, V. Spectroscopic properties of electrochemically
populated electronic states in nanostructured TiO2 films: anatase versus rutile. Phys.
Chem. Chem. Phys. 2013, 15, 13790–5.
(23) Idigoras, J.; Berger, T.; Anta, J. A. Modification of mesoporous TiO2 films by
electrochemical doping: Impact on photoelectrocatalytic and photovoltaic performance. J.
Phys. Chem. C 2013, 117, 1561–1570.
(24) Cao, F.; Oskam, G.; Searson, P. C.; Stipkala, J. M.; Heimer, T. A.; Farzad, F.; Meyer, G.
J. Electrical and optical properties of porous nanocrystalline TiO2 films. J. Phys. Chem.
38
(25) Rothenberger, G.; Fitzmaurice, D.; Graetzel, M. Spectroscopy of conduction band
electrons in transparent metal oxide semiconductor films: optical determination of the
flatband potential of colloidal titanium dioxide films. J. Phys. Chem. 1992, 96, 5983–
5986.
(26) Mandal, D.; Hamann, T. W. Band energies of nanoparticle semiconductor electrodes
determined by spectroelectrochemical measurements of free electrons. Phys. Chem. Chem.
Phys. 2015, 17, 11156–11160.
(27) Simon, P.; Gogotsi, Y.; Dunn, B. Where Do Batteries End and Supercapacitors Begin ?
Science 2014, 343, 1210–1211.
(28) Augustyn, V.; Simon, P.; Dunn, B. Pseudocapacitive oxide materials for high-rate
electrochemical energy storage. Energy Environ. Sci. 2014, 7, 1597.
(29) Krause, K. M.; Taschuk, M. T.; Harris, K. D.; Rider, D. A.; Wakefield, N. G.; Sit, J. C.;
Buriak, J. M.; Thommes, M.; Brett, M. J. Surface area characterization of obliquely
deposited metal oxide nanostructured thin films. Langmuir 2010, 26, 4368–76.
(30) Renault, C.; Nicole, L.; Sanchez, C.; Costentin, C.; Balland, V.; Limoges, B. Unraveling
the charge transfer/electron transport in mesoporous semiconductive TiO2 films by
voltabsorptometry. Phys. Chem. Chem. Phys. 2015, 17, 10592–10607.
(31) Renault, C.; Andrieux, C. P.; Tucker, R. T.; Brett, M. J.; Balland, V.; Limoges, B.
Unraveling the mechanism of catalytic reduction of O2 by microperoxidase-11 adsorbed
within a transparent 3D-nanoporous ITO film. J. Am. Chem. Soc. 2012, 134, 6834–45.
39
Array Morphology and Growth Studied by Focused Ion Beam Tomography. Langmuir
2010, 26, 17558–17567.
(33) One should note that the K+ cation present in the supporting electrolyte has not been
considered as a potentially intercalating ion because of its too large size and the absence
of effect on the CVs upon changing the KCl concentration.
(34) Fabregat-Santiago, F.; Mora-Seró, I.; Garcia-Belmonte, G.; Bisquert, J. Cyclic
Voltammetry Studies of Nanoporous Semiconductors. Capacitive and Reactive Properties
of Nanocrystalline TiO2 Electrodes in Aqueous Electrolyte. J. Phys. Chem. B 2003, 107,
758–768.
(35) Boschloo, G.; Fitzmaurice, D. Electron Accumulation in Nanostructured TiO2 (Anatase)
Electrodes. J. Phys. Chem. B 1999, 103, 7860–7868.
(36) Lyon, L. A.; Hupp, J. T. Energetics of the Nanocrystalline Titanium Dioxide/Aqueous
Solution Interface: Approximate Conduction Band Edge Variations between H0 = −10 and
H- = +26. J. Phys. Chem. B 1999, 103, 4623–4628.
(37) Zukalova, M.; Bousa, M.; Bastl, Z.; Jirka, I.; Kavan, L. Electrochemical Doping of
Compact TiO2 Thin Layers. J. Phys. Chem. C 2014, 25970–25977.
(38) Liu, L.; Yellinek, S.; Valdinger, I.; Donval, A.; Mandler, D. Important Implications of the
Electrochemical Reduction of ITO. Electrochim. Acta 2015, 176, 1374–1381.
(39) Zhang, Y.; Feng, H.; Wu, X.; Wang, L.; Zhang, A.; Xia, T.; Dong, H.; Li, X.; Zhang, L.
Progress of electrochemical capacitor electrode materials: A review. Int. J. Hydrogen