HAL Id: inserm-01590765
https://www.hal.inserm.fr/inserm-01590765
Submitted on 20 Sep 2017HAL is a multi-disciplinary open access archive for the deposit and dissemination of sci-entific research documents, whether they are pub-lished or not. The documents may come from teaching and research institutions in France or abroad, or from public or private research centers.
L’archive ouverte pluridisciplinaire HAL, est destinée au dépôt et à la diffusion de documents scientifiques de niveau recherche, publiés ou non, émanant des établissements d’enseignement et de recherche français ou étrangers, des laboratoires publics ou privés.
Photodynamic therapy for glioblastoma: A preliminary
approach for practical application of light propagation
models
Clément Dupont, Anne-Sophie Vignion-Dewalle, Serge Mordon, Nicolas
Reyns, Maximilien Vermandel
To cite this version:
Clément Dupont, Anne-Sophie Vignion-Dewalle, Serge Mordon, Nicolas Reyns, Maximilien Verman-del. Photodynamic therapy for glioblastoma: A preliminary approach for practical application of light propagation models. Lasers in Surgery and Medicine, Wiley, 2017, Epub ahead of print. �10.1002/lsm.22739�. �inserm-01590765�
1
Photodynamic Therapy for glioblastoma: a preliminary approach
for practical application of light propagation models
C. Dupont, PhD student, A.-S. Vignion, PhD, S. Mordon, PhD, N. Reyns, MD, PhD, M. Vermandel*, PhD
Univ. Lille, Inserm, CHU Lille, U1189 - ONCO-THAI - Image Assisted Laser Therapy for Oncology, F-59000 Lille, France
*Corresponding author: m-vermandel@chru-lille.fr
Abstract:
Purpose Photodynamic therapy (PDT) is a promising treatment modality to be added in the
management of glioblastoma multiforme (GBM). Light distribution modeling is required for planning and optimizing PDT. Several models have been developed to predict the light propagation inside biological tissues. In the present study, two analytical methods of light propagation emitted from a cylindrical fiber source were evaluated: a discrete and a continuous method.
Methods The two analytical approaches were compared according to their fluence rate results.
Several cylindrical diffuse lengths were evaluated, and the relative deviation in the fluence rates was estimated. Moreover, a sensitivity analysis was conducted to compute the variance of each analytical model.
Results The discrete method provided fluence rate estimations closer to the Monte-Carlo
simulations than the continuous method. The sensitivity study results did not reveal significant differences between the variance of the two analytical models.
Conclusions Although the discrete model provides relevant light distribution, the
heterogeneity of GBM tissues was not considered. With the improvement in parallel computing that drastically decreased the computing time, replacing the analytical model by a Monte-Carlo GPU-accelerated code appeared relevant to the GBM case. Nonetheless, the analytical modeling may still function in the optimization algorithms, which might be used in the Photodynamic treatment planning system.
Keywords: Photodynamic Therapy, High-Grade Glioma, dosimetry, simulation, TPS I. Introduction
Glioblastoma multiforme (GBM) is the most common primary brain tumor. GBM is responsible for approximately 3% of premature cancer deaths (patients aged less than 65) and is the third cause of death by cancer in young adults (aged between 15 and 34) 1. Its incidence is approximately 4 new cases each year for 100,000 inhabitants 2,3; it induces 12,000 new GBM cases annually diagnosed in the USA 4 and 30,000 new cases in Europe 5.
Standard of care recommends a three-stage therapy 6
. Whenever possible, a resection surgery is first achieved for debulking most tumor tissues while preserving the crucial neurological function areas. Radiotherapy and chemotherapy are subsequently administered
7,8
2
(between 9 to 12 months of median survival are estimated 8-10) but does not bring curative solutions.
Among recent studies on GBM treatment, Photodynamic Therapy (PDT) appears to be a promising area of research 11-17. The cytotoxic effect of PDT relies on the synergy of its
three components: a photosensitizer (PS), light and oxygen. The energy deposited by a laser light leads to PS excitation inside tumor cells, and a photoreaction is achieved between the PS and the oxygen. This photoreaction mainly results in singlet oxygen and free radicals, which are cytotoxic compounds leading to tumor cell death (necrosis or apoptosis).
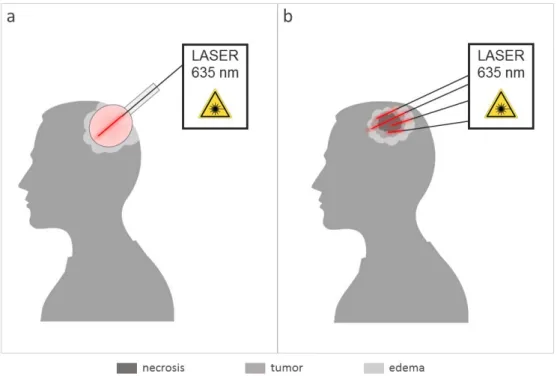
Two light application modalities may be considered. Intraoperative PDT 18-24 aims to treat the borders of the resection cavity to decrease recurrence risks (see Figure 1a). In studies reporting this adjuvant treatment, the light was applied through a diffusing balloon to fit the geometry of the cavity 25-27. For non-resectable GBM (de novo or relapsing), interstitial PDT (iPDT) 13,28-31 may be achievable, which relies on the insertion of optical fibers directly into the target (see Figure 1b). Because of strong light absorption in biological tissues, the diffusing sources located at the tip of the optical fibers have to be placed near or inside the tumor under stereotactic conditions to maximize the treated volume. Preliminary results have shown positive outcomes 17. Currently, a Treatment Planning System modeling light propagation in tissues is still missing, in particular for PDT applied to GBM where tissues are highly heterogeneous.
Figure 1: The two clinical PDT modalities currently under investigation for Neurosurgery. (a): Intraoperative PDT; a balloon device is inserted into the patient’s brain to treat the borders of the resection cavity. It clearly shows the needs of a craniotomy to light the surgical bed with less issues on optical properties than for the interstitial PDT, (b) optical fibers are inserted through the skull into the tumor core that contains heterogeneous tissues (tumor, edema, necrosis). Here, four optical fibers are inserted into the tumor that deliver laser light (635 nm) to induce the PDT effect.
Biological tissues are highly dispersing media due to their strong absorption and scattering properties. Tissues are defined by absorption (µa) and scattering (µs) coefficients of
a specific wavelength 32. These features depend on the effective cross-section and the density of molecules constituting the media. Regarding scattering, the reduced scattering coefficient
3
(µs’) is used in most cases because it considers the anisotropy factor of the media. Anisotropy
is a constant, relative to the media, designating the deflection angle. Thus, the reduced scattering coefficient describes a more realistic approximation of light propagation in the media.
Different mathematical models have been designed to predict the light propagation in tissues. Monte-Carlo modeling is probably the most consistent approach. This approach involves following the history of single photons according to their probability of interactions in the tissues. Thus, to obtain a realistic simulation, millions of photons have to be generated, leading to long calculation times 33,34. Other light propagation models, as finite element algorithms, have been developed to avoid those issues. Numerical models compute the light distribution by solving the Partial Differential Equation 35-37. Simulation space is discretized to create a mesh. This mesh provides boundary values to reduce and resolve differential equations in many points of space. However, implementing such a model in a Treatment Planning System (TPS) remains complicated since it requires many preliminary steps (optimized meshes, light source areas definition) to obtain significant results. Another model of light transport, known as the analytics methods, stems from the steady-state solution of the wave propagation equation 38-43. The simplicity of implementation and short time computing make them particularly interesting for routine clinical applications and TPS implementation. Currently, to the best of our knowledge, no TPS is dedicated to the interstitial photodynamic treatment of GBM. One major issue lies in the difficulty of obtaining the optical properties of tissues. Although several new spectroscopy techniques appear, such as fluorescence spectroscopy 44,45, Raman spectroscopy 46-48, diffuse optical frequency domain 49,50 and reflectance spectroscopy 51,52, their use in clinical routine has not been considered. Thus, predetermined coefficients are injected into a light propagation model to estimate light propagation.
In this study, an experimental design is performed to compare two analytical equations of light propagation in term of accuracy and robustness. The main purpose of this study is to highlight the most reliable analytical expression for describing the light distribution from a cylindrical source, specifically with PpIX as the PS and laser light at 635 nm. The accuracy of each model was evaluated in comparison with a Monte-Carlo modeling of light propagation. The robustness was assessed through a sensitivity analysis that evaluated the impact of the variations in optical coefficients on the output of the analytical models.
II. Material and methods Problem statement
Currently, the most common light sources used in iPDT are optical fibers coupled with a cylindrical tip diffuser 53. Cylindrical diffusors of 10-50 mm in length are typically employed to fit the target volume. The fiber diameter is commonly equal or under one millimeter to remain safe when inserting fiber into tissues.
In all simulations, a homogeneous semi-infinite media standing for the GBM tissue was created and defined by two optical coefficients (absorption and reduced scattering): µa =
0.02 mm-1 and µs’ = 2 mm-1. These coefficient values, matching to a normal brain tissue
infiltrated by GBM tumor cells, were used in a previous study by Beck et al. 13 and were recently confirmed by a recent study published by Tedford et al. 54.
Approximation of the light propagation
The main parameter currently used in PDT dosimetry is the fluence rate, usually expressed in W/cm². Two analytical methods can be found in previous studies that estimate
4
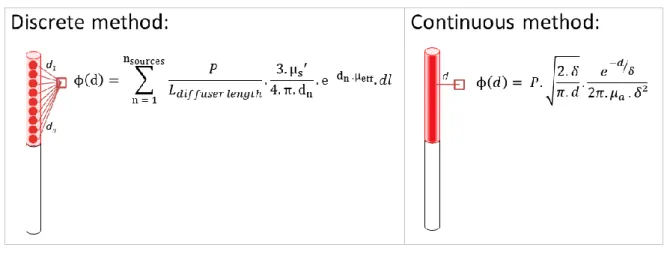
the fluence rate from a light source in biological media. These two algorithms differ in their discrete or continuous modeling of a cylindrical diffusor (Figure 2).
Figure 2: Illustration of the two analytical equations. The discrete method discretizes the diffusing part of the optical fiber as a sum of several light point sources. The continuous method considers the light source as a finite line and computes the fluence rate values using the minimal distance d from the fiber.
The first method (1), the so-called discrete method, discretizes the diffusing part of the optical fiber as a sum of several n-light point sources 38,41,55. Thus, calculation of the fluence rate at a distance d from the fiber is the sum of each light source contribution.
, (1)
where P: the power of the source (W)
: cylindrical diffusor length (mm)
dl: constant step length of discretization between two light point sources (mm) dn: distance to the n-light point source (mm) where n =
µs’: reduced scattering coefficient (mm-1)
µa: absorption coefficient (mm-1)
µeff: effective attenuation coefficient (mm-1) =
The second algorithm (2), the so-called continuous method, considers the whole fiber as a line light source with 2D cylindrical light emission characteristics 40,56. It computes the fluence rate values using the minimal distance d from the fiber.
, (2)
where P: the power of the source (W) : optical penetration depth (mm) D: Diffusion length (mm) =
5 Definition of the reference method
To evaluate these analytical models, the results were compared to the Monte-Carlo simulations based on the Prahl et al. algorithm 57-59 named “MCxyz.” This Monte-Carlo method has already proved its accuracy in light estimation propagation and was also used as a reference in the paper of Jacques and Pogue 56. Initially, the program computed the light propagation into the heterogeneous media surrounding a point source. The code has been slightly modified to simulate a cylindrical source. The location of initial photons was randomized within a cylindrical diffuser model. Cylindrical diffusor dimensions were inspired from standard optical fiber dimensions used in PDT: a diameter of 1 mm and a diffusing length between 10 and 50 mm (RD-ML, Medlight, Ecublens, Switzerland). A 40x40x70 mm homogeneous slab with the same optical parameters used with analytical equations defined the surrounding media.
Metric
To compare these models, a common metric (3) was used. The fluence rate was estimated at the distance value d from the center of the source for each simulation (see Figure 3). The distance called the reduced Mean Free Path (MFP’) is defined as the inverse of the sum of absorption and reduced scattering coefficient:
(3)
In our case, with µa = 0.02 mm-1 and µs’ = 2 mm-1, the MFP’ is close to 0.50 mm. At distances
below this MFP´, analytical light propagation models become inaccurate 56. Thus, the fluence rate estimation started from 0.75 mm to avoid outlier values due to their exponential factor (i.e., when the distance d is close to zero). The relative deviation between Monte-Carlo
and each analytical approach was then computed.
6
Figure 3. A 2D cross section map (on the left) and 1D line scan plot (on the right) of fluence rate values for a 40 mm length diffuser computed with Monte-Carlo method. At distances below this MFP´, the analytical light propagation models become inaccurate.
Fluence rate distribution from different diffuser lengths (10, 15, 20, 30, 40 and 50 mm) were computed from both several Monte-Carlo simulations and analytical equations. Each simulation lasted 1000 minutes (approximately 20E6 photons). Metric values were extracted each 1 mm from the center of the light source to a distance of 10 mm (Figure 3). Analytical equations were implemented in Matlab software (MathWorks, Natick, USA). First, the mean relative deviations for each distance d (between 0.75 mm to 10 mm) were computed over six different diffuser lengths. Subsequently, the mean relative deviations for all six different diffusers were computed over each distance d (between 0.75 mm to 10 mm).
Sensitivity analysis
Fluence rates computed from different models were expected to be very sensitive to optical coefficients of the considered media, particularly when the strong heterogeneity of GBM tissues led to a wide range of optical coefficients. This sensitivity was evaluated with indices called the Sobol indices Si 60,61.
The estimation of the first-order Sobol index of input parameters Xi requires evaluating the
ratio between conditional and total variance (5):
(5)
This index quantifies the sensitivity of the output Y due to the variation of the input Xi.
Higher-order Sobol indices quantify the sensitivity of the output Y variance to the interaction of n-input parameters Xi…n. The second-order Sobol index estimates the output Y sensitivity to
Xi and Xj inputs parameter (6):
(6)
The sensitivity package provided by the Comprehensive R Archive Network (https://CRAN.R-project.org/package=sensitivity) was implemented in the statistical software R. This library provides different functions for sensitivity analysis computation, including Sobol indices computation by the Monte-Carlo method. The variance Vi can be developed as:
(7) A randomization method estimates Ui using typical variance computing using two
N-dimension random samples of input parameters and , with Xi constant:
(8)
First-order Sobol indices can then be estimated as: and (9)
7
The same process was applied to estimate the second-order Sobol index; two N-dimension random samples of input parameters and are injected in the f function with Xi and Xj
constants: (10)
Second-order Sobol indices can then be estimated as:
(11)
As reported by Zhang et al. 61, the parameters and their limits must be carefully defined. In this study, two parameters were included in the sensitivity analysis: absorption and reduced scattering coefficient. Thus, two N-dimension samples ( and ) of absorption and reduced scattering coefficients were created. Random values of optical coefficients were generated with a range of ± 50% from the mean value presented above: between 0.01 to 0.03 mm-1 for the absorption coefficient and 1 to 3 mm-1 for the reduced scattering coefficient. The Sobol function provided in the “sensitivity” package was applied with a sample size of N = 100,000 and 1000 bootstrap replications. First, second and total-order sensitivity indices were generated and analyzed. Concerning the diffuser length, the continuous model does not require the definition of a light source length. Moreover, for sensitivity analysis purposes only, the discrete model was implemented with a 40 mm diffuser length. Indeed, the diffuser length can be considered as a constant because the power, defined in W/mm, must be divided by the diffuser length. Furthermore, the light source power was not considered as a parameter because it does not affect light propagation in tissues.
III. Results
Relative deviation
Figure 4 represents mean relative deviation estimated over the six diffuser lengths (i.e., 10, 15, 20, 30, 40 and 50 mm) for each distance d. Mean relative deviation values are summarized in Table 1.
The mean of all mean relative deviations summarized in Table 1 equals 1.23% (2.48%) for the discrete method and 26.12% (7.53%) for the continuous method.
Statistical analysis (Student test) of all datasets confirmed that these two means are significantly different (p-value < 0.0001). The discrete method shows a better correlation with Monte-Carlo results than the continuous one.
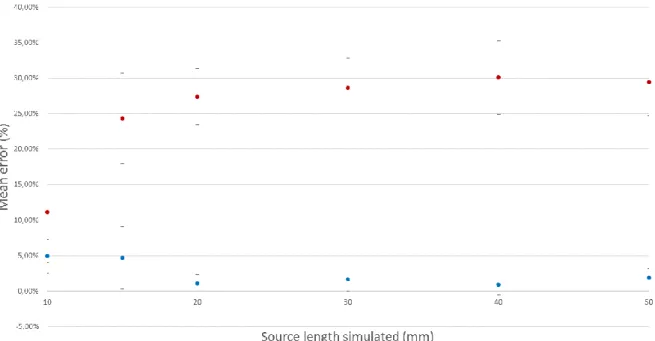
Figure 5 represents the relative deviation where the mean is estimated of all distances d to the source for each diffuser length simulated, summarized in Table 2. The discrete method results in a mean (2.53% (2.09%)) lower than that for the continuous method (25.18% (5.27%)).
Table 1: Relative deviation computed at different distances from the source; the mean is computed for all source lengths at a given distance d.
8
d (mm) Mean (SD) Max deviation Mean (SD) Max deviation 0.75 0.72% (0.75%) 1.98% 18.38% (1.96%) 19.89% 1 0.03% (0.93%) 2.55% 21.45% (1.74%) 23.25% 2 0.61% (3.48%) 9.36% 25.95% (4.45%) 32.77% 3 1.46% (1.53%) 4.32% 27.06% (4.45%) 29.71% 4 0.49% (2.99%) 7.08% 28.51% (6.30%) 32.50% 5 1.69% (1.96%) 5.51% 27.66% (7.03%) 32.34% 6 0.98% (1.69%) 4.70% 28.26% (8.19%) 32.99% 7 2.89% (3.03%) 7.61% 26.99% (10.04%) 32.81% 8 9 10 0.25% (5.67%) 2.71% (2.46%) 1.72% (2.76%) 15.38% 7.89% 8.00% 28.57% (12.76%) 26.36% (12.53%) 28.16% (13.35%) 35.96% 32.14% 37.50%
Table 2: Relative deviation computed for different source lengths; the mean is computed for all distances.
Discrete method Continuous method Source length
(mm) Mean (SD) Max deviation Mean (SD) Max deviation 10 4.94% (2.38%) 8.00% 11.16% (7.18%) 19.10% 15 4.70% (4.41%) 15.38% 24.31% (6.40%) 32.77% 20 1.05% (1.23%) 4.24% 27.40% (3.94%) 30.56% 30 1.70% (1.71%) 5.56% 28.61% (4.21%) 32.65% 40 0.91% (1.46%) 5.00% 30.12% (5.14%) 37.50% 50 1.89% (1.34%) 4.49% 29.48% (4.77%) 35.96%
Figure 4. Data points are the mean relative deviations of fluence rate values computed by discrete and continuous methods, calculated for each distance d (0.75 mm to 10 mm) over all six different source lengths. Error bars are standard deviations.
9
Figure 5 Data points are the mean relative deviations of fluence rate values computed by discrete and continuous methods, calculated for all six different source lengths over each distance d (0.75 mm to 10 mm). Error bars are standard deviations.
Sensitivity analysis
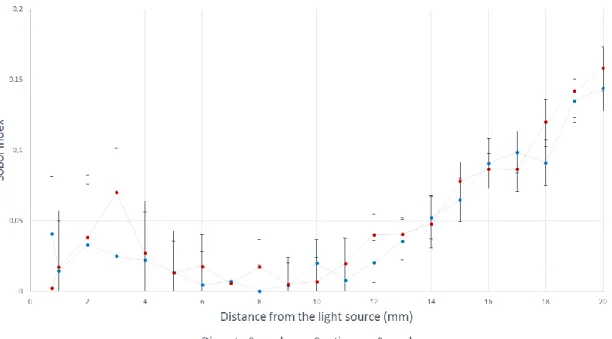
Sobol indices computed for both discrete and continuous models were illustrated according to the distance to the light source on Figure 6, 7 and 8. Figure 6 shows the first-order Sobol indices due to absorption coefficient variation obtained from both the discrete and continuous models. Figure 7 shows the first-order Sobol indices due to the reduced scattering coefficient variation obtained from both discrete and continuous models. Figure 8 shows the second-order Sobol indices estimating the output sensitivity from both discrete and continuous models to absorption and reduced scattering coefficients. Table 3 summarizes the first-order and total-effect indices of each parameter (absorption and reduced-scattering coefficient) for both discrete and continuous models. In this case, the total-effect index is the sum of the first- and second-order Sobol indices. These indices provide global sensitivity, which is the sensitivity of the parameter alone and interaction sensitivity with all other parameters.
In both cases, the reduced scattering coefficient is the most influential on analytical models’ variance close to the light source (approximately 70% to 80%). Conversely, beyond a distance to the light source of 3 mm, the absorption coefficient becomes the most influential parameter on analytical models. At a distance of 5 mm, approximately 98% of the analytical models’ variance is due to the effect of the reduced scattering coefficient. First-order Sobol indices can be considered as total-effect indices between 0.75 mm and 15 mm from the light source, whereas the second-order Sobol indices are negligible. Between 10 mm and 20 mm from the light source, the impact of absorption coefficient on output variance remains constant, (approximately 20%) and the effect of reduced scattering decreases slowly (from 85% to 60%). Thus, the interaction between the absorption and the reduced scattering coefficient cannot be overlooked. A slight difference of approximately 10% between the continuous and discrete models can be observed between 0.75 mm and 5 mm from the light source. Nonetheless, the impacts of both the absorption and reduced scattering coefficients can be considered as equal to each analytical model’s variance after a distance from the light source of 5 mm.
10
Figure 6. First-order Sobol indices (Sµa) computed with two different analytical equations (discrete and continuous method) for different distances to the light source. These Sobol indices quantify the contribution to the analytical model’s variance to the effect of absorption coefficient variation.
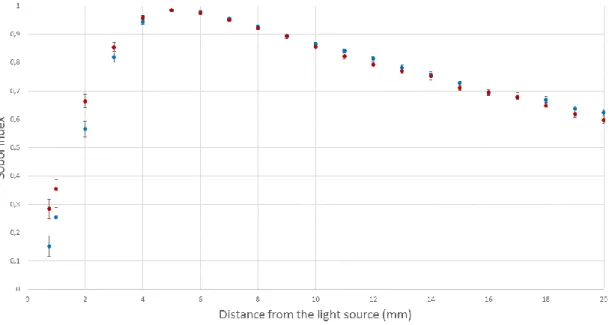
Figure 7. First-order Sobol indices (Sµs’) computed with two different analytical equations (discrete and continuous method) for different distances from the light source. These Sobol indices quantify the contribution of the analytical model’s variance to the effect of reduced scattering coefficient variation.
11
Figure 8. Second-order Sobol indices (Sµaµs’ and Sµaµs’) computed with two different analytical equations (discrete and continuous method) for different distances to the light source. These Sobol indices quantify the sensitivity of the analytical model’s variance to the interaction of reduced scattering and absorption coefficients variations.
Table 3: First-order (Sµa and Sµs’) and total-effect Sobol indices (STi) for both continuous and discrete models.
distance (mm) Sµa STi Sµs' STi Sµa STi Sµs' STi Continuous model Discrete model
0.75 0.285 0.287 0.713 0.715 0.151 0.192 0.808 0.849 1 0.354 0.371 0.629 0.646 0.255 0.270 0.730 0.745 2 0.663 0.702 0.299 0.337 0.565 0.598 0.402 0.435 3 0.853 0.924 0.077 0.147 0.819 0.844 0.156 0.181 4 0.959 0.986 0.014 0.041 0.944 0.966 0.034 0.056 5 0.984 0.998 0.002 0.016 0.984 0.998 0.002 0.016 6 0.974 0.992 0.008 0.026 0.978 0.983 0.017 0.022 7 0.951 0.957 0.043 0.050 0.956 0.963 0.037 0.044 8 0.921 0.939 0.061 0.079 0.928 0.928 0.072 0.072 9 0.892 0.897 0.103 0.108 0.895 0.900 0.100 0.105 10 0.855 0.862 0.138 0.145 0.866 0.886 0.114 0.134 11 0.823 0.843 0.157 0.177 0.841 0.849 0.151 0.159 12 0.794 0.834 0.166 0.206 0.814 0.835 0.165 0.186 13 0.770 0.811 0.189 0.230 0.783 0.819 0.181 0.217 14 0.753 0.801 0.199 0.247 0.758 0.811 0.189 0.242 15 0.711 0.789 0.211 0.289 0.728 0.793 0.207 0.272 16 0.695 0.782 0.218 0.305 0.694 0.785 0.215 0.306 17 0.680 0.767 0.233 0.320 0.677 0.775 0.225 0.323 18 0.647 0.768 0.232 0.353 0.669 0.761 0.239 0.331 19 0.619 0.760 0.240 0.381 0.637 0.772 0.228 0.363 20 0.597 0.755 0.245 0.403 0.623 0.767 0.233 0.377
12 IV. Discussion
This study was conducted to provide a quantitative analysis before implementing light propagation models in a TPS dedicated to GBM treatment by PDT. The comprehensive article written by Jacques et al. previously discussed all light transport models 56 and proposed the
use of a cylindrical diffusion equation for a cylindrical light source (named continuous method in this case). However, as implemented in this study for µa = 0.02 mm-1 and µs’ = 2
mm-1, the discrete method showed an accurate estimation of light distribution, especially for a source length longer than 20 mm compared with the Monte-Carlo results. As detailed in the results section, the mean relative deviation of source length variations was approximately 1.23%, which is acceptable and demonstrates a low sensitivity to the length variation of the diffusor.
Furthermore, in the sensitivity study provided, a slight difference can be observed between the two models: the absorption coefficient affects the continuous model variance more than the discrete model variance (10%). Conversely, the reduced scattering coefficient affects the continuous model variance less than the discrete model (10%). At a distance from the light source greater than 5 mm, the effects of the absorption and reduced scattering coefficients could be considered similar to each analytical model: the reduced scattering coefficient prevails the analytical models’ variance. Because both analytical models have the same sensitivity profile, the results with different tissue with optical coefficients close to the ones chosen in this study would generate the same relative deviation seen previously. For significantly different optical tissue characteristics or different wavelengths of light used in the PDT treatment, the same methodology could be applied to evaluate the sensitivity profiles. Although the continuous model variance is less affected by reduced scattering coefficient than the discrete model variance, the discrete model should provide more accurate estimation of light distribution in a tissue, at a distance greater than the MFP’ from the light source. Regarding PDT planning, the interest in fluence rate estimation is motivated by determining the treatment duration to administer a pre-determined therapeutic fluence value at distances as large as possible from the optical fiber within a reasonable treatment time. Thus, the evaluation of the fluence rate value near to the light source remains subsidiary. Furthermore, during the photodynamic treatment, the radiations emitted have a weak energy and are not ionizing for the patient. In a standard treatment, the only restriction is to achieve a minimal fluence value to obtain a photodynamic effect on the target with a duration acceptable in a surgical context. Underestimations of the light propagation are thus acceptable.
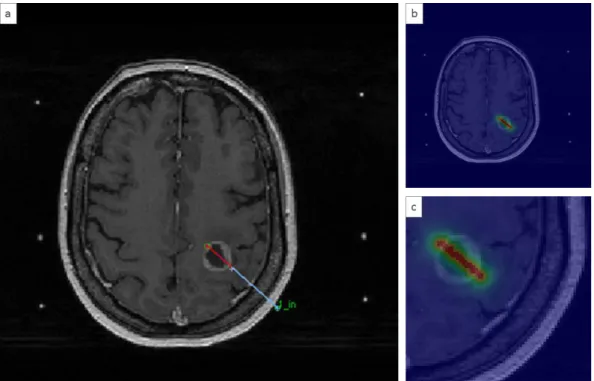
A major advantage of the use of analytical models lies in its simplicity of implementation in a TPS. As seen previously, GBM is strongly heterogeneous, and the analytical models cannot consider this characteristic, which remains a major drawback. Figure 9 represents an illustration taken from a TPS dedicated to iPDT 62. The interstitial fiber depicts two parts: the red line represents the diffusing part, and the blue line represents the non-diffusing part. As shown in Figure 9, the diffusing part passes through several tissues: gray matter, edema and the necrotic core of the tumor. From this position, a fluence rate matrix is computed using an analytical equation. The fluence rate matrix, displayed with a colored look-up table, is placed on top of the MRI image. A homogeneous distribution of the fluence rate values was observed around the diffusing part. No effect was observed on the fluence rate displayed here.
13
Figure 9. Light distribution computed from one single 20 mm cylindrical diffusor in a TPS dedicated to iPDT 62. a) Interstitial fiber, where the red line represents the diffusing part and the blue line represents the non-diffusing part. b) Superposition of the MRI and the fluence rate matrix with a colored look-up table. c) Zoomed in an area where the fiber is inserted. Discretization of the representation matches with the MRI resolution. Here, the fluence rate matrix was computed using the analytical discrete model.
The improvement in parallel GPU computing that drastically decreases the computing time
63-65 ensured strong enthusiasm for developing the Monte-Carlo method for PDT planning 64,66.
With the assistance of automatic tissue segmentation methods 67,68, Monte-Carlo can model the fluence rate according to optical coefficients for each voxel of the MRI volume used for planning. Thus, the fluence rate values computed may consider the optical heterogeneity. Although Monte-Carlo methods provide a more realistic estimation of light distribution into heterogeneous media, the analytical models remain relevant for optimization purposes regarding the placement of fibers with computer-aided treatment planning systems 69-71. By parallelizing analytical methods with GPU-computing, a whole fiber simulation takes only a few tenths of a second. Thus, the optimization of fibers’ localization or inverse planning could be significantly improved 72.
The presence of the non-diffusing part and the numerical aperture of the optical fiber are never considered. These characteristics also influence light emission. Furthermore, as Vesselov et al. showed in their study 73, a significant difference can appear between theoretical fluence rate calculation and measurement from different manufacturers. Ideally, each light source in homogeneity should be considered to reach a more realistic model.
Regarding the implementation, a strong assumption was applied since the variation of the optical properties according to photosensitizer concentration was not considered. Although PS administration modified the optical properties of tissues during treatment 74-76, the impact of PpIX on optical properties has been estimated. According to the study of Vignion-Dewalle et al. 77, a deviation of 0.0019 mm-1 occurs on the absorption coefficient at 635 nm for a PpIX concentration of 1.37.10-5 mol.l-1 (provided from GBM sample resection with a high level of accumulated PpIX 78). The absorption coefficient including PpIX
14
administration is the sum of the initial absorption coefficient (0.02 mm-1) and the PpIX absorption coefficient. Regarding the reduced scattering coefficient, the PpIX administration does not modify the initial coefficient. Thus, PpIX affects a 10% variation on optical coefficients. Variations in optical properties due to photosensitizer accumulation fall in the +/- 50% coefficient variation explored in the sensitivity study; thus, the result of the comparison may not be affected by the presence of the photosensitizer. These estimations are made only for PpIX, which has a low impact on the optical properties of the treatment volume. Another PS might have an impact different from PpIX.
However, the photosensitizer distribution in the tissue should be considered to improve PDT efficacy distribution, rather than just light distribution 79. PDT efficacy may be measured regarding a dosimetric value combining, among others, light fluence rate, duration and sequence of light exposure, and photosensitizer concentration in the tissue 80. This study addresses only one component of PDT dosimetry, which is the light fluence. A complete dosimetric approach would also require knowledge of the oxygenation status along with the photosensitizer concentrations. This approach has already been reported in a recent study where the term photodynamic dose was defined as the total cumulative singlet oxygen produced 77,81. The calculation of this term required the determination of PS absorption and local fluence rate during the treatment progression. Fluorescence can also be an interesting coefficient for monitoring the PpIX uptake82.
V. Conclusion
Several models of light propagation allow the estimation of the fluence rate values inside tissues. In this study, two analytical modeling methods were compared with the Monte-Carlo method considered as a reference. The relative deviation of fluence rate values obtained by these methods allows the evaluation of their validity and accuracy. The discrete method was proved to be closer to the Monte-Carlo fluence rate calculations. Concerning the sensitivity study, the reduced scattering coefficient is the most influential parameter on the variance of both analytical models close to the light source. Conversely, for a distance greater than 3 mm from the light source, the absorption coefficient was shown to be the most influential parameter in both analytical models. Although analytical models do not consider the heterogeneity of biological systems, they still might play an important role in the optimization algorithms of inverse planning technologies.
15
1. Maraninchi D, Cerf N, Bousquet P. Rapport sur la dynamique d'évolution des taux de
mortalité des principaux cancers en France INCa - Inserm;2010.
2. Stupp R. Malignant glioma: ESMO clinical recommendations for diagnosis, treatment and follow-up. Annals of Oncology. 2007;18 Suppl 2:ii69-70.
3. Muquit S, Parks R, Basu S. Socio-economic characteristics of patients with glioblastoma multiforme. Journal of Neuro-Oncology. 2015:1-5.
4. Kenneth R. Hess KRBaMLB. Adult Glioma Incidence Trends in the United States, 1977–2000. Cancer. 2004;101(10):7.
5. Preusser M, de Ribaupierre S, Wöhrer A, et al. Current concepts and management of glioblastoma. Annals of Neurology. 2011;70(1):9-21.
6. Stupp R, Roila F. Malignant glioma: ESMO clinical recommendations for diagnosis, treatment and follow-up. Annals of Oncology. 2009;20 Suppl 4:126-128.
7. Dhermain F. Radiotherapy of high-grade gliomas: current standards and new concepts, innovations in imaging and radiotherapy, and new therapeutic approaches. Chinese
journal of cancer. 2014;33(1):16-24.
8. A SL. Chemotherapy in adult high-grade glioma: a systematic review and meta-analysis of individual patient data from 12 randomised trials. The Lancet. 2002;359(9311):1011-1018.
9. Stupp R, Mason WP, van den Bent MJ, et al. Radiotherapy plus Concomitant and Adjuvant Temozolomide for Glioblastoma. New England Journal of Medicine. 2005;352(10):987-996.
10. Ho VKY, Reijneveld JC, Enting RH, et al. Changing incidence and improved survival of gliomas. European journal of cancer. 2014;50(13):2309-2318.
11. Tetard MC, Vermandel M, Mordon S, Lejeune JP, Reyns N. Experimental use of Photodynamic Therapy in high grade gliomas: a review focused on 5-aminolevulinic acid. Photodiagnosis Photodyn Ther. 2014:19.
12. Johansson A, Faber F, Kniebuhler G, et al. Protoporphyrin IX fluorescence and photobleaching during interstitial photodynamic therapy of malignant gliomas for early treatment prognosis. Lasers in Surgery and Medicine. 2013;45(4):225-234. 13. Beck TJ, Kreth FW, Beyer W, et al. Interstitial photodynamic therapy of nonresectable
malignant glioma recurrences using 5-aminolevulinic acid induced protoporphyrin IX.
Lasers in Surgery and Medicine. 2007;39(5):386-393.
14. Muller PJ, Wilson BC. Photodynamic therapy of brain tumors—A work in progress.
Lasers in Surgery and Medicine. 2006;38(5):384-389.
15. Stylli SS, Kaye AH, MacGregor L, Howes M, Rajendra P. Photodynamic therapy of high grade glioma - long term survival. Journal of Clinical Neuroscience. 2005;12(4):389-398.
16. Bechet D, Mordon SR, Guillemin F, Barberi-Heyob MA. Photodynamic therapy of malignant brain tumours: a complementary approach to conventional therapies.
Cancer Treatement Reviews. 2014;40(2):229-241.
17. Stummer W, Beck T, Beyer W, et al. Long-sustaining response in a patient with non-resectable, distant recurrence of glioblastoma multiforme treated by interstitial photodynamic therapy using 5-ALA: case report. Journal of Neurooncology. 2008;87(1):103-109.
18. Leroy HA, Vermandel M, Lejeune JP, Mordon S, Reyns N. Fluorescence guided resection and glioblastoma in 2015: A review. Lasers in Surgery and Medicine. 2015;47(5):441-451.
19. Cornelius JF, Slotty PJ, Kamp MA, Schneiderhan TM, Steiger HJ, El-Khatib M. Impact of 5-aminolevulinic acid fluorescence-guided surgery on the extent of
16
resection of meningiomas – With special regard to high-grade tumors. Photodiagnosis
and Photodynamic Therapy. 2014;11(4):481-490.
20. Su X, Huang Q-F, Chen H-L, Chen J. Fluorescence-guided resection of high-grade gliomas: A systematic review and meta-analysis. Photodiagnosis and Photodynamic
Therapy. 2014;11(4):451-458.
21. Petterssen M, Eljamel S, Eljamel S. Protoporphyrin-IX fluorescence guided surgical resection in high-grade gliomas: The potential impact of human colour perception.
Photodiagnosis Photodyn Ther. 2014;11(3):351-356.
22. Stummer W, Pichlmeier U, Meinel T, et al. Fluorescence-guided surgery with 5-aminolevulinic acid for resection of malignant glioma: a randomised controlled multicentre phase III trial. Lancet Oncology. 2006;7(5):392-401.
23. Muller PJ, Wilson BC. Photodynamic therapy for recurrent supratentorial gliomas.
Seminars in Surgical Oncology. 1995;11(5):346-354.
24. Muller PJ, Wilson BC. Photodynamic therapy for malignant newly diagnosed supratentorial gliomas. J Clin Laser Med Surg. 1996;14(5):263-270.
25. Dwyer PJ, White WM, Fabian RL, Anderson RR. Optical integrating balloon device for photodynamic therapy. Lasers in Surgery and Medicine. 2000;26(1):58-66.
26. Moseley H, McLean C, Hockaday S, Eljamel S. In vitro light distributions from intracranial PDT balloons. Photodiagnosis Photodyn Ther. 2007;4(3):213-220.
27. Wilson BC, Muller PJ, Yanch JC. Instrumentation and light dosimetry for intra-operative photodynamic therapy (PDT) of malignant brain tumours. Physics in
Medecine and Biology. 1986;31(2):125-133.
28. Hennig G, Stepp H, Johansson A. Photobleaching-based method to individualize irradiation time during interstitial 5-aminolevulinic acid photodynamic therapy.
Photodiagnosis Photodyn Ther. 2011;8(3):275-281.
29. Rendon A, Beck JC, Lilge L. Linear feasibility algorithms for treatment planning in interstitial photodynamic therapy. Paper presented at: Proc. of SPIE Optical Methods for Tumor Treatment and Detection: Mechanisms and Techniques in Photodynamic Therapy XVII2008.
30. Shafirstein G, Bellnier D, Oakley E, et al. Interstitial Photodynamic Therapy-A Focused Review. Cancers (Basel). 2017;9(2):14.
31. Kharroubi Lakouas D, Huglo D, Mordon S, Vermandel M. Nuclear medicine for photodynamic therapy in cancer: planning, monitoring and nuclear PDT.
Photodiagnosis and Photodynamic Therapy. 2017:17.
32. Jacques SL. Optical properties of biological tissues: a review. Physics in Medecine
and Biology. 2013;58(11):R37-61.
33. Wang L, Jacques SL, Zheng L. MCML—Monte Carlo modeling of light transport in multi-layered tissues. Computer methods and programs in biomedicine. 1995;47(2):131-146.
34. Zhu C, Liu Q. Review of Monte Carlo modeling of light transport in tissues. Journal
of biomedical optics. 2013;18(5):13.
35. Mottin S, Panasenko G, Ganesh SS. Multiscale Modeling of Light Absorption in Tissues: Limitations of Classical Homogenization Approach. PloS one. 2010;5(12):e14350.
36. Arridge SR, Hebden JC. Optical imaging in medicine: II. Modelling and reconstruction. Physics in Medicine and Biology. 1997;42(5):841.
37. Oakley E, Bellnier DA, Hutson A, et al. Surface markers for guiding cylindrical diffuser fiber insertion in interstitial photodynamic therapy of head and neck cancer.
17
38. Dimofte A, Finlay JC, Liang X, Zhu TC. Determination of optical properties in heterogeneous turbid media using a cylindrical diffusing fiber. Physics in Medecine
and Biology. 2012;57(19):6025-6046.
39. Johansson A. Spectroscopic Techniques for Photodynamic Therapy Dosimetry: Lunds tekniska högskola. Division of Atomic Physics, Department of Physics, Lund University; 2007.
40. Liang X, Wang KK, Zhu TC. Feasibility of interstitial diffuse optical tomography using cylindrical diffusing fibers for prostate PDT. Physics in Medecine and Biology. 2013;58(10):3461-3480.
41. Sandell JL, Zhu TC. A review of in-vivo optical properties of human tissues and its impact on PDT. Journal of Biophotonics. 2011;4(11-12):773-787.
42. Star WM. The relationship between integrating sphere and diffusion theory calculations of fluence rate at the wall of a spherical cavity. Physics in Medecine and
Biology. 1995;40(1):1-8.
43. Zhu TC, Lu A, Ong YH. An improved analytic function for predicting light fluence rate in circular fields on a semi-infinite geometry. Proceedings of SPIE--the
International Society for Optical Engineering. 2016;9706:97061D.
44. Steiner G, Kirsch M. Optical spectroscopic methods for intraoperative diagnosis. Anal
Bioanal Chem. 2014;406(1):21-25.
45. Valdés PA, Roberts DW, Lu F-K, PhD, Golby A. Optical technologies for intraoperative neurosurgical guidance. Neurosurgical Focus. 2016;40(3):E8.
46. Zhou Y, Liu C-H, Sun Y, et al. Human brain cancer studied by resonance Raman spectroscopy. Journal of biomedical optics. 2012;17(11):116021.
47. Kast R, Auner G, Yurgelevic S, et al. Identification of regions of normal grey matter and white matter from pathologic glioblastoma and necrosis in frozen sections using Raman imaging. Journal of Neurooncology. 2015;125(2):287-295.
48. Kalkanis SN, Kast RE, Rosenblum ML, et al. Raman spectroscopy to distinguish grey matter, necrosis, and glioblastoma multiforme in frozen tissue sections. Journal of
Neurooncology. 2014;116(3):477-485.
49. Roblyer D, O'Sullivan TD, Warren RV, Tromberg B. Feasibility of Direct Digital Sampling for Diffuse Optical Frequency Domain Spectroscopy in Tissue. Meas Sci
Technol. 2013;24(4):045501.
50. Yu G, Durduran T, Furuya D, Greenberg JH, Yodh AG. Frequency-domain multiplexing system for in vivo diffuse light measurements of rapid cerebral hemodynamics. Appl Opt. 2003;42(16):2931-2939.
51. Kienle A, Wetzel C, Bassi A, Comelli D, Taroni P, Pifferi A. Determination of the optical properties of anisotropic biological media using an isotropic diffusion model.
Journal of biomedical optics. 2007;12(1):014026-014026-014029.
52. Villringer A, Chance B. Non-invasive optical spectroscopy and imaging of human brain function. Trends in Neurosciences. 1997;20(10):435-442.
53. Hasselgren L, Galt S, Hard S. Diffusive optical fiber ends for photodynamic therapy: manufacture and analysis. Appl Opt. 1990;29(30):4481-4488.
54. Tedford CE, DeLapp S, Jacques S, Anders J. Quantitative analysis of transcranial and intraparenchymal light penetration in human cadaver brain tissue. Lasers in Surgery
and Medicine. 2015:11.
55. Dimofte A, Finlay JC, Zhu TC. A method for determination of the absorption and scattering properties interstitially in turbid media. Physics in Medecine and Biology. 2005;50(10):2291-2311.
56. Jacques SL, Pogue BW. Tutorial on diffuse light transport. Journal of biomedical
18
57. Prahl SA, Keijzer M, Jacques SL, Welch AJ. A Monte Carlo Model of Light Propagation in Tissue. In: Sliney GJMaDH, ed. SPIE Proceedings of Dosimetry of
Laser Radiation in Medicine and Biology. Vol IS 5.1989:102-111.
58. Baran TM, Foster TH. New Monte Carlo model of cylindrical diffusing fibers illustrates axially heterogeneous fluorescence detection: simulation and experimental validation. Journal of biomedical optics. 2011;16(8):085003-085003-085011.
59. Jacques SL. Coupling 3D Monte Carlo light transport in optically heterogeneous tissues to photoacoustic signal generation. Photoacoustics. 2014;2(4):137-142.
60. Andrea Saltelli MR, Terry Andres, Francesca Campolongo, Jessica Cariboni, Debora Gatelli, Michaela Saisana and Stefano Tarantola. Global Sensitivity Analysis. John Wiley & Sons; 2008.
61. Zhang XY, Trame MN, Lesko LJ, Schmidt S. Sobol Sensitivity Analysis: A Tool to Guide the Development and Evaluation of Systems Pharmacology Models. CPT
Pharmacometrics Syst Pharmacol. 2015;4(2):69-79.
62. Dupont C, Betrouni N, Mordon SR, Reyns N, Vermandel M. 5-ALA Photodynamic Therapy in Neurosurgery, Towards the Design of a Treatment Planning System: A Proof of Concept. IRBM. 2017;38(1):34-41.
63. Ren N, Liang J, Qu X, Li J, Lu B, Tian J. GPU-based Monte Carlo simulation for light propagation in complex heterogeneous tissues. Optics Express. 2010;18(7):6811-6823. 64. Fang Q, Boas DA. Monte Carlo simulation of photon migration in 3D turbid media
accelerated by graphics processing units. Optics Express. 2009;17(22):20178-20190. 65. Alerstam E, Svensson T, Andersson-Engels S. Parallel computing with graphics
processing units for high-speed Monte Carlo simulation of photon migration. Journal
of biomedical optics. 2008;13(6):060504.
66. Cassidy J, Betz V, Lilge L. Treatment plan evaluation for interstitial photodynamic therapy in a mouse model by Monte Carlo simulation with FullMonte. Frontiers in
Physics. 2015;3:1-10.
67. Porz N, Bauer S, Pica A, et al. Multi-modal glioblastoma segmentation: man versus machine. PloS one. 2014;9(5):e96873.
68. Dupont C, Betrouni N, Reyns N, Vermandel M. On image segmentation methods applied to glioblastoma: State of art and new trends. IRBM. 2016.
69. Betrouni N, Colin P, Puech P, Villers A, Mordon S. An image guided treatment platform for prostate cancer photodynamic therapy. Conf Proc IEEE Eng Med Biol
Soc. 2013;2013:370-373.
70. Betrouni N, Lopes R, Puech P, Colin P, Mordon S. A model to estimate the outcome of prostate cancer photodynamic therapy with TOOKAD Soluble WST11. Physics in
Medecine and Biology. 2011;56(15):4771-4783.
71. Cassidy J, Betz V, Lilge L. Monte Carlo fluence simulation for prospective evaluation of interstitial photodynamic therapy treatment plans. Paper presented at: Proc. SPIE Optical Methods for Tumor Treatment and Detection: Mechanisms and Techniques in Photodynamic Therapy XXIV2015.
72. Liu H, Dong P, Xing L. WE-AB-209-02: A New Inverse Planning Framework with Principle-Based Modeling of Inter-Structural Dosimetric Tradeoffs. Medical Physics. 2016;43(6Part39):3801-3801.
73. Vesselov LM, Whittington W, Lilge L. Performance evaluation of cylindrical fiber optic light diffusers for biomedical applications. Lasers in Surgery and Medicine. 2004;34(4):348-351.
74. Finlay JC, Zhu TC, Dimofte A, et al. determination of the absorption and scattering spectra of the human prostate during photodynamic therapy. Proceedings of SPIE--the
19
75. Zhu TC, Finlay JC, Hahn SM. Determination of the distribution of light, optical properties, drug concentration, and tissue oxygenation in-vivo in human prostate during motexafin lutetium-mediated photodynamic therapy. Journal of
Photochemistry and Photobiology B: Biology. 2005;79(3):231-241.
76. Dimofte A, Finlay JC, Sharikova AV, et al. Determination of tissue optical properties in PDT treated Head & Neck patients. Proceedings of SPIE--the International Society
for Optical Engineering. 2014;8926:19.
77. Vignion-Dewalle AS, Betrouni N, Tylcz JB, Vermandel M, Mortier L, Mordon S. Comparison of three light doses in the photodynamic treatment of actinic keratosis using mathematical modeling. Journal of biomedical optics. 2015;20(5):58001.
78. Valdes PA, Kim A, Brantsch M, et al. delta-aminolevulinic acid-induced protoporphyrin IX concentration correlates with histopathologic markers of malignancy in human gliomas: the need for quantitative fluorescence-guided resection to identify regions of increasing malignancy. Neuro Oncology. 2011;13(8):846-856. 79. Beeson K, Parilov E, Potasek M. Overview of computational simulations for PDT
treatments based on optimal choice of singlet oxygen. Paper presented at: Proc. of SPIE Optical Methods for Tumor Treatment and Detection: Mechanisms and Techniques in Photodynamic Therapy XXVI2017.
80. Zhu TC, Finlay JC. The role of photodynamic therapy (PDT) physics. Medical
Physics. 2008;35(7):3127-3136.
81. Li B, Lin L, Lin H, Wilson BC. Photosensitized singlet oxygen generation and detection: Recent advances and future perspectives in cancer photodynamic therapy.
Journal of Biophotonics. 2016:1-12.
82. Saager RB, Cuccia DJ, Saggese S, Kelly KM, Durkin AJ. Quantitative fluorescence imaging of protoporphyrin IX through determination of tissue optical properties in the spatial frequency domain. Journal of biomedical optics. 2011;16(12):126013.

![[PDF] Cours La gestion actif-passif ALM en pdf | Formation Informatique](data:image/gif;base64,R0lGODlhAQABAIAAAP///wAAACH5BAEAAAAALAAAAAABAAEAAAICRAEAOw==)