HAL Id: hal-01242012
https://hal.archives-ouvertes.fr/hal-01242012
Submitted on 11 Dec 2015HAL is a multi-disciplinary open access archive for the deposit and dissemination of sci-entific research documents, whether they are pub-lished or not. The documents may come from teaching and research institutions in France or abroad, or from public or private research centers.
L’archive ouverte pluridisciplinaire HAL, est destinée au dépôt et à la diffusion de documents scientifiques de niveau recherche, publiés ou non, émanant des établissements d’enseignement et de recherche français ou étrangers, des laboratoires publics ou privés.
What Next for Multilateral Trade Talks? Quantifying
the Role of Negotiation Modalities
Yvan Decreux, Lionel Fontagné
To cite this version:
Yvan Decreux, Lionel Fontagné. What Next for Multilateral Trade Talks? Quantifying the Role of Negotiation Modalities. World Trade Review, Cambridge University Press (CUP), 2015, 14 (1), pp.29-43. �10.1017/S1474745614000354�. �hal-01242012�
What next for multilateral trade talks?
Quantifying the role of negotiation modalities
This version: October 11, 2014
Yvan Decreux# - Lionel Fontagné*
Abstract
What are the lessons from the DDA from a forward looking point of view? A decade of negotiations is likely to go nowhere. This paper argues that absence of a landing-zone was in the data. Quantitative tools modelling the detail of the modalities predicted failure but were not taken seriously: the design of the negotiation implied that any achievements of the Round could only be limited. Such feebleness was induced by the way multilateral negotiations were organized – in separate groups, without much consideration for, or understanding of, how the different elements added up to more than the sum of the parts. We put sensible figures on that argument by using a dynamic computable general equilibrium model of the world economy, addressing exceptions, flexibilities as well as the non-linear design of the liberalization formulas, a reduction in domestic support, the phasing out of export subsidies in agriculture, as well as trade facilitation. Our conclusion is that negotiators have to go back to simplicity and re-bundle the topics if they wish to revamp multilateral negotiations.
JEL Classification: F13, F17
Keywords: Doha Development Round, Computable General Equilibrium Models, Trade facilitation
# International Trade Center, Geneva
*Paris School of Economics (University Paris 1) and CEPII, corresponding author. Email: [email protected]
1. I
NTRODUCTION1A decade of multilateral trade negotiations has gone nowhere. What do we learn from this failure? We know from recent analyses of the Doha Development Agenda (DDA) that the very design of the negotiations, combining complex modalities, extensive exemptions, attempts to rebalance concessions through sectoral initiatives and efforts to decouple deals, led to failure (Wolfe, 2015; Laborde and Martin, 2015). In this article we put precise figures on the dilemma of finding ways of conducting negotiations to reach a deal that delivers gains big enough to make the negotiation worth the induced political cost of concessions. We show that the absence of a landing zone is clearly revealed by careful modelling of the likely impacts of the potential deals that were being considered. Results of such quantitative modelling exercises were not taken seriously, even though they provided early warning signals to the negotiators. We argue that the same is true for the late stage effort in early 2011 pushed by the US administration and partially endorsed by the European Commission to introduce sectoral liberalization initiatives in the final package. Emerging economies were reluctant to sign up to such initiatives because they could have had sizeable impacts on some of the sectors concerned.
On 29 March 2011, the Director General of the WTO declared that “[it was] time (…), to reflect on the consequences of failure” stating that “The absence of progress in NAMA sectorals constitutes today a major obstacle to progress on to the remaining market access issues”. By June 2011, it was clear that completion of a comprehensive agreement on all the DDA topics was impossible by the end of that year. The 8th WTO Ministerial Conference in December 2011,
welcoming the accession of Russia (as well as Samoa and Montenegro), did not have an “in-depth debate about the DDA” according to the then Director General, Pascal Lamy. In 2013 his successor, Roberto Azevedo, managed to convince WTO Members to reach a deal on a limited number of issues at the WTO Ministerial Conference in Bali (December 2013), including on trade facilitation. But hopes for a revitalized negotiating effort to conclude the DDA were again dashed in the course of 2014.
The world economy has changed dramatically since the launch of the DDA in 2001. A number of emerging economies have become major players. The 2008 global financial crisis and its aftermath implied a major shock to the global economy and has lowered growth prospects in
1 This is a major revision of a paper circulated under the title: Economic Impact of Potential
Outcome of the DDA. We thank Bernard Hoekman, Alan Winters, a referee and participants in the conference “The Multilateral Trading System in the 21st Century”, Washington 18-19 April
some regions. The significant changes in the geopolitical context raise many questions concerning the fundamentals of the WTO which are unlikely to be addressed in the 12-month period negotiators agreed on in Bali (Aggarwal and Evenett, 2013; Bureau and Jean, 2013). One of the big obstacles to a deal is that negotiators have been constrained by a too small negotiating set (Evenett, 2014). If the conclusion is that the landing zone is indeed too small, then the implication is new issues need to be added. Alternatively, the problem may be more of an artefact of the way negotiations were organized (and analysed) – meaning separately for agriculture, NAMA, services and trade facilitation. Negotiating in separate groups, without much understanding of how the different elements added up to more than the sum of the parts, has been an incentive for introducing several exceptions and sensitive issues making it difficult to ultimately deliver. Rebundling the topics would be justified by a new pattern of the world economy: the fragmentation of production (Baldwin, 2011; Hoekman, 2014a). Given the increasing importance of Global Value Chains – a new reality of the world economy tightly linking developed, emerging and developing economies in goods and services trade – there is shared interest of exporters and importers in securing market access and facilitating trade, which reinforces the need to make progress on the fronts of trade facilitation and services.2
The empirical relevance of this nexus is illustrated by the (non)-proliferation of protectionist measures after the trade collapse of 2008-9. This is not only due to WTO disciplines, but reflects the interdependence of countries within global chains, which reduced incentives to use protectionism in response to the crisis (see Gawande et al., 2014).3
Our argument is that beyond the lack of political commitment to conclude the round, tactical errors, or the deleterious climate created by the global crisis after 2008, most of the difficulties of the DDA were intrinsic to the design of the negotiations. While effort was devoted initially to designing general liberalization formulae, exceptions to shield products and sectors and countries from the domestic political economy consequences of the resulting systematic cuts in protection ignored consideration of the overall gains of concluding the Round (Laborde and Martin, 2015). General formulas gave rise to demands for exceptions, including country-specific provisions to reflect the inability of the WTO membership of addressing the issue of graduation from developing country status. Some countries demanded additional flexibilities; (very) recently acceded members negotiated differential treatment as they had already
2 Karmakar (2013) acknowledges the importance of negotiating with GVCs in mind, but suggests
to close the Round as soon as possible in to order to launch a specific Round on that issue.
3 Using trade and protection data for a series of large emerging countries, Gawande et al. (2014)
show that participation in global value chains was a powerful economic factor determining countries’ trade policy responses to the trade collapse.
committed to phase out a significant part of their protection; the least developed countries (LDCs) were exempted from tariff reductions, and provisions were also included for small and vulnerable economies and countries with low levels of tariff binding. As general (MFN) tariff reductions are a source of preference erosion, specific solutions were sought for the affected countries, which in turn might well harm countries that did not benefit from preferential access. All in all, any text combining all these elements would not only be very complex for many countries, it would not lead to an improvement in market access significant enough to justify the negotiation effort.
Bagwell and Staiger (2011) argue there is a “latecomer problem”: given initial starting points in terms of levels of protection and the fact that the principle of SDT applies to all developing countries, they suggest there is no way of reaching a balanced deal on trade in goods only. Within the narrow negotiating agenda on goods trade, negotiators from major developed countries raised requests for deeper tariff reduction (on a voluntary basis) and other “zero tariff initiatives” in the last stages of the negotiations before they broke down once again. The purpose was to restore more “reciprocity” in the concessions. But such “rebalancing” would have imposed a sharp redistribution in the gains and concessions among the players: there was ultimately no landing zone for the negotiations without considering a broader agenda including services and trade facilitation.
This view is shared by many commenters and experts. Our contribution here is to put numbers on the impasse and discuss implications for the way forward. We conduct an exercise to quantify the economic impact of a deal. We integrate the most recent proposals circulated in the DDA and calculate the possible gains to be reaped. Our results regarding the magnitude of the global gains associated with a successful round is even more pessimistic than the previous literature assessing the economic impact of a successful Doha round.4
The rest of the paper is organized as follows. Section 2 presents the quantifying assumptions. Overall results are presented in Section 3. Section 4 concludes.
2. S
OURCES AND QUANTIFYING ASSUMPTIONSThe intricate nature of the proposals discussed by WTO negotiators in the past decade, which include numerous exceptions to a series of rules applied at product level, imposes a specific
4 Francois et al. (2005) obtain a 5% to 11% increase in world trade and a 0.3% to 0.5% increase
in world GDP. Bouët and Laborde (2010-b) estimate hypothetical outcomes of the Doha Round. In their most ambitious scenario, world output grows by 0.4%.
modelling strategy. The state of the art in the applied trade literature is measurement of border protection for goods at the most detailed level possible (product, importer, exporter), and computation of liberalisation resulting from a tariff-cutting formula. Bound and applied duties (whether ad valorem, specific, mixed or compound) need to be measured at the HS-6 product level (the most disaggregated level for which harmonised information is available). In contrast, detailed information on trade facilitation is sparse and one must rely on cruder estimates. This is also the case for the other potential big chunk of the gains to be expected, namely trade in services. In the latter case, information on the exact impact of regulatory measures is much less disaggregated than for goods, and strong assumptions must be made to extract quantified measures from the existing qualitative evidence on regulations. We examine the impact of the scenarios by taking into account interactions between sectors, countries and markets, which is done with MIRAGE (Decreux and Valin, 2007), a dynamic CGE model of the world economy that allows for imperfect competition.5 It is only when all these elements of
complexity are jointly taken into account that the reasons of the failure can convincingly be assessed.
Negotiating design for goods and services
The creativity demonstrated by negotiators to find a politically acceptable deal was very impressive, but it resulted in adding layers of complexity to the negotiations and greatly reduced the transparency of the process. A very simple modality, such as use of a non-linear tariff cut formula applied to every tariff line as opposed to negotiating product by product, is a very convenient design to start with. If properly calibrated, such a measure can have a significant effect in lowering tariff peaks and, accordingly, greatly reduce induced distortions. It simplifies negotiation over reciprocal concessions among the large number of participating countries. However, exceptions necessarily arise due to internal resistance among negotiating countries.6 Minimum or maximum average cuts are then added to the liberalisation scheme.
Less strict treatment was proposed for small and vulnerable economies; membership of a customs union implied specific treatments for some members as well as a number of exceptions. Specific issues, such a tropical products or tariff escalation, were addressed by modifications to the general pattern of modalities. Flexibilities followed some rules to ensure that some tariffs would be reduced in all HS chapters. All these issues are taken into
5 MIRAGE relied in this exercise on GTAP-8 data for 2004. The 2004 picture of the world
protection takes account assumes implementation of the EU-Korea free trade agreement.
consideration in the analysis that follows, which seeks to accurately characterize the complexity of the negotiating set that led to the deadlock.
Sectoral initiatives concerning chemicals, machinery and electronic products deserve special attention, as this negotiating device was used in an effort to rebalance concessions in a simple way. These are considered in two of our scenarios.7 For services, three problems have to be
tackled. First, negotiators devoted limited effort to that area, so that little was known regarding the possible contours of a successful deal. Thus, we are obliged to rely on partial information and to assume what could be the ultimate achievements. Second, we do not have for services the kind of information that we can rely on for barriers to trade in goods. Services trade is impeded by regulatory obstacles for which tariff equivalents must be computed as a first step. We use here estimates by Fontagné et al. (2011). Third, there is a big question regarding the proper modelling of the effects of regulatory barriers, especially whether they are rent-creating or cost-enhancing. In communication and transport, we assume regulatory barriers allow selected companies to increase their profit margins to their own benefit. This is modelled as an export tax, thus mostly benefiting the exporting country. In other services, barriers are assumed to be cost-increasing, and are modelled as implying an additional iceberg trade cost. In other words, the barriers imply a need for additional inputs of all types (intermediate consumption and factors) to deliver the service to its final user.
Modelling of the modalities
The reference situation over the whole period is defined by the trajectory of the world economy up to 2013 forecast by the International Monetary Fund. From 2013 onwards we use the forecast by CEPII based on a three-factor (labour, capital, energy) growth model (Fouré et al., 2010). In this model, total population and labour force are from the usual sources (International Labour Organization and United Nations), human capital formation is forecast on the basis of a catching up process, investment relies on savings, savings are derived from a life cycle assumption, and total factor productivity (TFP) and energy efficiency are also forecast. Population and GDP are imposed on MIRAGE for every country or region and TFP adjusts endogenously at country level in the pre-experiment, with no difference between sectors. We perform simulations of various shocks using these TFP changes as exogenous variables. The oil (and primary resources) price is endogenous in the model and 2004 resources are kept constant. This implies that the oil price is multiplied by 2.2 compared to world GDP price for 2004-2025 in the reference scenario.
For the NAMA negotiations as well as those on agriculture, we model yearly tariff cuts at the product (HS6) and country levels, before aggregation into the regional and sectoral decompositions of the model (see the on-line Appendix for details on aggregations used). This takes account of the difference between bound and applied tariffs. In addition, we model the reduction in internal support for agricultural products and the phasing out of export subsidies. We also introduce trade facilitation in the analysis, modelling this as a reduction in time at the frontier (customs procedures and time at the port). Transportation time to/from the port can vary widely due to the different country sizes, but no improvement is assumed for this trade cost. Our trade facilitation experiment consists of dividing by two the processing time exceeding the median level, for each category of trade costs (customs and port).8 Only
members of the WTO engage in the process. We assume that trade facilitation can be achieved at no cost, although countries may incur some costs to implement it, for example, the need to purchase modern equipment to process goods at the ports and to cope with customs procedures.9 These costs are not incorporated in the model because of the absence of data.
However, the gains implied by a rather moderate scenario are quite significant and, thus, likely to outweigh any costs within a short period of time.10 Since industrialised countries also
benefit from trade facilitation, they committed to assist developing countries implement trade facilitation reforms through the “aid for trade” scheme, which will alleviate the cost of improving trade facilitation.
As mentioned, trade in services is another important topic for multilateral trade negotiations in particular in light of the presence of Global Value Chains. We adopt here a realistic and very cautious assumption on what can be reaped in this area. We assume a 3% reduction in protection, limited to all industrialised, most Latin American countries, and Asia except Central Asia. Greater ambition on this front could help ease negotiations on other topics.11
8 As performance may vary considerably across regions, we group countries by continents to
compute this median and chose the closest median, world or continent, in order to avoid simulating unrealistic improvements in Europe or Asia.
9 Trade facilitation can also generate a cost by diverting qualified people from other productive
sectors.
10 See Hoekman (2014b) for a review of research on this question and a discussion of the Bali
Trade Facilitation Agreement.
11 Most of the action might take place in terms of binding, which has a value per se though not
captured by the usual modelling strategies. See Gootiiz and Mattoo (2009) for more details on services in the DDA.
We finally take care of describing precisely the intricate series of flexibilities cushioning the impact of the formulas. We introduce flexibilities for special and sensitive products; we exempt the LDCs from tariff reductions; consolidate the unbound tariffs; take account of all additional elements contained in the most recent Draft Modalities; and address the specific role of sectoral initiatives (see the on-line Appendix for detailed descriptions of the analysis).
The scenarios
Five scenarios are implemented to characterize the complexity of the negotiating set. These scenarios are defined in terms of product categories and initiatives. There are two product categories: agricultural and non-agricultural. Services are treated separately. Agricultural (raw agricultural and food) products correspond to 677 HS6 products in the HS classification of 1996 used in the tariff database MAcMap. Fisheries are part of NAMA.12
Table 1 summarises the different shocks introduced in the exercise. In all scenarios (unless otherwise specified), phasing out is linearly applied over a 5 year period for developed countries (10 years for developing countries). Recently acceded members were to be granted longer periods; we make the simplifying assumption of 12 years. The tariff cut concerns all developed countries (including Korea) and the following developing countries: Argentina, Brazil, Chile, Colombia, Peru, Paraguay, Uruguay, Mexico, China, India, Indonesia, Malaysia, Philippines, Taiwan, and Thailand. LDCs were not asked to reduce their tariffs; they were only to increase the binding coverage. They also benefit from the duty-free, quota-free preferential access initiative according to which at least 97% of their tariff lines will be able to enter developed countries without tariffs or quotas. Note that this initiative has no impact in the EU case, as the Everything but Arms initiative already ensures LDCs duty free access.
Table 1: Description of the scenarios Agriculture +NAMA Services Trade facilitation Chemicals, electronics & machinery Environmental goods S1 Goods x
S2 Goods & serv. x x
S3 Benchmark x x x
S4 Sectoral x x x x
S5 Environment x x x x x
The first scenario concerns the effects of the modalities for agriculture and NAMA. The three pillars for agriculture are introduced, while NAMA uses coefficients for the Swiss formula (see the on-line Appendix for details). The next two scenarios assess what re-bundling the multilateral negotiations could mean by adding services and trade facilitation. The second scenario adds a 3% reduction in the equivalent tariff of protection on trade in services. The third scenario includes the effects of trade facilitation, modelled along the lines noted above. We address only customs efficiency improvements, which give rise to only limited implementation costs (Hoekman, 2014b). The final two scenarios add sectorals to the mix and illustrate how efforts to rebalance a potential deal in this way is counter-productive. The fourth scenario focuses on sectoral initiatives for chemicals, electronic products and machinery. The last scenario adds to this an initiative on environmental goods. 13
3. R
ESULTSFrom the current period until 2025, each scenario is implemented with a yearly step, following the liberalisation schedule. Results below are presented as deviations from the baseline for each scenario.
Too much complexity, too little gain
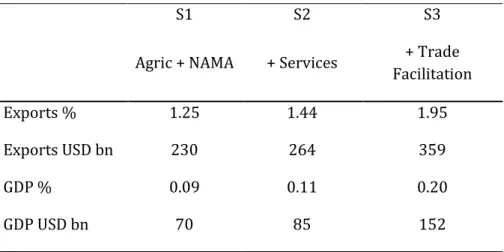
Table 2 shows the overall impact of our benchmark scenario. The long run effect of the envisaged trade liberalisation in goods (only) amounts to a limited 0.09% of world GDP
13 We use the WTO list of environmental products. See Committee on Trade and Environment
annually (US$ 70 bn in 2025).14 There is an overall increase in world exports of goods of
1.25%, or US$ 230 bn annually. The reason for such limited gains has been repeatedly documented in the literature: introducing flexibilities reduces the overall impact of any deal (Jean et al., 2010). As previous GATT Rounds led to much lower mean tariffs for goods, the focus of tariff negotiations is now largely on remaining tariff peaks. The rather aggressive non-linear formula that was adopted in the DDA clashed with the political economy of the domestic acceptability of a deal.
Table 2: Increases per year in world GDP and exports in long run relative to baseline
S1 S2 S3
Agric + NAMA + Services + Trade Facilitation
Exports % 1.25 1.44 1.95
Exports USD bn 230 264 359
GDP % 0.09 0.11 0.20
GDP USD bn 70 85 152
Note: Long run is 2025. Gains are in constant (2004) dollars, relative to 2025 economic values.
Source: Author’s calculation using MIRAGE
The implication of this first set of aggregate results has not been taken seriously by the negotiators: that the kind of negotiation in which they embarked was too complex to deliver substantial gains. Not measured here is the fact that a successful Round of multilateral negotiations would dampen the risks of a resurgence of protectionism, either within the strict boundaries of WTO rules (e.g. an increase in tariffs up to their bounds), at the fringes of it (generalising contingent protection), or outside of it (unilateral increases in protection). Such resurgence would have a cost corresponding to a multiple of the gains considered here (Bouët and Laborde, 2010-a). Similarly, Hoekman, Martin and Mattoo (2010) insist on the greater security for market access that would be provided by a succesful Round and dismiss the idea of a dramatic trade liberalization associated with the completion of the DDA.
14 In this paper, “long run” implies year 2025 even though dynamic welfare/GDP gains will
continue for longer, leading to slightly larger actual long term gains (see Figure 1). Percentage deviations are translated into US$ on the basis of current year value (for GDP, exports, etc.) at constant 2004 prices. Hence, the long-run gain in US$ is the annual deviation from the baseline in 2025, at constant prices.
Given the very conservative assumption of a 3% liberalisation of trade in certain services, limited to certain importers, the services scenario adds only US$ 15 bn gains in world GDP. In trade terms, changes are more important: we obtain an additional US$ 34 bn world trade. The impacts of greater ambition can be assessed, as a first approximation (neglecting general equilibrium effects), by simple extrapolation.15
The benefits of re-bundling the negotiation elements are evident when we add the gains from trade facilitation. In that case, we can expect a further US$ 68 bn annual increase in world GDP from 2025 onwards. A large part of the additional gains would accrue to developing economies where the scope for improved performance in terms of custom efficiency and trade costs are the highest. This is consistent with econometric assessments of the potential impacts of a reduction in trade costs (e.g., Hoekman and Nicita, 2010).
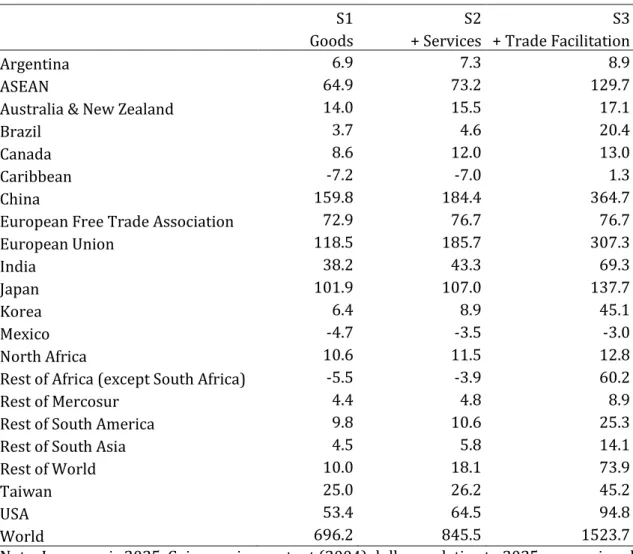
Table 3 presents these long term GDP gains at regional or country level.16 In dollar terms,
China, the EU and Japan17 reap respectively 23%, 17% and 15% of world gains from a goods
scenario. US gains are smaller (8% of the world total) compared to its relative size in the world economy. Three regions suffer small losses: the Caribbean, Mexico and the Sub-Saharan countries due to erosion of preferences.18
These gains are small relative to the size of the countries, raising the question whether the potential gains justify the effort needed to obtain any deal of that kind. Indeed, even modest progress on the services front changes the outcome for some of the major players. The EU and the US would increase gains by 57% and 21%, respectively. Canada and Korea would also benefit significantly.
Lastly, re-bundling trade in goods and services with trade facilitation should ease the negotiations. Trade facilitation results in a shift for Sub-Saharan Africa from a limited loss (goods only) to a sizeable US$ 6.4bn GDP gain. Brazilian GDP gains (compared to goods only) are multiplied by 5.6, Chinese gains by 2.3, Indian gains by 1.8. Though developed countries would also reap benefits from trade facilitation (e.g., Korea, EU and US), there are no clearly identifiable concessions by key trading partners that could be used to increase support for the
15 Recall that effects, for limited changes in variables, are linear.
16 Introducing port efficiency on the top of our modelling of trade facilitation would not change
the results qualitatively, but would add another US$ 34bn to world GDP. Results are not presented here for sake of simplicity. All countries would gain, China and the EU the most.
17 Detailed analysis reveals a very significant increase in Japanese car production.
18 However, as noted below, in two of these regions (Caribbean and Sub-Saharan Africa – SSA)
negotiations. Hence the push for more aggressive tariff cuts through the so-called “sectorals” discussed below.
Table 3: Long run deviation from the baseline, GDP, USDbn
S1 S2 S3
Goods + Services + Trade Facilitation
Argentina 6.9 7.3 8.9
ASEAN 64.9 73.2 129.7
Australia & New Zealand 14.0 15.5 17.1
Brazil 3.7 4.6 20.4
Canada 8.6 12.0 13.0
Caribbean -7.2 -7.0 1.3
China 159.8 184.4 364.7
European Free Trade Association 72.9 76.7 76.7
European Union 118.5 185.7 307.3 India 38.2 43.3 69.3 Japan 101.9 107.0 137.7 Korea 6.4 8.9 45.1 Mexico -4.7 -3.5 -3.0 North Africa 10.6 11.5 12.8
Rest of Africa (except South Africa) -5.5 -3.9 60.2
Rest of Mercosur 4.4 4.8 8.9
Rest of South America 9.8 10.6 25.3
Rest of South Asia 4.5 5.8 14.1
Rest of World 10.0 18.1 73.9
Taiwan 25.0 26.2 45.2
USA 53.4 64.5 94.8
World 696.2 845.5 1523.7
Note: Long run is 2025. Gains are in constant (2004) dollars, relative to 2025 economic values. Source: Author’s calculation using MIRAGE
A comparison of the sectoral and regional results of a scenario combining liberalisation in agriculture and manufactures as defined above with services liberalization and trade facilitation helps to understand the landing zone constraint (see Table A-4 of the on-line Appendix for a scenario consolidating advances on goods and rebalancing with services and trade facilitation). In agriculture, the two main beneficiaries of such scenario in terms of exports are Australia and New Zealand (+13.7%) and North Africa (+15.8%). Brazil also gains in agriculture (+8.7%) but less than China in percentage terms given the initial levels. The second largest gains in industrial exports behind Asia (in the range of +3 to +4% for China, ASEAN, Korea and Japan) are in the EU and in the US (+3.4% for each region). Industrial
exports in Argentina and Canada retrench due to the agricultural specialisation of the two countries. Interestingly, North Africa increases strongly its export of services, but from low levels.
In terms of overall agricultural production, Australia and New Zealand benefit the most from increased exports because they are more open to international trade (results are reported in Table A-5 of the on-line Appendix). Brazil, Argentina and Canada come next. EU production falls by 1.2% only. Japan experiences a 4% decrease in agricultural production. Due to their very strong initial protection, the EFTA countries face the strongest reduction for agriculture production and reorient their resources toward the other sectors (with large efficiency gains showing up in overall GDP gains). China and India are hardly affected.
In the aggregate, all variations in regional level industrial production are below 2% (in absolute terms), the main winners being ASEAN, Japan and Korea. Australia, New-Zealand and Brazil show value added losses in industry, offsetting gains in agriculture. Canada, the Caribbean countries and Mexico are also negatively affected by losing their initially favourable access to the US market for industrial goods. Asia is the largest gainer from these changes. The US and European industries show a negligible impact on industrial production.
Production of services is less affected, with variations of less than 1% (in absolute terms) as a result of the Round’s limited ambitions for services.
Rebalancing with sectorals won’t do the job
Rather than rebalancing of the agriculture and NAMA negotiations by including services and trade facilitation, some governments sought instead to add three broad sector-specific tariff liberalization agreements on chemicals, machinery, and electronics (these would exclude the LDCs). Environmental goods are another area for which sectoral negotiations were proposed (and the only one where negotiations are currently ongoing). The data show that such attempts to fix the problem of limited and unbalanced gains do not offer a solution to the more general problem of a badly designed negotiating agenda.
To illustrate this, we make the simplifying assumption that such sectoral initiatives are endorsed by all developed countries (including Korea) and will include (optimistically) a number of developing countries.19 The first three columns of Table 6 report the long run
19 This is not very realistic, but is of course what the demandeurs are seeking. We chose
Argentina, Brazil, Chile, Colombia, Peru, Paraguay, Uruguay, Mexico, China, India, Indonesia, Malaysia, Philippines, Taiwan and Thailand. In the WTO, Korea is considered a developed country for industrial goods, but not for agricultural goods.
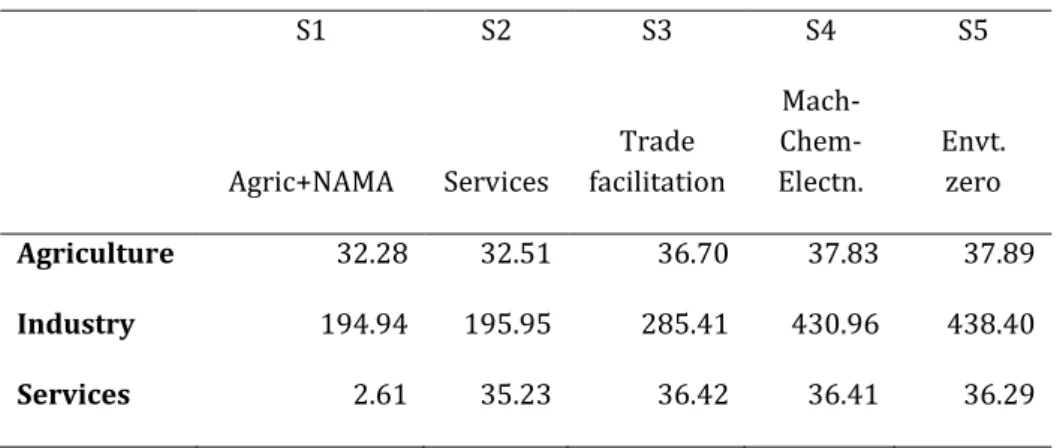
change in the volume of trade (in US$bn), associated with the scenarios discussed above. Column (1) presents the long run changes in world trade of agricultural and industrial goods and services compared to the baseline, associated with a deal for agriculture and the NAMA. The US$ 2.6 bn increase in trade in services is a pure general equilibrium effect of this goods-only agreement. Table 6, column (2) includes limited liberalisation in services. Again, we observe small general equilibrium effects on trade in goods. The US$35 billion increase in exchange of services is an important achievement that matches additional trade in agricultural goods. Table 6, Column (3) illustrates that the impact of trade facilitation is shared among agricultural and industrial goods, and general equilibrium effects on trade in services are visible again. Agricultural exports increase by another 12% and manufactured exports by another 46%. This reveals how customs red tape and additional time costs penalises agricultural – and potentially perishable – goods.
Table 6: Long run change in the volume of trade (bn USD)
S1 S2 S3 S4 S5 Agric+NAMA Services Trade facilitation Mach- Chem-Electn. Envt. zero Agriculture 32.28 32.51 36.70 37.83 37.89 Industry 194.94 195.95 285.41 430.96 438.40 Services 2.61 35.23 36.42 36.41 36.29
Note: S1: agriculture + NAMA; S2: agriculture + NAMA + services; S3: agriculture + NAMA + services + trade facilitation; S4: agriculture + NAMA + services + trade facilitation + sectorals except environmental goods; S5: agriculture + NAMA + services + trade facilitation + sectorals including zero tariffs initiative on environmental goods
Source: Author’s calculation using MIRAGE
The last two columns of Table 6 report the long run change in the volume of trade for the two sectoral initiatives. They must be compared with Column 3. Table 6 Column 4 reports a US$ 145.6bn increase in trade in industrial goods from including the first set of sectoral initiatives (chemicals, machinery, electronics). The general equilibrium effects on agriculture remain visible, although small, and there is no effect on trade in services. In Column 5, the sectoral initiative on environmental goods is added to the three others. Its impact on trade is negligible overall, as gains are in line with the limited product coverage of this proposal (168 HS6 lines compared with 430 for machinery, 440 for electronic products and 910 lines for chemicals).
Table 7: Long run change in the volume of imports (percent): selected market and sectors S1 S2 S3 S4 S5 China Chemicals 8.61 8.62 13.41 33.25 33.22 Electronic equipment 1.69 1.68 2.23 5.42 5.38 Machinery 6.55 6.58 8.46 23.83 24.13 India Chemicals 1.94 1.93 5.67 47.65 47.63 Electronic equipment -1.03 -1.09 1.11 2.34 2.30 Machinery 8.30 8.17 11.03 61.91 62.80 Mexico Chemicals 0.14 0.13 0.09 6.69 6.57 Electronic equipment -0.10 -0.10 -0.02 4.07 4.00 Machinery 1.32 1.30 1.24 15.01 15.18 Brazil Chemicals 5.36 5.31 7.03 7.86 7.86 Electronic equipment 1.15 1.11 1.99 2.95 2.93 Machinery 5.39 5.30 6.70 7.78 7.78
Source: Author’s calculation using MIRAGE
Clearly plurilateral sectoral deals are appealing from a mercantilist point of view and this helps explain why negotiators might be tempted to push such proposals, and may do so again in the future. But importantly, the political economy of the sectoral initiatives is not favourable: big players like India or China, would be confronted with large surge in imports in key sectors if the sectorals were adopted.20 This is illustrated for selected emerging countries
and sectors in Table 7. China would record a 33% increase in imports of Chemicals by 2025, instead of 13% in our central scenario including trade facilitation. The corresponding figures are 24% and 8% for Chinese imports of Machinery. The import response is even larger for India, with 47% and 62% for Chemicals and Machinery respectively. Hence, sectoral initiatives were not (and will not) be able to rebalance the implications of the excessively complex negotiating modalities.
Conclusion
20 Results on the sectoral initiatives translate into changes in GDP by region are reported in the
on-line Appendix. With the sectoral initiative on chemicals, machinery and electronics and environment as a whole, Indian GDP gains are largely reduced. Limited losses are also observed in Brazil. China, which has offensive interests in certain sectors concerned by the initiatives, would gain in terms of GDP overall, but this needs to be put in perspective of the large increase in imports in certain sectors.
What have we learned from the failure of over a decade of market access negotiations? The quantification undertaken here illustrates that very complex modalities of negotiation and ad hoc efforts to rebalance a deal may not provide any landing zone for negotiators. The combination of various formulae, exceptions and flexibilities for goods, and finally sectoral initiatives was too complex and offered too little visibility for negotiators as well as for civil society. Limited gains could be expected from the negotiations on trade in goods, the main focus of the negotiators and policy makers. All in all, the overall design of the deal finally considered was particularly unattractive to certain big players. The ultimate Indian attitude towards the negotiation was predictable. The quantitative results of simulation models circulated during the DDA negotiations provided clear warnings that were not taken seriously. From a forward looking perspective, in our view it is evident that greater simplicity is a necessary condition for success. Too much ambition in terms of tariff cuts led to the introduction of a series of exceptions and exclusions that greatly reduced potential gains. A major underlying reason for this outcome is the inability of the WTO membership to address the issue of coverage of special and differential treatment and graduation from developing country status. But negotiators also need to do a better job of bundling subjects so as to increase the potential gains from a deal for all concerned.
References
Aggarwal , V., and S. Evenett (2013), A Fragmenting Global Economy: A Weakened WTO, Mega FTAs, and Murky Protectionism, Swiss Political Science Review, 19(4): 550–557.
Bagwell K., Staiger R.W. (2011). Can The Doha Round Be A Development Round? Setting A Place at the Table. NBER Working Paper 17650.
Baldwin R. (2011), Trade and Industrialisation after Globallisation’s 2nd Unbundling: How
Building and Joining A Supply Chain Are Different and Why It Matters., NBER working paper, 17716.
Bouët A., Decreux Y., Fontagné L., Jean S. Laborde D. (2008), Assessing Applied Protection Across the World, Review of International Economics, 16(5): 850-863.
Bouët A, Laborde D. (2010), Assessing the potential cost of a failed Doha round, World Trade Review, 9(2): 319-59.
Bouët A., Laborde D. (2010), Why is the Doha Development Agenda Failing? And What Can be Done: A computable general equilibrium-game theoretical approach? The World Economy, 33(11): 1486-1516.
Bureau J.C., Jean S. (2013), Trade Liberalization in the Bio-Economy : Coping with a new Landscape, CEPII Working paper 2013-15.
Decreux Y., Ramos M.P. (2007), How does Tariff-rate quota modelling affect CGE results? An application for MIRAGE, TradeAg Working Paper 2007-16.
Decreux Y., Valin H. (2007), MIRAGE, updated version of the model for trade policy analysis: focus on agriculture and dynamics, CEPII working paper, 2007-15.
Evenett, S. (2014) “The Doha Round impasse: A graphical account,” Review of International Organizations, 9(2):143–62.
Fouré J., Bénassy-Quéré A., Fontagné L. (2010), The World Economy in 2050: a Tentative Picture, Working Papers 2010-27, CEPII, Paris.
Fontagné L, Fouré J., Ramos M.P. (2011), A new baseline for MIRAGE, Working Paper, CEPII, Paris forthcoming.
Fontagné L., Guillin A., Mitaritonna C. (2011), Estimations of Tariff Equivalents for the Services Sectors, CEPII Working Paper, 2011-24.
Francois J., van Meijl, van Tongeren F. (2005), Trade liberalization in the Doha Development Round, Economic Policy, 42:349-391.
Gootiiz B., Mattoo A. (2009), Services in Doha: What’s on the table? World Bank Policy Research Working Paper, 4903.
Gouël C., Guillin A., Ramos M.P. (2008), The Effects of Agricultural Policies on Developing Countries at a Detail Level, TradeAg Working Paper 2008.
Gouël C., Guillin A., Ramos M.P. (2011), Sensitive products in the Doha negotiations: the case of European and Japanese market access. Economic Modelling, 28(6): 2395-2403.
Hoekman, B. 2014a. Supply Chains, Mega-Regionals and Multilateralism: A Road Map for the WTO. London: CEPR Press.
Hoekman, B. 2014b. “The Bali Trade Facilitation Agreement and rulemaking in the WTO: milestone, mistake or mirage?, EUI, RSCAS Working Paper, 2014/102
Hoekman B., Nicita A. (2010), Assessing the Doha Round: Market access, transactions costs and aid for trade facilitation, Journal of International Trade and Economic development, 19(1): 65-79.
Hoekman B., Martin W., Mattoo A. (2010), Conclude Doha: it matters!, World Trade review, 0(3): 503-530.
Jean S., Laborde D., Martin W. (2010), Formulas and Flexibility in Trade Negotiations: Sensitive Agricultural Products in the World Trade Organization's Doha Agenda, World Bank economic Review, 24 (3): 500-519.
Lacey, S. (2013), Life after Doha: Reflections in the run up to MC9, in Fukunaga, Y., J. Riady, and P. Sauvé (eds.), The Road to Bali: ERIA Perspectives on the WTO Ministerial and Asian Integration . ERIA Research Project Report 2012-31, Jakarta: ERIA, UPH and WTI, pp. 192-219.
Gawande K., B. Hoekman and Y. Cui Y. (2014), Global Supply Chains and Trade Policy Responses to the 2008 Crisis, World Bank Economic Review, forthcoming.
Karmakar S. (2013) Life after Bali: Renewing the World Trade Agenda, Bruegel Policy contribution 2013/17.
Laborde D. (2011), Sectoral Initiatives in the Doha Round, in Martin W. and A. Mattoo eds., Unfinished Business? The WTO’s Doha Agenda, CEPR and the World Bank: 277-299. Laborde, D., Martin W. (2015), Formulas for Failure, World Trade Review, this issue.
Minor P., Tsigas M. (2008), Impacts of Better Trade Facilitation in Developing Countries, Analysis with a New GTAP Database for the Value of Time in Trade, GTAP 11th Conference, Helsinki.
Wolfe R. (2015), First diagnose, then treat: what ails the Doha Round? World Trade Review, this issue.