HAL Id: hal-03121578
https://hal.archives-ouvertes.fr/hal-03121578
Submitted on 26 Jan 2021
HAL is a multi-disciplinary open access archive for the deposit and dissemination of sci-entific research documents, whether they are pub-lished or not. The documents may come from teaching and research institutions in France or abroad, or from public or private research centers.
L’archive ouverte pluridisciplinaire HAL, est destinée au dépôt et à la diffusion de documents scientifiques de niveau recherche, publiés ou non, émanant des établissements d’enseignement et de recherche français ou étrangers, des laboratoires publics ou privés.
study on Polar Bears (Ursus maritimus)
Sarah Cubaynes, Jon Aars, Nigel Yoccoz, Roger Pradel, Oystein Wiig, Rolf A.
Ims, Olivier Gimenez
To cite this version:
Sarah Cubaynes, Jon Aars, Nigel Yoccoz, Roger Pradel, Oystein Wiig, et al.. Modeling the demogra-phy of species providing extended parental care: A capture-recapture approach with a case study on Polar Bears (Ursus maritimus). Ecology and Evolution, Wiley Open Access, 2021, �10.1002/ece3.7296�. �hal-03121578�
For Review Only
Modeling the demography of species providing extended parental care:
A capture-recapture approach with a case study on Polar Bears (Ursus maritimus)
Journal: Ecology and Evolution Manuscript ID ECE-2020-11-01798.R1 Wiley - Manuscript type: Original Research
Date Submitted by the
Author: n/a
Complete List of Authors: CUBAYNES, SARAH; CEFE-CNRS
Aars, Jon; Norwegian Polar Institute, FRAM Centre
Yoccoz, Nigel; UiT Arctic University of Norway, Arctic and Marine Biology Pradel, Roger; CEFE-CNRS
Wiig, Oystein; Natural History Museum, University of Oslo, Norway Ims, Rolf; University of Tromso, Institute of Biology
Gimenez, Olivier; CNRS, CEFE Category: Population Ecology
Habitat: Marine, Theoretical Organism: Vertebrate
Approach: Statistical
Abstract:
In species providing extended parental care, one or both parents care for altricial young over a period including more than one breeding season. We expect large parental investment and long-term dependency within family units to cause high variability in life trajectories among individuals with complex consequences at the population level. So far, models for estimating demographic parameters in free-ranging animal populations mostly ignore extended parental care, thereby limiting our
understanding of its consequences on parents and offspring life histories. We designed a capture-recapture multi-event model for studying the demography of species providing extended parental care. It handles statistical multiple-year dependency among individual demographic parameters grouped within family units, variable litter size, and uncertainty on the timing at offspring independence. It allows for the evaluation of trade-offs among demographic parameters, the influence of past reproductive history on the caring parent’s survival status, breeding probability and litter size probability, while accounting for imperfect detection of family units. We assess the model performance using simulated data, and illustrate its use with a long-term dataset collected on the Svalbard polar bears (Ursus maritimus).
Our model performed well, both when offspring departure probability from the family unit occurred at a constant rate or varied during the field season depending on the date of capture. For the polar bear case study,
For Review Only
we provide estimates of adult and dependent offspring survival rates, breeding probability and litter size probability. Results showed that the outcome of the previous reproduction influenced breeding probability. Overall, our results show the importance of accounting for i) the multiple-year statistical dependency within family units, ii) uncertainty on the timing at offspring independence, and iii) past reproductive history of the caring parent. If ignored, estimates obtained for breeding probability, litter size, and survival can be biased.
3 4 5 6 7 8 9 10 11 12 13 14 15 16 17 18 19 20 21 22 23 24 25 26 27 28 29 30 31 32 33 34 35 36 37 38 39 40 41 42 43 44 45 46 47 48 49 50 51 52 53 54 55 56
For Review Only
1 Modeling the demography of species providing extended parental care:
2 A capture-recapture multievent model with a case study on Polar Bears (Ursus
3 maritimus)
4
5 Sarah Cubaynes1, Jon Aars2, Nigel G. Yoccoz3, Roger Pradel1, Øystein Wiig4, Rolf A Ims3
6 and Olivier Gimenez1
7 1 CEFE, Univ Montpellier, CNRS, EPHE-PSL University, IRD, Univ Paul Valéry
8 Montpellier 3, Montpellier, France
9 2 Norwegian Polar Institute, FRAM Centre, Tromsø, Norway
10 3 UiT The Arctic University of Norway, Department of Arctic and Marine Biology, Tromsø,
11 Norway
12 4Natural History Museum, University of Oslo, Norway
13
14 Abstract
15 1. In species providing extended parental care, one or both parents care for altricial young over 16 a period including more than one breeding season. We expect large parental investment and 17 long-term dependency within family units to cause high variability in life trajectories among 18 individuals with complex consequences at the population level. So far, models for estimating 19 demographic parameters in free-ranging animal populations mostly ignore extended parental 20 care, thereby limiting our understanding of its consequences on parents and offspring life 21 histories.
22 2. We designed a capture-recapture multi-event model for studying the demography of species 23 providing extended parental care. It handles statistical multiple-year dependency among 24 individual demographic parameters grouped within family units, variable litter size, and 25 uncertainty on the timing at offspring independence. It allows for the evaluation of trade-offs 3 4 5 6 7 8 9 10 11 12 13 14 15 16 17 18 19 20 21 22 23 24 25 26 27 28 29 30 31 32 33 34 35 36 37 38 39 40 41 42 43 44 45 46 47 48 49 50 51 52 53 54 55 56 57 58 59 60
For Review Only
26 among demographic parameters, the influence of past reproductive history on the caring 27 parent’s survival status, breeding probability and litter size probability, while accounting for 28 imperfect detection of family units. We assess the model performance using simulated data, 29 and illustrate its use with a long-term dataset collected on the Svalbard polar bears (Ursus 30 maritimus).
31 3. Our model performed well in terms of bias and mean square error and in estimating 32 demographic parameters in all simulated scenarios, both when offspring departure probability 33 from the family unit occurred at a constant rate or varied during the field season depending on 34 the date of capture. For the polar bear case study, we provide estimates of adult and dependent 35 offspring survival rates, breeding probability and litter size probability. Results showed that the 36 outcome of the previous reproduction influenced breeding probability.
37 4. Overall, our results show the importance of accounting for i) the multiple-year statistical 38 dependency within family units, ii) uncertainty on the timing at offspring independence, and 39 iii) past reproductive history of the caring parent. If ignored, estimates obtained for breeding 40 probability, litter size, and survival can be biased. This is of interest in terms of conservation 41 because species providing extended parental care are often long-living mammals vulnerable or 42 threatened with extinction.
43
44 Key-words: apex predator, arctic ecosystem, Bayesian modeling, capture-recapture,
45 dependency among individuals, family structure, parental care, state uncertainty, timing at 46 independence.
47
48 INTRODUCTION
49 Parental care includes any pre-natal and post-natal allocation, such as feeding and protecting 50 the young, which benefits the offspring development and survival chances, thereby enhancing 3 4 5 6 7 8 9 10 11 12 13 14 15 16 17 18 19 20 21 22 23 24 25 26 27 28 29 30 31 32 33 34 35 36 37 38 39 40 41 42 43 44 45 46 47 48 49 50 51 52 53 54 55 56 57 58 59 60
For Review Only
51 the parent’s reproductive success (Trivers 1972). Altricial mammals having offspring that need 52 to learn complex skills to ensure survival beyond independence, such as hunting, orientation, 53 or nest building, show extended parental care (hereafter EPC; Clutton-Brock 1991). It is defined 54 as a prolonged period, i.e. lasting more than one breeding season, over which one or both 55 parents care for one or several dependent young. This period typically lasts for several years 56 and can extend until lifelong maternal care in primates (Van Noordwijk 2012). For the 57 offspring, the quality and quantity of care received can have long-lasting effects on future 58 survival (e.g. Pavard and Branger 2012), social status (e.g. Shenk and Scelza 2012) and 59 reproduction (Royle et al. 2012). For the parent, investment in one offspring can compromise 60 its own condition or survival and/or its ability to invest in other offspring (siblings or future 61 offspring) (Williams 1966, Stearns 1992). It can indeed take several years during which a parent 62 caring for its offspring will not be available to reproduce, sometimes not until the offspring 63 have reached independence, e.g. on average 2.5 years for female polar bears (Ramsay and 64 Stirling 1988), 3.5 to 6 years for female African elephants (Lee and Moss 1986), and 9.3 years 65 for female Sumatran orangutans (Wich et al. 2004). The fitness costs of losing one offspring, 66 in terms of lost investment and skipped breeding opportunities, are particularly high if death 67 occurs near independence. We therefore expect EPC, through large parental investment and 68 multiple-year dependency among individuals within family units, to cause high variability in 69 life trajectories among individuals and family groups, in interbirth intervals depending on 70 offspring’s fate, and consequently on lifetime reproductive success for the caring parent 71 (Clutton-Brock 1991).
72 Capture-recapture (CR) models allow studying species with complex demography in 73 the wild, e.g. by considering ‘breeder’ and ‘non-breeder’ reproductive states to estimate 74 breeding probabilities and status-specific demographic parameters while accounting for 75 imperfect detectability (e.g., Lebreton et al. 2009). One can distinguish between successful and 3 4 5 6 7 8 9 10 11 12 13 14 15 16 17 18 19 20 21 22 23 24 25 26 27 28 29 30 31 32 33 34 35 36 37 38 39 40 41 42 43 44 45 46 47 48 49 50 51 52 53 54 55 56 57 58 59 60
For Review Only
76 failed breeding events (e.g., Lagrange et al. 2017) and include varying litter or clutch size (e.g., 77 Doligez et al. 2002) and memory effects (Cole et al. 2014), to investigate the costs of 78 reproduction on survival and future reproduction for species providing short-term parental care, 79 i.e. when offspring reach independence before the next breeding season (e.g., Yoccoz et al. 80 2002). Indeed, most CR models rely on the assumption of independence among individual CR 81 histories (Lebreton et al. 2009).
82 In the case of species providing EPC, one challenge stems from the multiple-year 83 dependency among individual’s life histories within parent-offspring units. Only few attempts 84 have been made to tackle this issue when estimating demographic parameters, despite the fact 85 that species providing EPC are often among long-living mammals vulnerable or threatened with 86 extinction (e.g. polar bears, orangutans, elephants). Lunn et al. (2016) proposed to model CR 87 histories of mother-offspring units (instead of individuals) to consider the multiple-year 88 dependency of female breeding probability upon offspring survival status for polar bears in 89 Hudson Bay. However, in this model, offspring survival after 9 months is assumed independent 90 of mother survival. Lunn et al. (2016)’s model does therefore not handle multiple-year 91 dependency of offspring survival upon mother survival status, typical of species providing EPC. 92 In addition, because litter size is modeled separately, Lunn et al. (2016)’s model (also used in 93 Regehr et al. (2018)) does not permit to explore potential trade-offs among offspring traits and 94 parental phenotypic or demographic traits.
95 Another challenge involves dealing with uncertain timing at offspring independence, 96 when the offspring departs the caring parent(s) and becomes independent. When studying free-97 ranging populations, this key life history event is rarely directly observed. When a mature 98 individual is observed without dependent offspring, it is often impossible to know if its 99 offspring have died or already departed its natal group. As a result, estimates of demographic 100 rates and trade-offs can be underestimated. Based on the analysis of mother-offspring units CR 3 4 5 6 7 8 9 10 11 12 13 14 15 16 17 18 19 20 21 22 23 24 25 26 27 28 29 30 31 32 33 34 35 36 37 38 39 40 41 42 43 44 45 46 47 48 49 50 51 52 53 54 55 56 57 58 59 60
For Review Only
101 histories, Couet et al. (2019) provided estimates of dolphin reproductive parameters corrected 102 for state uncertainty, but their model assumed a fixed age and timing at offspring independence. 103 Lunn et al. (2016)’s model included variable age at independence, but variability in the timing 104 at offspring independence was not fully dealt with. Demographic rates were corrected by the 105 average annual probability that independence occurred prior to sampling for all offspring, and 106 offspring survival was assumed independent of litter size (Regehr et al. 2018). In most species, 107 timing at offspring independence is variable and could depend on the offspring phenotypic traits 108 (e.g. body size in brown bears, Dahle and Swenson 2003), on parental traits (e.g. parent-109 offspring conflict in kestrels, Vergara et al. 2010), social and mating system (e.g. helping 110 behavior in humans, Kramer 2005), or other environmental determinants (e.g. food supply, 111 Eldegard and Sonerud 2010). To our knowledge, no model is available to tackle both the issues 112 of multiple-year dependency among individuals and variable timing at offspring independence. 113 Because of these methodological challenges, the population-level consequences of EPC remain 114 to be understood, especially in free-ranging animal populations.
115 Here, we develop a CR model specifically for species providing EPC. It is designed to 116 handle multiple-years statistical dependency (until offspring independence) among individual 117 demographic parameters by modeling CR histories grouped within family units. The model 118 accounts for uncertain timing at offspring independence. In addition, our model allows for 119 variability in the number of offspring born and recruited at each breeding event, variable 120 offspring survival depending on number of siblings, and includes the influence of past 121 reproductive history on the caring parent’s current status. Finally, estimates of survival rates, 122 breeding probability and litter size probability are corrected for imperfect detection possibly 123 depending upon family unit composition.
124 In what follows, we present the model, assess its performance using simulated data, and 125 illustrate its use with a long-term dataset collected on the Svalbard polar bears. Female polar 3 4 5 6 7 8 9 10 11 12 13 14 15 16 17 18 19 20 21 22 23 24 25 26 27 28 29 30 31 32 33 34 35 36 37 38 39 40 41 42 43 44 45 46 47 48 49 50 51 52 53 54 55 56 57 58 59 60
For Review Only
126 bears rely solely on stored fat reserves during pregnancy and the first three months of lactation, 127 before feeding and protecting litters of one to three young, usually during two more years 128 (Ramsay and Stirling 1988). They can lose more than 40% of body mass while fasting 129 (Atkinson and Ramsay 1995). In many areas, climate change and related sea ice decline impact 130 female bear condition and capacity to provide care for their young, with an associated decline 131 in reproductive output (Derocher et al. 2004; Stirling and Derocher, 2012, Laidre et al. 2020). 132 More insights into the species demography, such as the consequences of long-duration parental 133 care on mother and offspring life histories, could help our understanding of polar bear 134 population responses to environmental perturbations and extinction risks in future decades 135 (Hunter et al., 2010; Regehr et al., 2016).
136
137 METHODS
138
139 1. Capture-recapture model for species providing EPC
140 1.1 Principle
141 We develop a CR model in the multievent framework (Pradel 2005) that is also known as a 142 hidden Markov modeling framework (Gimenez et al. 2012). The principle is to relate the field 143 observations, called events, to the underlying demographic states of interest through the 144 observation process. Uncertainty on state assignment due to variable timing at offspring 145 independence is included in the observation process. In parallel, the state process describes the 146 transition rates between states from one year to the next. The transition rates correspond here 147 to the demographic parameters corrected for imperfect detection and state uncertainty. Below 148 we describe the general procedure to specify the model by defining the states and state-to-state 149 transition process, then the events and observation process. However, for simplicity, the events 150 and states are chosen to match the polar bear life cycle (i.e. females are captured in spring, alone 3 4 5 6 7 8 9 10 11 12 13 14 15 16 17 18 19 20 21 22 23 24 25 26 27 28 29 30 31 32 33 34 35 36 37 38 39 40 41 42 43 44 45 46 47 48 49 50 51 52 53 54 55 56 57 58 59 60
For Review Only
151 or together with a litter of one or two dependent offspring; offspring gain independence in the 152 year following their second birthday, and offspring cannot survive the loss of their mother 153 before gaining independence). The resulting model assumptions and its applicability to other 154 species are discussed below.
155
156 1.2 Specification of states and state process
157 One specificity of our model lies in the use of CR histories based on family groups instead of 158 individuals, which permits to include the multiple-year dependency among the caring parent 159 and dependent offspring’s demographic rates and life history traits. Below, we describe the 160 specification of 24 unique states and 6 matrices needed to construct the model.
161 States correspond to the ‘real’ demographic states of the individuals composing the 162 family. We consider 12 states S, S={J2,J3,SA4,SA5,A01,A02,A11,A12,AS1,AS2,A,D}, to 163 represent the polar bear life cycle (defined in Table 1). In addition, we specify 13 intermediary 164 states S’, S’={J3, SA4, SA5, A11, A12,AS1,AS2,A0-,A1-,I/AS1,I/AS2,A,D }, and 16 165 intermediary states S’’, S’’={J3,SA4,SA5,A11,A12,AS1,AS2,B/A0-,NB/A0-,B/A1-,NB/A1-166 ,B/AS,NB/AS,B/A,NB/A,D}, leading to a total of 24 unique states (defined in Table 1). The 167 specification of intermediary states is what permits to distinguish between failed and successful 168 breeders in the transition matrix to consider the influence of past reproductive history on 169 parameters (see below).
170
171 Table 1. Definition of the states and events used in the model to describe the polar bear life 172 cycle.
TYPE CODE DEFINITION
J2 2 y.o. independent juvenile female STATES
J3 3 y.o. independent juvenile female 3 4 5 6 7 8 9 10 11 12 13 14 15 16 17 18 19 20 21 22 23 24 25 26 27 28 29 30 31 32 33 34 35 36 37 38 39 40 41 42 43 44 45 46 47 48 49 50 51 52 53 54 55 56 57 58 59 60
For Review Only
SA4 4 y.o. independent subadult femaleSA5 5 y.o. independent subadult female
A01 mother with one dependent cub of the year A02 mother with two dependent cubs of the year A11 mother with one dependent yearling
A12 mother with two dependent yearlings
AS1 successful female breeder with one two-year old offspring reaching independence AS2 successful female breeder with two two-year old offspring reaching independence
A adult female without dependent offspring D dead state
A0- failed breeder, death of all offspring cubs of the year A1- failed breeder, death of all offspring yearlings
I/AS1 successful female breeder alone after departure of one independent offspring I/AS2 successful female breeder alone after departure of two independent offspring B/A0- breeder following loss of a cub of the year litter
NB/A0- non breeder following loss of a cub of the year litter B/A1- breeder following loss of a yearling litter
NB/A1- non breeder following loss of a yearling litter B/AS breeder following successful reproduction NB/AS non breeder following successful reproduction
B/A breeder given that previously without dependent offspring NB/A non breeder given that previously without dependent offspring
‘1' capture of a 2yo independent female juvenile ‘2' capture of a 3yo independent female juvenile EVENTS
‘3' capture of a 4yo independent subadult female 3 4 5 6 7 8 9 10 11 12 13 14 15 16 17 18 19 20 21 22 23 24 25 26 27 28 29 30 31 32 33 34 35 36 37 38 39 40 41 42 43 44 45 46 47 48 49 50 51 52 53 54 55 56 57 58 59 60
For Review Only
173174 The model is conditioned upon first capture. The initial state vector, , gathers the s0
175 proportions of family units in each state S at first capture, 𝑠0= (π1, …, π11,0)′ (with π12= 0
176 for state D, because an individual must be alive at first capture).
177 The transition matrix, , describing all possible state-to-state transitions from spring Ψ 178 one year (t) to spring the next year (t+1), is obtained as the matrix product of four matrices 179 Ψ = Φ ∙ Ψ1∙ Ψ2∙ Ψ3. This decomposition is another particularity of our model which permits 180 to estimate the relevant set of demographic parameters: independent juvenile, subadult and 181 adult survival (matrix ), dependent offspring survival (matrix Φ Ψ1), breeding probabilities 182 (matrix Ψ2) and litter size probabilities (matrix Ψ3), and potential trade-offs among them. This 183 formulation of the transition matrix implies that litter size is conditioned upon breeding 184 decision, itself conditioned upon offspring survival, itself conditioned upon survival of the 185 caring parent to deal with the statistical dependency existing among individuals within family 186 units.
187 The matrix (eq. 1) describes transitions from each state S at time t (rows) to each state Φ 188 S after the occurrence of the survival process for independent individuals (columns):
‘4' capture of a 5yo independent subadult female
‘5' capture of a mother with one dependent cub of the year ‘6' capture of a mother with two dependent cub of the year ‘7' capture of a mother with one dependent yearling ‘8' capture of a mother with two dependent yearlings
‘9' capture of a mother with one dependent two-year old offspring ‘10' capture of a mother with two dependent two-year old offspring ‘11' capture of an adult female without dependent offspring
‘0' non observation 3 4 5 6 7 8 9 10 11 12 13 14 15 16 17 18 19 20 21 22 23 24 25 26 27 28 29 30 31 32 33 34 35 36 37 38 39 40 41 42 43 44 45 46 47 48 49 50 51 52 53 54 55 56 57 58 59 60
For Review Only
189J2 J3 SA4 SA5 A01 A02 A11 A12 AS1 AS2 A D
J2 𝜑1 0 0 0 0 0 0 0 0 0 0 1 - 𝜑1 J3 0 𝜑2 0 0 0 0 0 0 0 0 0 1 - 𝜑2 SA4 0 0 𝜑3 0 0 0 0 0 0 0 0 1 - 𝜑3 SA5 0 0 0 𝜑4 0 0 0 0 0 0 0 1 - 𝜑4 A01 0 0 0 0 𝜑5 0 0 0 0 0 0 1 - 𝜑 A02 0 0 0 0 0 𝜑6 0 0 0 0 0 1 - 𝜑6 (eq. 1) A11 0 0 0 0 0 0 𝜑7 0 0 0 0 1 - 𝜑7 A12 0 0 0 0 0 0 0 𝜑8 0 0 0 1 - 𝜑8 AS1 0 0 0 0 0 0 0 0 𝜑9 0 0 1 - 𝜑9 AS2 0 0 0 0 0 0 0 0 0 𝜑10 0 1 - 𝜑10 A 0 0 0 0 0 0 0 0 0 0 𝜑11 1 - 𝜑11 D 0 0 0 0 0 0 0 0 0 0 0 1 190
191 In the matrix, Φ 𝜑1, …, 𝜑11 correspond to survival of immature independent (juveniles and 192 subadults) and adult female bears.
193
194 The Ψ1 matrix (eq.2) describes transitions from states S after the occurrence of the survival 195 process for independent individuals (rows) to states S’ after the occurrence of the offspring 196 survival process (columns):
197
J3 SA4 SA5 A11 A12 AS1 AS2 A0- A1- I/AS1 I/AS2 A D
J2 1 0 0 0 0 0 0 0 0 0 0 0 0 J3 0 1 0 0 0 0 0 0 0 0 0 0 0 SA4 0 0 1- 𝜅 0 0 0 0 0 0 0 0 𝜅 0 SA5 0 0 0 0 0 0 0 0 0 0 0 1 0 A01 0 0 0 𝑠1 0 0 0 1 ― 𝑠1 0 0 0 0 0 (eq.2) A02 0 0 0 2 ∙ 𝑠2∙ (1 ― 𝑠2) 𝑠22 0 0 1 ― 𝑠22― 2 ∙ 𝑠2∙ (1 ― 𝑠2) 0 0 0 0 0 A11 0 0 0 0 0 𝑠3 0 0 1 ― 𝑠3 0 0 0 0 A12 0 0 0 0 0 2 ∙ 𝑠4∙ (1 ― 𝑠4) 𝑠42 0 1 ― 𝑠42― 2 ∙ 𝑠4∙ (1 ― 𝑠4) 0 0 0 0 AS1 0 0 0 0 0 0 0 0 0 1 0 0 0 AS2 0 0 0 0 0 0 0 0 0 0 1 0 0 A 0 0 0 0 0 0 0 0 0 0 0 1 0 D 0 0 0 0 0 0 0 0 0 0 0 0 1 198
199 In the Ψ1 matrix, is the probability of first reproduction at age 5, is dependent offspring 𝜅 𝑠 200 survival conditioned upon mother survival ( for singleton cub, for singleton yearling; 𝑠1 𝑠2 𝑠3
201 for twin litter’s individual cub, and for twin litter’s individual yearling). Litter survival rates 𝑠4
202 can be obtained from individual offspring survival rates (for singleton litters 𝑙01= 𝑠1and 𝑙11=
3 4 5 6 7 8 9 10 11 12 13 14 15 16 17 18 19 20 21 22 23 24 25 26 27 28 29 30 31 32 33 34 35 36 37 38 39 40 41 42 43 44 45 46 47 48 49 50 51 52 53 54 55 56 57 58 59 60
For Review Only
203 𝑠3 for cub and yearling respectively, and for twin litters 𝑙02= 1 ―
(
1 ― 𝑠22― 2 ∙ 𝑠2∙(1 ― 𝑠2))
204 and 𝑙12= 1 ― (1 ― 𝑠42― 2 ∙ 𝑠4∙(1 ― 𝑠4)) for cubs and yearlings respectively). 205
206
207 The Ψ2 matrix (eq.3) describes transitions from states S’ after occurrence of the survival 208 processes (rows) to states S’’ depending on breeding decision (columns):
209
J3 SA4 SA5 A11 A12 AS1 AS2 B/A0- NB/A0- B/A1- NB/A1- B/AS1 B/AS2 B/A NB/A D
J3 1 0 0 0 0 0 0 0 0 0 0 0 0 0 0 0 SA4 0 1 0 0 0 0 0 0 0 0 0 0 0 0 0 0 SA5 0 0 1 0 0 0 0 0 0 0 0 0 0 0 0 0 A11 0 0 0 1 0 0 0 0 0 0 0 0 0 0 0 0 A12 0 0 0 0 1 0 0 0 0 0 0 0 0 0 0 0 A21 0 0 0 0 0 1 0 0 0 0 0 0 0 0 0 0 A22 0 0 0 0 0 0 1 0 0 0 0 0 0 0 0 0 (eq.3) A0- 0 0 0 0 0 0 0 𝛽1 1 ― 𝛽1 0 0 0 0 0 0 0 A1- 0 0 0 0 0 0 0 0 0 𝛽2 1 ― 𝛽2 0 0 0 0 0 I/AS1 0 0 0 0 0 0 0 0 0 0 0 𝛽3 1 ― 𝛽3 0 0 0 I/AS2 0 0 0 0 0 0 0 0 0 0 0 𝛽3 1 ― 𝛽3 0 0 0 A 0 0 0 0 0 0 0 0 0 0 0 0 0 𝛽4 1 ― 𝛽4 0 D 0 0 0 0 0 0 0 0 0 0 0 0 0 0 0 1 210
211 Parameter is breeding probability conditioned upon mother and offspring’s survival status 𝛽 212 (𝛽1 following loss of a cub litter, loss of a yearling litter, for successful breeder, for 𝛽2 𝛽3 𝛽4
213 female without dependent offspring at the beginning of the year). 214
215 The Ψ3 matrix (eq. 4) describes transitions from states S’’ after occurrence of the 216 survival processes and breeding decision (rows) to states S at t+1 after determination of litter 217 size for breeders (columns):
218
J2 J3 SA4 SA5 A01 A02 A11 A12 AS1 AS2 A D
J3 0 1 0 0 0 0 0 0 0 0 0 0 SA4 0 0 1 0 0 0 0 0 0 0 0 0 SA5 0 0 0 1 0 0 0 0 0 0 0 0 A11 0 0 0 0 0 0 1 0 0 0 0 0 A12 0 0 0 0 0 0 0 1 0 0 0 0 AS1 0 0 0 0 0 0 0 0 1 0 0 0 AS2 0 0 0 0 0 0 0 0 0 1 0 0 (eq.4) 3 4 5 6 7 8 9 10 11 12 13 14 15 16 17 18 19 20 21 22 23 24 25 26 27 28 29 30 31 32 33 34 35 36 37 38 39 40 41 42 43 44 45 46 47 48 49 50 51 52 53 54 55 56 57 58 59 60
For Review Only
B/A0- 0 0 0 0 𝛾1 1 ― 𝛾1 0 0 0 0 0 0 NB/A0- 0 0 0 0 0 0 0 0 0 0 1 0 B/A1- 0 0 0 0 𝛾2 1 ― 𝛾2 0 0 0 0 0 0 NB/A1- 0 0 0 0 0 0 0 0 0 0 1 0 B/AS1 0 0 0 0 𝛾3 1 ― 𝛾3 0 0 0 0 0 0 B/AS2 0 0 0 0 𝛾3 1 ― 𝛾3 0 0 0 0 1 0 B/A 0 0 0 0 𝛾4 1 ― 𝛾4 0 0 0 0 0 0 NB/A 0 0 0 0 0 0 0 0 0 0 1 0 D 0 0 0 0 0 0 0 0 0 0 0 1 219220 Parameter is the probability of producing a singleton litter conditioned upon mother’s and 𝛾 221 offspring’s survival status and upon breeding decision ( following the loss a cub litter, loss 𝛾1 𝛾2
222 of a yearling litter, 𝛾3for successful breeder, for female without dependent offspring at the 𝛾4
223 beginning of the year). 224
225 By modifying the constraints on parameters (i.e. setting them equal or different among 226 states), the model can be used to investigate: i) the cost of reproduction on parent’s survival (by 227 comparing the s in matrix ), ii) the influence of litter size on individual offspring survival φ Φ 228 (by comparing to , and to in matrix 𝑠1 𝑠2 𝑠3 𝑠4 Ψ1) and on litter survival (by comparing l01 to l02
229 and l11 to l12), iv) the influence of past reproductive history on breeding probability (by
230 comparing the s in matrix 𝛽 Ψ2), and on litter size probability (by comparing the s in matrix 𝛾 Ψ3
231 ). 232
233 1.3 Specification of events and observation process
234 The events correspond to the observation or non-observation of family units in the field at each 235 sampling occasion. Each event is coded depending on the number and age of the individuals 236 composing the family. Here, we consider 12 possible events, Ω = {1,2,3,4,5,6,7,8,9,10,11,12} 237 to describe field observations for polar bears family groups (defined in Table 1).
238 In a multievent model, one specific event may relate to several possible states. Due to 239 variable timing at offspring independence, a female successful breeder (state ‘AS1’ or ‘AS2’) 3 4 5 6 7 8 9 10 11 12 13 14 15 16 17 18 19 20 21 22 23 24 25 26 27 28 29 30 31 32 33 34 35 36 37 38 39 40 41 42 43 44 45 46 47 48 49 50 51 52 53 54 55 56 57 58 59 60
For Review Only
240 can be captured together with 1 or 2 two-year old dependent offspring (event ‘9’ or ‘10’) or 241 without (event ‘11’) its two-year old offspring or not captured (event ‘12’) depending on i) 242 whether the offspring has already departed from its mother at the time of capture and ii) on 243 capture probability. To include uncertainty on state assignment due to variable timing at 244 offspring independence, we decompose the observation process into two event matrices, and 𝐸1
245 𝐸2, modeling respectively departure probability ( ) and capture probability (p). 𝛼
246 The 𝐸1 matrix (eq. 5), relates the states S to the possible observations at the time of 247 capture, O = {1,2,3,4,5,6,7,8,9,10,11,12} (same code as the events, see Table 1), through the 248 departure probability, denoted .𝛼
‘1' ‘2' ‘3' ‘4' ‘5' ‘6' ‘7' ‘8' ‘9' ‘10' ‘11' ‘12' J2 1 0 0 0 0 0 0 0 0 0 0 0 J3 0 1 0 0 0 0 0 0 0 0 0 0 SA4 0 0 1 0 0 0 0 0 0 0 0 0 (eq.5) SA5 0 0 0 1 0 0 0 0 0 0 0 0 A01 0 0 0 0 1 0 0 0 0 0 0 0 A02 0 0 0 0 0 1 0 0 0 0 0 0 A11 0 0 0 0 0 0 1 0 0 0 0 0 A12 0 0 0 0 0 0 0 1 0 0 0 0 AS1 0 0 0 0 0 0 0 0 1-𝛼𝑖,𝑑 0 𝛼𝑖,𝑑 0 AS2 0 0 0 0 0 0 0 0 2 ∙ 𝛼𝑖,𝑑∙ (1 ― 𝛼𝑖,𝑑) 1 ― 2 ∙ 𝛼𝑖,𝑑∙(1 ― 𝛼𝑖,𝑑)― 𝛼𝑖,𝑑2 𝛼𝑖,𝑑2 0 A 0 0 0 0 0 0 0 0 0 0 1 0 D 0 0 0 0 0 0 0 0 0 0 0 1 249
250 Here, 𝛼𝑖,𝑑 is the departure probability of a two-year old individual offspring belonging to family 251 unit i on its date of capture d. The relationship between date of capture and departure probability 252 is species-specific and either assessed from prior knowledge on the species’ biology or field 253 data (see Appendix 2). Here we assume that siblings’ timing at independence can, but does not 254 have to, occur independently (if both offspring can only depart the family on the same date, the 255 transition from state ‘AS2’ to event ‘9’ should be set to 0).
3 4 5 6 7 8 9 10 11 12 13 14 15 16 17 18 19 20 21 22 23 24 25 26 27 28 29 30 31 32 33 34 35 36 37 38 39 40 41 42 43 44 45 46 47 48 49 50 51 52 53 54 55 56 57 58 59 60
For Review Only
256 The second event matrix, 𝐸2, (eq. 6) relates all possible observations at the time of 257 capture O to the events, , actually observed in the field through the state-dependent capture Ω 258 probability, denoted ps. 1' 2' 3' 4' 5' 6' 7' 8' 9' 10' 11' 12' 1' 𝑝1 0 0 0 0 0 0 0 0 0 0 1 ― 𝑝1 2' 0 𝑝2 0 0 0 0 0 0 0 0 0 1 ― 𝑝2 3' 0 0 𝑝3 0 0 0 0 0 0 0 0 1 ― 𝑝3 4' 0 0 0 𝑝4 0 0 0 0 0 0 0 1 ― 𝑝4 5' 0 0 0 0 𝑝5 0 0 0 0 0 0 1 ― 𝑝5 (eq.6) 6' 0 0 0 0 0 𝑝6 0 0 0 0 0 1 ― 𝑝6 7' 0 0 0 0 0 0 𝑝7 0 0 0 0 1 ― 𝑝7 8' 0 0 0 0 0 0 0 𝑝8 0 0 0 1 ― 𝑝8 9' 0 0 0 0 0 0 0 0 𝑝9 0 0 1 ― 𝑝9 10' 0 0 0 0 0 0 0 0 0 𝑝10 0 1 ― 𝑝10 11' 0 0 0 0 0 0 0 0 0 0 𝑝11 1 ― 𝑝11 12' 0 0 0 0 0 0 0 0 0 0 0 1 259 260
261 The composite event matrix, E, which relates the events to the states, is obtained as the 262 matrix product of these two matrices 𝐸 = 𝐸1∙ 𝐸2. Because the model is conditioned upon first 263 capture, the initial event vector, , takes the value of 1 for all events (except of 0 for the event 𝑒0
264 ‘12’ corresponding to a non-observation). 265
266 1.4 Applicability to other species
267 The model described above matches the Svalbard polar bear life cycle. The model therefore 268 assumes that care is provided by the mother only, to one or two offspring (we modelled triplets 269 as twins because there were just 8 litters of triplets in the data), for a duration of two years 270 maximum. Offspring under age 2 cannot survive if the mother dies. A mother caring for 271 offspring cannot mate and produce a second litter. Independent males (that have already 272 departed from the family unit) are not included in the model.
3 4 5 6 7 8 9 10 11 12 13 14 15 16 17 18 19 20 21 22 23 24 25 26 27 28 29 30 31 32 33 34 35 36 37 38 39 40 41 42 43 44 45 46 47 48 49 50 51 52 53 54 55 56 57 58 59 60
For Review Only
273 To apply the model to other species, one should modify the number of events and states 274 to match the species life cycle (depending on age at sexual maturity, number of care providers, 275 maximum litter size, duration of parental care) but the number of matrices should remain the 276 same. For example, modeling a hypothetical species similar to polar bears but in which both 277 males and females care for offspring would increase the number of unique states from 24 to 42 278 (8 states for immature females and males, 21 states for dependent offspring cared for by both 279 parents, just the mother in case of father loss, or just the father in case of mother loss). Such a 280 model could be used to assess the influence of father versus mother loss on litter size, offspring 281 survival and father and/or mother breeding probabilities. After defining the states and events, 282 one should modify the shape of the relationship between departure probability and date of 283 capture to match the species life cycle. In species like primates or wolves, departure from the 284 family unit can occur throughout the year, at a more or less constant rate depending on the 285 season, while it occurs only between February and May in polar bears due to environmental 286 constraints. In addition, the influence of individual traits such as age or body weight, or 287 environmental variables such as temperature, can be included in the model under the form of 288 individual or temporal covariates (Pollock 2002). Other specificities related to data collection 289 can be included in a similar way, such as trap effects (Pradel and Sanz-Aguilar 2012) or latent 290 individual heterogeneity by using mixture of distributions or random effects (Gimenez et al. 291 2018). uidance to fit the model in a Bayesian framework in program Jags for real and G 292 simulated data are provided in Appendices 1 and 2.
293
294 Simulation study
295 The simulation study was aimed at evaluating the performance of our model to estimate 296 demographic parameters under various assumptions about the timing at offspring independence 297 (constant versus seasonal departure rate) and various degrees of capture probability (low p= 3 4 5 6 7 8 9 10 11 12 13 14 15 16 17 18 19 20 21 22 23 24 25 26 27 28 29 30 31 32 33 34 35 36 37 38 39 40 41 42 43 44 45 46 47 48 49 50 51 52 53 54 55 56 57 58 59 60
For Review Only
298 0.25, high p=0.7), for a medium-size data set (T= 15 sampling occasions, with R=80 newly 299 marked at each occasion in equal proportion among the 11 alive states).
300 We simulated data for a virtual long-lived mammal species mimicking the polar bear 301 using the model described in box 1. We used 𝜑 = 0.9 for independent female bear survival 302 (aged 2+ y.o.), 𝑠1= 𝑙01= 0.6 for singleton cub survival, 𝑠2= 0.55 for twin litter’ s cub 303 survival (corresponding to twin litter survival 𝑙02= 0.7975 𝑠), 3= 0.8 for singleton yearling 304 survival and 𝑠4= 0.75 for twin litter’s yearling survival (corresponding to litter survival 𝑙12
305 = 0.94). Offspring survival rates were conditioned upon mother survival. If a mother dies, its 306 dependent offspring had no chances of surviving. For breeding probabilities, we used 𝛽1= 0.5 307 , 𝛽2= 0.7 𝛽, 3= 0.9 and 𝛽4= 0.8. For litter size probabilities, we used 𝛾1= 0.4 𝛾 , 2= 0.5 𝛾, 3
308 = 0.6 and 𝛾4= 0.7. We set 𝜅 = 0 and assumed that females had their first litter at age 6 or 309 older.
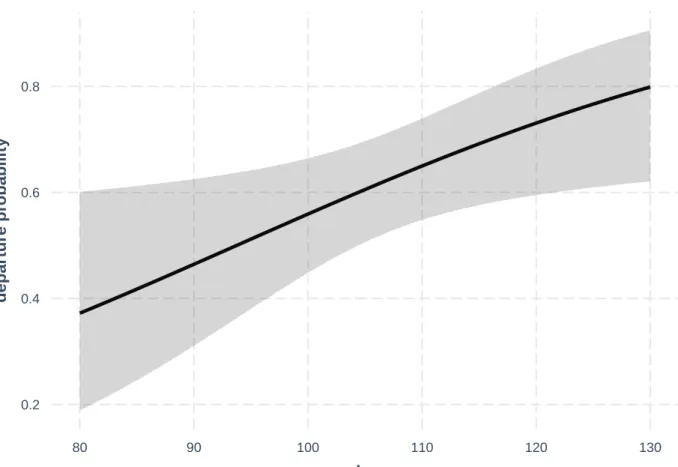
310 We assumed that captures occurred each year between mid-March to end of May (day 311 of the year d=80 to d=130). For each capture event, date of capture was randomly sampled from 312 the distribution of the polar bear data dates of capture (see Appendix 1). In the constant scenario, 313 we assumed that two-year old bears reached independence at a constant departure rate ( ) 𝛼 314 during the field season, independently of the date of capture. We chose an intermediate value 315 of = 0.5 (if independence occurred always after the field season, = 0, versus always before 𝛼 𝛼 316 the field season, = 1). In the seasonal scenario, we assumed that departure rate varied with 𝛼 317 date of capture (d) following a logistic relationship (regression coefficients were estimated from 318 the polar bear data, see Appendix 2). Most of the two-year old offspring were captured with 319 their mother at the beginning of the field season, while departure probability increased 320 logistically up to 80% at the end of the field season.
3 4 5 6 7 8 9 10 11 12 13 14 15 16 17 18 19 20 21 22 23 24 25 26 27 28 29 30 31 32 33 34 35 36 37 38 39 40 41 42 43 44 45 46 47 48 49 50 51 52 53 54 55 56 57 58 59 60
For Review Only
321 We simulated 100 CR datasets for each of the 4 scenarios (S1: low detection with constant 322 departure, S2: low detection with seasonal departure, S3: high detection with constant 323 departure, S4: high detection with seasonal departure). We simulated the data using program 324 R. We fitted the model using program jags called from R (Plummer 2016). For each
325 parameter and each dataset, we calculated absolute bias as 𝐵 = 𝜃 ―𝜃 , and root mean squared 326 error as 𝑅𝑀𝑆𝐸 = (𝜃 ― 𝜃)2, with the parameter used to simulate the data and the mean 𝜃 𝜃 327 value of the estimated parameter. Appendix 1 containing guidance, R code and files to 328 simulate data and fit the model is available on GitHub at
329 https://github.com/SCubaynes/Appendix1_extendedparentalcare.
330
331 Case study: Polar bears in Svalbard
332 In polar bears, care of offspring is provided by the mother only (Amstrup, 2003). Males 333 were therefore discarded from our analysis. Adult female polar bears mate in spring (February 334 to May, Amstrup 2003), and in Svalbard usually have their first litter at the age of six years, but 335 some females can have their first litter at five years (Derocher 2013). They have delayed 336 implantation where the egg attaches to the uterus in autumn (Ramsay and Stirling 1988). A 337 litter with small cubs (ca 600 grams) is born around November to January, in a snow den that 338 the mothers dig out in autumn, and where the family stay 4-5 months. The family usually 339 emerges from the den in March-April, and stay close to the den while the cubs get accustomed 340 to the new environment outside their home, for a few days up to 2-3 weeks (Hansson and 341 Thomassen 1983). Litter size in early spring vary from one to three, with two cubs being most 342 common, three cubs in most areas being rare, and commonly around one out of three litters 343 having one cub only (Amstrup 2003). In Svalbard, polar bears become independent from their 344 mother shortly after their second birthday (average age at independence is 2.3). Two-year old 345 bears typically depart from the mother in spring (between mid-March to end of May), when the 3 4 5 6 7 8 9 10 11 12 13 14 15 16 17 18 19 20 21 22 23 24 25 26 27 28 29 30 31 32 33 34 35 36 37 38 39 40 41 42 43 44 45 46 47 48 49 50 51 52 53 54 55 56 57 58 59 60
For Review Only
346 mother can mate again. There is only one anecdotal record of a yearling alive without his 347 mother. Because the field season can last for several weeks, some two-year-old bears were 348 captured together with their mother and others were already independent at the time of capture. 349 The minimum reproductive interval for successful Barents Sea polar bears is 3 years. On the 350 contrary, loss of a cub litter shortly after den emergence may mean the mother can produce new 351 cubs in winter the same year (Ramsay and Stirling 1988).
352 Bears captured in Svalbard are shown to be a mixture of resident and pelagic bears 353 (Mauritzen et al. 2002). To focus on the resident population, independent bears captured only 354 once were not included in our analysis. We therefore analyzed N = 158 encounter histories of 355 resident polar bear family units captured each spring after den emergence between doy 80 to 356 130 (mid-March to mid-May), from 1992 to 2019, in Svalbard. It corresponds to 81 capture 357 events of juvenile and subadults, 231 cubs, 96 yearling, 23 dependent two-year old, and 444 358 captures of adult females. Polar bears were caught and individually marked as part of a long-359 term monitoring program on the ecology of polar bears in the Barents Sea region (Derocher 360 2005). All bears one year or older were immobilized by remote injection of a dart (Palmer Cap-361 Chur Equipment, Douglasville, GA, USA) with the drug Zoletil® (Virbac, Carros, France) 362 (Stirling et al. 1989). The dart was fired from a small helicopter (Eurocopter 350 B2 or B3), 363 usually from a distance of about 4 to 10 meters. Cubs of the year were immobilized by injection 364 with a syringe. Cubs and yearlings were highly dependent on their mother; therefore, they 365 remained in her vicinity and were captured together with their mother. A female captured alone 366 was considered to have no dependent offspring alive. Death of the cubs could have occurred in 367 the den or shortly after den emergence but before capture. Hereafter, estimated cub survival 368 thus refers to survival after capture. Infant mortality occurring before capture will be assigned 369 to a reduced litter size. Because only 3% of females were observed with 3 offspring, we 370 analyzed jointly litters of twins with triplets.
3 4 5 6 7 8 9 10 11 12 13 14 15 16 17 18 19 20 21 22 23 24 25 26 27 28 29 30 31 32 33 34 35 36 37 38 39 40 41 42 43 44 45 46 47 48 49 50 51 52 53 54 55 56 57 58 59 60
For Review Only
371 We built the model described above with 12 states and 12 events to describe the life 372 cycle (Table 1). Preliminary analyses suggested that mother survival did not vary according to 373 state, we therefore constrained parameter to be equal among all states in matrix . To avoid φ Φ 374 identifiability issues due to a relatively small sample size, we assumed breeding probability 375 and litter size probability did not vary between successful breeders (states AS1 and AS2) and 376 female without dependent offspring (state A) by setting 𝛽3= 𝛽4 and 𝛾3= 𝛾4. . We also 377 assumed that litter size probability did not vary among failed breeders (loss of a cub versus a 378 yearling litter), by setting 𝛾1= 𝛾2 . We could not assess formally the fit of our model because 379 no test is yet available for multievent models. However, the multi-state version of our model 380 (without uncertainty on timing at independence) fitted the data adequately. Adding a level of 381 complexity should make the model even more adequate.
382 Using the conditional probabilities estimated in the model, we calculated the net 383 probability for a female to raise none, Pr(X=0), one, Pr(X=1), or two offspring, Pr(X=2) to 384 independence over a 3-year period (details are provided in Appendix 2).
3 4 5 6 7 8 9 10 11 12 13 14 15 16 17 18 19 20 21 22 23 24 25 26 27 28 29 30 31 32 33 34 35 36 37 38 39 40 41 42 43 44 45 46 47 48 49 50 51 52 53 54 55 56 57 58 59 60
For Review Only
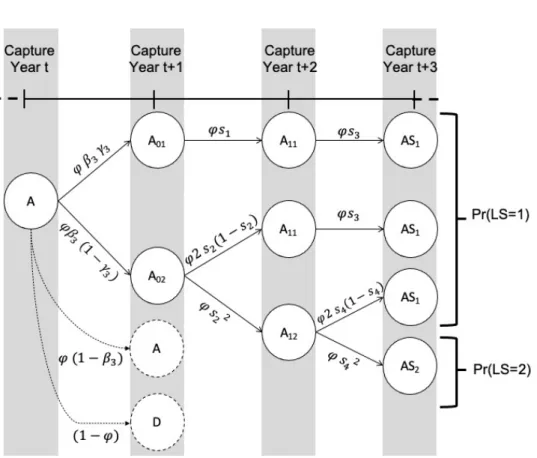
385386 Figure 1: Life history events with associated probabilities of raising one (X=1) or two (X=2) 387 offspring to independence over a 3 years period for a female polar bear alive and without 388 dependent offspring at the beginning of the period (state A). State A01 represents a female with 389 one dependent cub of the year, A02 with two dependent cubs of the year, A11 with one 390 dependent yearling, A12 with two dependent yearlings, AS1 a successful female breeder with 391 one two-year old offspring reaching independence and AS2 a successful female breeder with 392 two two-year old offspring reaching independence. Parameter is adult survival, is breeding 𝜑 𝛽3
393 probability of a female without dependent offspring, is the probability of a singleton litter, 𝛾3
394 𝑠1 is cub and is yearling survival in a singleton litter, is cub and yearling survival in a 𝑠2 𝑠3 𝑠4
395 twin litter. 396
397 We considered adult females without dependent offspring at the beginning of the time period, 398 so that we have: 399 Pr (X = 1) = 𝜑3∙ 𝛽3∙
[
𝛾3∙ 𝑠1∙ 𝑠3+(1 ― 𝛾3)∙ (2 𝑠2(1 ― 𝑠2) ∙ 𝑠3+ 𝑠22∙ 2 𝑠4(1 ― 𝑠4))] , 400 Pr (X = 2) = 𝜑3∙ 𝛽3∙(1 ― 𝛾3)∙ 𝑠22∙ 𝑠42 , 3 4 5 6 7 8 9 10 11 12 13 14 15 16 17 18 19 20 21 22 23 24 25 26 27 28 29 30 31 32 33 34 35 36 37 38 39 40 41 42 43 44 45 46 47 48 49 50 51 52 53 54 55 56 57 58 59 60For Review Only
401 Pr (X = 0) = 1 ― Pr (𝑋 = 1) ― Pr (𝑋 = 2) .402 Appendix 2 containing guidance, R code, data files to fit the model to the polar bear data, and 403 additional results is available on GitHub at
404 https://github.com/SCubaynes/Appendix2_extendedparentalcare.
405
406 RESULTS
407 Model performance evaluated on simulated datasets
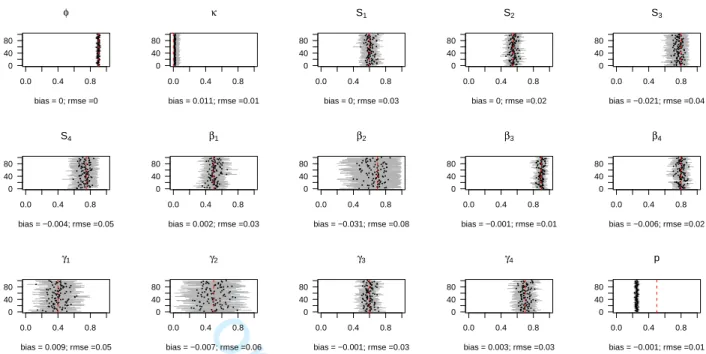
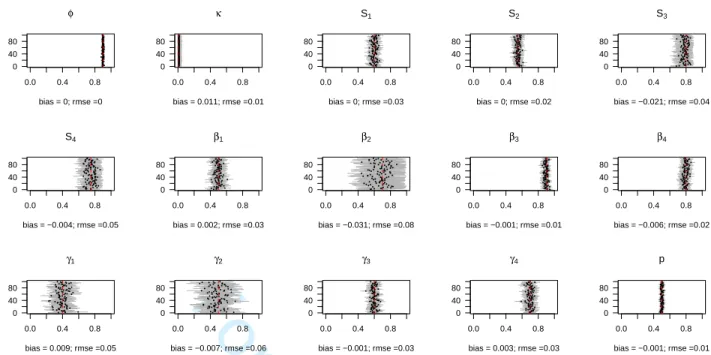
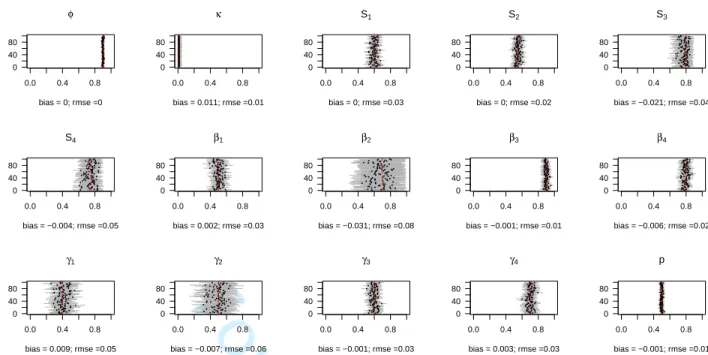
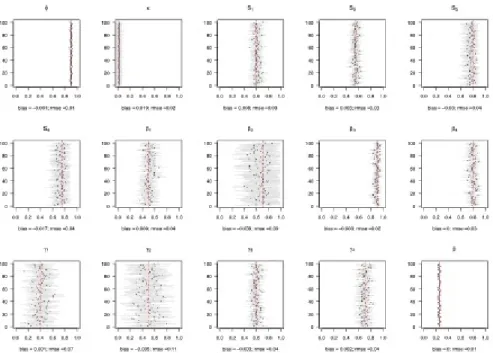
408 Model performance was satisfying and comparable in all 4 simulated scenarios (S1 with low 409 detection and constant departure, S2 with low detection and seasonal departure, S3 with high 410 detection and constant departure and S4 with high detection and seasonal departure), with low 411 average bias (𝐵𝑆1= - 0.000, 𝐵𝑆2= - 0.004, 𝐵𝑆3= - 0.004, 𝐵𝑆4= - 0.003) and root-mean-412 square error (𝑟𝑚𝑠𝑒𝑆1= 0.042, 𝑟𝑚𝑠𝑒𝑆2=0.041, 𝑟𝑚𝑠𝑒𝑆3=0.031 and 𝑟𝑚𝑠𝑒𝑆4=0.031) (see 413 Appendix 1 for details).
414 For most parameters, bias was very low, B < 0.02, except for parameters in scenarios β2
415 S2, S3 and S4 (-0.04 < B < -0.03) and in scenario S2 (B = -0.03), rmse < 0.05, except for 𝑠3
416 parameters 𝛽2 ,𝛾1 and (0.05 < rmse < 0.07). For these three parameters, precision was lower 𝛾2
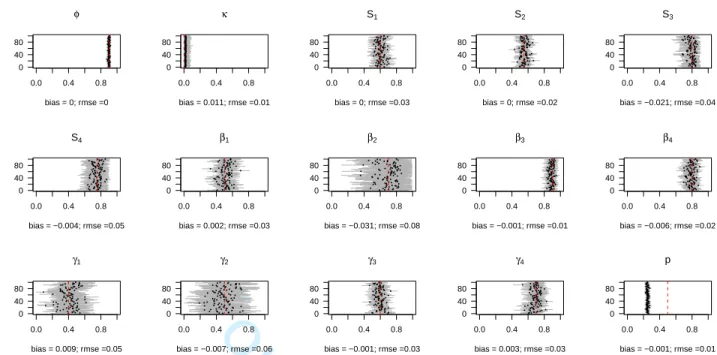
417 in the two scenarios with low detection (see Appendix 1). Estimates obtained for the scenario 418 mimicking the polar bear study case (S2: low detection and seasonal departure) are provided in 419 Figure 2. 3 4 5 6 7 8 9 10 11 12 13 14 15 16 17 18 19 20 21 22 23 24 25 26 27 28 29 30 31 32 33 34 35 36 37 38 39 40 41 42 43 44 45 46 47 48 49 50 51 52 53 54 55 56 57 58 59 60
For Review Only
420 0.0 0.2 0.4 0.6 0.8 1.0 0 20 40 60 80 100 bias = −0.001; rmse =0.01 0.0 0.2 0.4 0.6 0.8 1.0 0 20 40 60 80 100 bias = 0.019; rmse =0.02 0.0 0.2 0.4 0.6 0.8 1.0 0 20 40 60 80 100 S1 bias = 0.008; rmse =0.03 0.0 0.2 0.4 0.6 0.8 1.0 0 20 40 60 80 100 S2 bias = 0.003; rmse =0.03 0.0 0.2 0.4 0.6 0.8 1.0 0 20 40 60 80 100 S3 bias = −0.03; rmse =0.04 0.0 0.2 0.4 0.6 0.8 1.0 0 20 40 60 80 100 S4 bias = −0.017; rmse =0.04 0.0 0.2 0.4 0.6 0.8 1.0 0 20 40 60 80 100 1 bias = 0.009; rmse =0.04 0.0 0.2 0.4 0.6 0.8 1.0 0 20 40 60 80 100 2 bias = −0.039; rmse =0.09 0.0 0.2 0.4 0.6 0.8 1.0 0 20 40 60 80 100 3 bias = −0.003; rmse =0.02 0.0 0.2 0.4 0.6 0.8 1.0 0 20 40 60 80 100 4 bias = 0; rmse =0.03 0.0 0.2 0.4 0.6 0.8 1.0 0 20 40 60 80 100 1 bias = 0.001; rmse =0.07 0.0 0.2 0.4 0.6 0.8 1.0 0 20 40 60 80 100 2 bias = −0.005; rmse =0.11 0.0 0.2 0.4 0.6 0.8 1.0 0 20 40 60 80 100 3 bias = −0.003; rmse =0.04 0.0 0.2 0.4 0.6 0.8 1.0 0 20 40 60 80 100 4 bias = 0.002; rmse =0.04 0.0 0.2 0.4 0.6 0.8 1.0 0 20 40 60 80 100 p bias = 0; rmse =0.01421 Figure 2. Performance of the model on simulated data with low detection with seasonal 422 departure (scenario S2). For each of the 100 simulated data sets, we displayed the mean (circle) 423 and the 95% confidence interval (horizontal solid line) of the parameter. The actual value of 424 the parameter is given by the vertical dashed red line. The estimated absolute bias and root-425 mean-square error are provided in the legend of the X-axis for each parameter. Regarding 426 notations, stands for juvenile, subadult and adult survival, is the probability of first 𝜙 𝜅 427 reproduction at age 5, is dependent offspring survival conditioned upon mother survival ( 𝑠 𝑠1
428 and for singleton cub resp. yearling; and for twin litter’s cub resp. yearling), is 𝑠2 𝑠3 𝑠4 𝛽
429 breeding probability conditioned upon mother and offspring survival status (𝛽1 following loss 430 of a cub litter, 𝛽2 loss of a yearling litter, 𝛽3 for successful breeder, 𝛽4 for female without 431 dependent offspring), is the probability of producing a singleton litter conditioned upon 𝛾 432 mother’s and offspring’s survival status and upon breeding decision ( following loss of a cub 𝛾1
433 litter, loss of a yearling litter, 𝛾2 𝛾3for successful breeder, for female without dependent 𝛾4
434 offspring), is detection probability.𝑝 435
436 Case study: Polar bear demography
3 4 5 6 7 8 9 10 11 12 13 14 15 16 17 18 19 20 21 22 23 24 25 26 27 28 29 30 31 32 33 34 35 36 37 38 39 40 41 42 43 44 45 46 47 48 49 50 51 52 53 54 55 56 57 58 59 60
For Review Only
437 Departure probability was about 40% at the end of March and reached 80% at mid-May 438 (Appendix 2). About half of the two-year old bears had departed their mother at the time of 439 capture. Estimates of demographic parameters are provided in Table 2 (more results are 440 provided in Appendix 2). Independent female (aged 2+) survival was high (0.93). Individual 441 offspring survival rates, conditioned upon mother survival, did not vary significantly with litter 442 size for cubs or yearlings. Average yearling survival was lower for singleton (0.67) than for 443 litters of twin (0.80), although the 95% credible intervals did overlap. Concerning litter survival 444 conditioned upon mother survival, it was higher for twin compared to singleton, for both cubs’ 445 and yearlings’ litters. A small proportion of females, about 12%, started to reproduce (i.e. 446 produced a litter that survived at least until the first spring) at 5 y.o. Outcome of the previous 447 reproduction influenced breeding probability. Breeding probability following the loss of a cub 448 litter during the year (after capture) was low, about 10%, while it was about 50-60% for female’ 449 successful breeders or without dependent offspring at the beginning of the year or after the loss 450 of a yearling litter. Detection probability was relatively low, about 0.25 (0.22 - 0.27). At first 451 capture, 37% were independent juvenile or subadult females, 18% were adult females alone, 452 28% were adult females with one or two cubs, 12% with one or two yearlings and 5% with two-453 year old bears.
454
455 Table 2: Parameter estimates. Means are given with 95% credible intervals (CI). Dependent 456 offspring (cub age <1 y.o., yearling 1 y.o.) survival and breeding probabilities are conditioned 457 upon mother survival, litter size probability of producing a singleton is as well conditioned upon 458 breeding decision.
Parameter Notation Mean Standard
error 95% CI
Survival of female juveniles (2yo,3yo) subadults (4yo, 5yo)
and adults (5+ yo) 𝜑
0.93 0.01 0.92 – 0.95
Cub survival (<1yo)
3 4 5 6 7 8 9 10 11 12 13 14 15 16 17 18 19 20 21 22 23 24 25 26 27 28 29 30 31 32 33 34 35 36 37 38 39 40 41 42 43 44 45 46 47 48 49 50 51 52 53 54 55 56 57 58 59 60
For Review Only
- singleton (=litter survival) - litter of 2 (averaged individual survival) 𝑠1= 𝑙01 𝑠2 0.54 0.51 0.10 0.05 0.34 - 0.72 0.41 - 0.62Yearling survival (1yo)
- Singleton (=litter survival) - litter of 2 (averaged individual survival) 𝑠3= 𝑙11 𝑠4 0.67 0.80 0.11 0.09 0.46 - 0.87 0.59 - 0.93
Litter survival for twin litters
- cubs - yearlings 𝑙02 𝑙12 0.76 0.95 0.050.04 0.65 - 0.850.83 - 0.99 Probability of first reproduction at 5 yo (mate at 4yo) 𝜅 0.12 0.08 0.02 - 0.30 Breeding probability
- following loss of a cub
litter - following loss of a yearling litter - of successful female breeders or previously without dependent offspring 𝛽1 𝛽2 𝛽3= 𝛽4 0.09 0.58 0.52 0.06 0.21 0.04 0.01 - 0.23 0.19 - 0.96 0.43 - 0.61
Probability of singleton litter
- following loss of a cub
or yearling litter - of successful females breeders or previously without dependent offspring = 𝛾1 𝛾2 𝛾3= 𝛾4 0.35 0.40 0.17 0.05 0.07 - 0.71 0.30 - 0.44 Capture probability p 0.25 0.01 0.22 - 0.27 459
460 Over a 3 years period, the probability to successfully raise one offspring to independence 461 for a female polar bear, alive and without dependent offspring at the beginning of the period, 462 was on average 0.29 (0.20-0.38) and 0.04 (0.02-0.07) to raise two offspring to independence. 463 The probability of failed breeding (no offspring successfully reached independence) over this 464 period was high, about 0.67 (0.57-0.76). Note that this calculation includes breeding 465 probability, and therefore does not reflect offspring survival until independence (see Method 466 section). 467 3 4 5 6 7 8 9 10 11 12 13 14 15 16 17 18 19 20 21 22 23 24 25 26 27 28 29 30 31 32 33 34 35 36 37 38 39 40 41 42 43 44 45 46 47 48 49 50 51 52 53 54 55 56 57 58 59 60
For Review Only
468 DISCUSSION
469 Overall, our model performed well in estimating all demographic parameters in all the 470 simulated scenarios. A multievent approach is a promising tool to deal with uncertainty on the 471 timing at offspring independence both when departure probability was constant or varied within 472 the field season. Estimates obtained for adult and offspring survival, probability of sexual 473 maturation, breeding probability (except after the loss of a yearling litter), litter size 474 probabilities and detection probability were unbiased in most simulated scenarios. Precision 475 was satisfying in most cases, but it was lower for breeding probability after the loss of a yearling 476 litter and for litter size probabilities of failed breeders, especially in scenarios with low detection 477 (Appendix 1). These specific parameters should therefore be interpreted with caution for the 478 study case. In our simulations, T=15 sampling occasions appeared sufficient to obtain satisfying 479 estimates for most parameters. In the polar bear data, there were few recaptures of females on 480 subsequent years due to relatively low detection rate. As a result, preliminary analyses 481 suggested a potential confusion between these parameters. We dealt with this issue by including 482 a biologically realistic constraint on prior distributions, stating that cub survival was lower than 483 that of yearling survival (Amstrup and Durner, 1995) which was enough to ensure parameter 484 estimability. Inference in a Bayesian framework is useful in this regard, because it allows for 485 the inclusion of prior information when available (McCarthy and Masters 2005) to improve the 486 estimation of model parameters.
487 For polar bears, we showed that outcome of the previous breeding event influenced 488 breeding probability. Reduced offspring survival one year, for example due to poor 489 environmental conditions (Derocher et al. 2004), might therefore increase intervals between 490 successful reproduction through reduced breeding probability the next year (Wiig 1998). This 491 means that by ignoring multiple-year dependency among mother and offspring, classical 492 models can underestimate reproductive intervals, therefore risking to overestimate the 3 4 5 6 7 8 9 10 11 12 13 14 15 16 17 18 19 20 21 22 23 24 25 26 27 28 29 30 31 32 33 34 35 36 37 38 39 40 41 42 43 44 45 46 47 48 49 50 51 52 53 54 55 56 57 58 59 60
For Review Only
493 population growth rate. However, the biological relevance of our model is currently limited, 494 because we ignored temporal and individual heterogeneity among females in the model. 495 Survival rates for independent female bears (0.93) were close to an earlier study for the same 496 population (0.96), based on telemetry data (Wiig 1998). Our results may overestimate 497 dependent offspring survival because we focused on resident bears captured more than once. 498 Wiig (1998) results indicated that females in Svalbard went into den on average every second 499 year (while successful breeding means denning on a three-year interval), which seems coherent 500 with our results (about 33% chances of successful reproduction over a three-year period).
501 Here, we proposed a general model structure that can be applied to other species 502 providing EPC. The originalities of our approach lie in using family structure to define 503 statistical units in our model, and the inclusion of variable timing at offspring independence. 504 Using families instead of individuals allows for the inclusion of dependency among individuals 505 over multiple-years and therefore the evaluation of trade-offs and correlations between 506 offspring’s and parents’ life history parameters. Our model could be used, for example, to 507 evaluate the population-level consequences of positive or negative correlation between parents’ 508 and offspring’s traits (e.g. food sharing among group members Lee 2008; or parent-offspring 509 conflict Kölliker et al. 2013). In the case of social species (e.g. primates, elephants, orcas, 510 wolves), several adults often play a role in caring for offspring. In addition, females often give 511 birth to new offspring while still caring for older offspring and, above a certain age, adolescent 512 dependent offspring can survive despite the loss of their mother and gain independence at 513 various ages. In such cases, the number of states to represent all possible family units’ 514 composition can rapidly increase, leading to potential computational challenges to deal with 515 huge matrices. One solution is to use sparse matrices to store the data efficiently and optimize 516 matrix calculations. Above this level of complexity, an alternative solution is to limit the 517 number of states by simplifying the life cycle depending on the question of interest (e.g. 3 4 5 6 7 8 9 10 11 12 13 14 15 16 17 18 19 20 21 22 23 24 25 26 27 28 29 30 31 32 33 34 35 36 37 38 39 40 41 42 43 44 45 46 47 48 49 50 51 52 53 54 55 56 57 58 59 60
For Review Only
518 focusing on mother and maternal grand-mother considering only one litter, or focusing on 519 mother caring alone for one or more litters). For polar bears specifically, future analyses will 520 integrate in the model the effect of female age on survival and reproductive success (Atkinson 521 and Ramsay 1995; Folio et al. 2019) and influence of climatic variables on body weight and 522 demography (Derocher et al. 2004; Stirling and Derocher 2012) as individual and 523 environmental covariates in a regression-like framework. Our model could then be used to 524 provide population predictions of the demographic response of the Barents Sea polar bear 525 population under climate change (Hunter et al., 2010; Regehr et al., 2016, 2018, Laidre et al. 526 2020).
527 Acknowledgements : This study was supported by World Wildlife Fund. We thank Magnus 528 Andersen for his participation in fieldwork, and Thor Larsen for initiating the monitoring. SC 529 is supported by a grant from the Agence Nationale de la Recherche (ANR-18-CE02-0011, 530 MathKinD).
531 Data Accessibility Statement : Authors agree to archive the data used in this manuscript in a 532 publicly accessible repository such as Dryad and Github upon acceptance of the manuscript 533 (together with R scripts to run the model and the simulation study).
534 Authors’ contributions: SC, OG, NY and RP conceived the ideas and designed methodology; 535 JA, RAI and ØW collected the data; SC analysed the data; SC led the writing of the manuscript. 536 All authors contributed critically to the drafts and gave final approval for publication.
537 3 4 5 6 7 8 9 10 11 12 13 14 15 16 17 18 19 20 21 22 23 24 25 26 27 28 29 30 31 32 33 34 35 36 37 38 39 40 41 42 43 44 45 46 47 48 49 50 51 52 53 54 55 56 57 58 59 60
For Review Only
538 Bibliography
539 Amstrup, S. C., & DeMaster, D. P. (2003). Polar bear, Ursus maritimus. Wild mammals of 540 North America: biology, management, and conservation, 2, 587-610.
541 Amstrup, S. C., & Durner, G. M. (1995). Survival rates of radio-collared female polar bears 542 and their dependent young. Canadian Journal of Zoology, 73, 1312–1322. 543 doi:10.1139/z95-155
544 Atkinson, S. N., & Ramsay, M. A. (1995). The Effects of Prolonged Fasting of the Body 545 Composition and Reproductive Success of Female Polar Bears (Ursus maritimus). 546 Functional Ecology, 9(4), 559. doi:10.2307/2390145
547 Clutton-Brock, T. H. (1991). The evolution of parental care. Princeton: Princeton University
548 Press.
549 Cole, D. J., Morgan, B. J. T., McCrea, R. S., Pradel, R., Gimenez, O., & Choquet, R. (2014). 550 Does your species have memory? Analyzing capture-recapture data with memory models. 551 Ecology and Evolution, 4(11), 2124-2133.
552 Couet, P., Gally, F., Canonne, C., & Besnard, A. (2019). Joint estimation of survival and 553 breeding probability in female dolphins and calves with uncertainty in state assignment. 554 Ecology and evolution, 9(23), 13043-13055.
555 Dahle, B., & Swenson, J. E. (2003). Factors influencing length of maternal care in brown bears 556 (Ursus arctos) and its effect on offspring. Behavioral Ecology and Sociobiology, 54(4),
557 352-358.
558 Derocher A., & Stirling, I. (1994). Age‐specific reproductive performance of female polar bears 559 (Ursus maritimus). Journal of Zoology, 234(4), 527–536.
560 Derocher, A. ., Lunn, N. ., & Stirling, I. (2004). Polar bears in a warming climate. (Ursus 3 4 5 6 7 8 9 10 11 12 13 14 15 16 17 18 19 20 21 22 23 24 25 26 27 28 29 30 31 32 33 34 35 36 37 38 39 40 41 42 43 44 45 46 47 48 49 50 51 52 53 54 55 56 57 58 59 60
For Review Only
561 maritimus). Integrative and Comparative Biology, 44(2), 163–176.
562 Derocher, A.E., 2005. Population ecology of polar bears at Svalbard, Norway. Population 563 Ecology, 47(3), pp.267-275.
564 Derocher, A. (2013). Polar bears: a complete guide to their biology and behavior. Choice 565 Reviews Online, 49(12), 49-6887-49–6887. doi:10.5860/choice.49-6887
566 Doligez, B., Clobert, J., Pettifor, R. A., Rowcliffe, M., Gustafsson, L., Perrins, C. M., & 567 McCleery, R. H. (2002). Costs of reproduction: Assessing responses to brood size 568 manipulation on life-history and behavioural traits using multi-state capture-recapture 569 models. Journal of Applied Statistics, 29(1–4), 407–423.
570 Eldegard, K., & Sonerud, G. A. (2010). Experimental increase in food supply influences the 571 outcome of within-family conflicts in Tengmalm’s owl. Behavioral Ecology and
572 Sociobiology, 64(5), 815-826.
573 Folio, D.M., Aars, J., Gimenez, O., Derocher, A.E., Wiig, Ø. and Cubaynes, S., (2019). How 574 many cubs can a mum nurse? Maternal age and size influence litter size in polar bears. 575 Biology letters, 15(5), p.20190070.
576 Gimenez, O., Lebreton, J.-D., Gaillard, J.-M., Choquet, R. and R. Pradel (2012). Estimating 577 demographic parameters using hidden process dynamic models. Theoretical Population
578 Biology 82, 307-316.
579 Gimenez, O., Cam, E., & Gaillard, J.-M. (2018). Individual heterogeneity and capture-recapture 580 models: what, why and how? Oikos, 127(5), 664–686.
581 Hansson, R., & Thomassen, J. (1983). Behavior of polar bears with cubs in the denning area. 582 Bears: Their Biology and Management, 246–254.
583 Hunter, C. M., Caswell, H., Runge, M. C., Regehr, E. V., Amstrup, S. C., & Stirling, I. (2010). 584 Climate change threatens polar bear populations: a stochastic demographic analysis. 3 4 5 6 7 8 9 10 11 12 13 14 15 16 17 18 19 20 21 22 23 24 25 26 27 28 29 30 31 32 33 34 35 36 37 38 39 40 41 42 43 44 45 46 47 48 49 50 51 52 53 54 55 56 57 58 59 60
For Review Only
585 Ecology, 91(10), 2883–2897.
586 Kölliker, M., Kilner, R. M., & Hinde, C. A. (2013). Parent–offspring conflict. In The Evolution
587 of Parental Care.
588 Kramer, K. L. (2005). Children's help and the pace of reproduction: cooperative breeding in 589 humans. Evolutionary Anthropology: Issues, News, and Reviews: Issues, News, and
590 Reviews, 14(6), 224-237.
591 Lagrange, P., Gimenez, O., Doligez, B., Pradel, R., Garant, D., Pelletier, F., & Bélisle, M. 592 (2017). Assessment of individual and conspecific reproductive success as determinants of 593 breeding dispersal of female tree swallows: A capture-recapture approach. Ecology and
594 Evolution, 7(18), 7334–7346.
595 Laidre, K. L., Atkinson, S., Regehr, E. V., Stern, H. L., Born, E. W., Wiig, Ø., ... & Dyck, M. 596 (2020). Interrelated ecological impacts of climate change on an apex predator. Ecological
597 Applications, e02071.
598 Lebreton, J. D., Nichols, J. D., Barker, R. J., Pradel, R., & Spendelow, J. A. (2009). Chapter 3 599 Modeling Individual Animal Histories with Multistate Capture-Recapture Models. 600 Advances in Ecological Research.
601 Lee, P. C., & Moss, C. J. (1986). Early maternal investment in male and female African elephant 602 calves. Behavioral Ecology and Sociobiology, 18(5), 353–361.
603 Lee, R. (2008). Sociality, selection, and survival: Simulated evolution of mortality with 604 intergenerational transfers and food sharing. Proceedings of the National Academy of
605 Sciences.
606 Lunn, N.J., Servanty, S., Regehr, E.V., Converse, S.J., Richardson, E. and Stirling, I.( 2016). 607 Demography of an apex predator at the edge of its range: impacts of changing sea ice on 608 polar bears in Hudson Bay. Ecological Applications, 26(5), pp.1302-1320.Mauritzen, M., 3 4 5 6 7 8 9 10 11 12 13 14 15 16 17 18 19 20 21 22 23 24 25 26 27 28 29 30 31 32 33 34 35 36 37 38 39 40 41 42 43 44 45 46 47 48 49 50 51 52 53 54 55 56 57 58 59 60
For Review Only
609 Derocher, A. E., & Wiig, Ø. (2011). Space-use strategies of female polar bears in a 610 dynamic sea ice habitat. Canadian Journal of Zoology, 79(9), 1704–1713.
611 Mauritzen, M., Derocher, A.E., Wiig, Ø., Belikov, S.E., Boltunov, A.N., Hansen, E. and Garner, 612 G.W., (2002). Using satellite telemetry to define spatial population structure in polar bears 613 in the Norwegian and western Russian Arctic. Journal of Applied Ecology, 39(1),
pp.79-614 90.
615 McCarthy, M. A., & Masters, P. (2005). Profiting from prior information in Bayesian analyses 616 of ecological data. Journal of Applied Ecology, 42(6), 1012–1019.
617 Pavard, S., & Branger, F. (2012). Effect of maternal and grandmaternal care on population 618 dynamics and human life-history evolution: A matrix projection model. Theoretical
619 Population Biology.
620 Plummer, M., Stukalov, A., Denwood, M. and Plummer, M.M., (2016). Package ‘rjags’. 621 Vienna, Austria.
622 Pollock, K. H. (2002). The use of auxiliary variables in capture-recapture modelling: An 623 overview. Journal of Applied Statistics, 29(1–4), 85–102.
624 Pradel, R. (2005) Multievent: An extension of multistate capture–recapture models to uncertain 625 states ». Biometrics 61: 442-447
626 Pradel, R., & Sanz-Aguilar, A. (2012). Modeling Trap-Awareness and Related Phenomena in 627 Capture-Recapture Studies. PLoS ONE, 7(3), e32666.
628 Ramsay, M. A., & Stirling, I. (1988). Reproductive biology and ecology of female polar bears 629 in western Hudson Bay. Naturaliste Canadien, 109(4), 941–946.
630 Regehr, E. V., Laidre, K. L., Resit Akcakaya, H., Amstrup, S. C., Atwood, T. C., Lunn, N. J., 631 … Wiig, Ø. (2016). Conservation status of polar bears (Ursus maritimus) in relation to 632 projected sea-ice declines. Biology Letters, 12(12).
3 4 5 6 7 8 9 10 11 12 13 14 15 16 17 18 19 20 21 22 23 24 25 26 27 28 29 30 31 32 33 34 35 36 37 38 39 40 41 42 43 44 45 46 47 48 49 50 51 52 53 54 55 56 57 58 59 60