HAL Id: hal-01274148
https://hal.archives-ouvertes.fr/hal-01274148
Submitted on 15 Feb 2016
HAL is a multi-disciplinary open access
archive for the deposit and dissemination of
sci-entific research documents, whether they are
pub-lished or not. The documents may come from
teaching and research institutions in France or
abroad, or from public or private research centers.
L’archive ouverte pluridisciplinaire HAL, est
destinée au dépôt et à la diffusion de documents
scientifiques de niveau recherche, publiés ou non,
émanant des établissements d’enseignement et de
recherche français ou étrangers, des laboratoires
publics ou privés.
To cite this version:
A. Pires de Camargo, B. Molle, S. Tomas, J.A. Frizzone. Assessment of clogging effects on lateral
hydraulics: proposing a monitoring and detection protocol. Irrigation Science, Springer Verlag, 2014,
32 (3), pp.181-191. �10.1007/s00271-013-0423-z�. �hal-01274148�
ASSESSMENT OF CLOGGING EFFECTS ON
LATERAL
HYDRAULICS:
PROPOSING
A
MONITORING AND DETECTION PROTOCOL
Camargo AP, Molle B, Tomas S, Frizzone JAAntonio Pires de Camargo, Departamento de Engenharia de Biossistemas, Escola Superior de Agricultura Luiz de Queiroz, Universidade de São Paulo, Av. Padua Dias, 11 - LEB - ESALQ, CEP: 13418-900, Piracicaba, SP, Brazil, e-mail: apcpires@usp.br, phone: +55 19 3447-8574.
Bruno Molle, Institut national de recherche en sciences et technologies pour l'environnement et l'agriculture - Centre d'Aix en Provence, 3275 Route de Cézanne CS 40061, 13182, Aix en Provence Cedex 5, France. Séverine Tomas, Institut national de recherche en sciences et technologies pour l'environnement et
l'agriculture - Centre d'Aix en Provence, 3275 Route de Cézanne CS 40061, 13182, Aix en Provence Cedex 5, France.
José Antônio Frizzone, Departamento de Engenharia de Biossistemas, Escola Superior de Agricultura Luiz de Queiroz, Universidade de São Paulo, Av. Padua Dias, 11 - LEB - ESALQ, CEP: 13418-900, Piracicaba, SP, Brazil.
Abstract Ageing of drip irrigation systems due to clogging of emitters is considered the largest maintenance
problem in microirrigation and this problem is enhanced in subsurface irrigation systems. Whatever the source of the clogging problem, a methodology for early detection of clogging in-field can be useful in decision-making about deploying cleaning processes (flushing or injection of chemicals) and avoiding replacement of laterals. This work presents a methodology for simulating clogging conditions able to reproduce the effects of clogging on pressure profiles, head loss and emitters flow rate distribution along a single levelled lateral with constant inlet pressure. This methodology was validated by several experiments conducted under controlled conditions of clogging induced by changes in the flow rate of emitters. The effects of clogging intensity and position on hydraulic parameters of a single lateral were analysed in detail and aspects relating to pressure, head loss and flow rate measurements were discussed. For a given lateral setup it is possible to draw a chart relating flow rate and head loss for various levels and positions of clogging. Assuming that measurements of head loss and flow rate are available, this diagram enables immediate estimation of the level and location of clogging, which is useful for deploying maintenance routines. Finally, a protocol was proposed to detect the level of clogging and estimate its position along a levelled lateral under constant inlet pressure. Although constant lateral inlet pressure is atypical in large agricultural settings, it may occur in greenhouse or experimental settings.
INTRODUCTION
Ageing of drip irrigation systems due to clogging of emitters is considered the largest maintenance problem in microirrigation (Capra and Scicolone 1998, Niu et al. 2012) and is directly associated with the quality of irrigation water (Nakayama and Bucks 1991, Duran-Ros et al. 2009). Emitter clogging is related to insufficient or inadequate filtration, inadequate chemical balance of water, infrequent flushing (Lamm and Camp 2007) or insufficient monitoring of system hydraulic behaviour. It occurs as an individual or combined result of physical, chemical and biological agents. Clogging caused by solid particles is considered the most common plugging form of emitters (Adin and Alon 1986, Nakayama and Bucks 1991). Sometimes, even with careful filtration, significant amounts of sediment may be present in the laterals due to the phenomenon of flocculation and aggregation of fine particles (Niu et al. 2012, Bounoua 2010) and ion precipitates inside pipes and emitters (Nakayama and Bucks 1991). Flushing can also be used to remove particles and organisms that have escaped filtration and accumulated within the driplines (Puig-Bargués et al. 2010). Regarding clogging problems caused by biological agents, chlorination is the most widely used chemical treatment to control microbial population (Nakayama and Bucks 1991). Precipitation of ions is one of the principal chemical sources of clogging problems and is affected by several factors, although the pH of water seems to be the most important (Lamm and Camp 2007). Furthermore, when the pH of water is maintained at lower than seven, most clogging problems related to precipitation of ions, as well as the proliferation of microorganisms, are mitigated (Pinto et al. 2011). Clogging problems in drip irrigation systems result in changes in emitter flow distribution uniformity and lateral line hydraulics (Bralts et al. 1981). Clogging induces poor water distribution among plants, which can result in either excess irrigation or deficient water supply to plants (Nakayama and Bucks 1981, Liu and Huang 2009) and cancelling out of most of the benefits of using drip irrigation to save water.
According to Bralts et al. (1981) there are at least five possible cases of emitter plugging: a) all plugging is partial in nature and affects all emitters equally; b) all plugging is partial in nature and affects a specific proportion of emitters equally; c) all plugging is complete in nature and affects all emitters equally; d) all plugging is complete in nature and effects a specific proportion of the emitters equally and e) all plugging is a combination of complete plugging and partial plugging. This last case is the most prevalent and all the other cases derive from it. Bralts et al. also observe that countless degrees of partial clogging exist along a lateral line, but the solution for this case was beyond the scope of their study. Besides, emitter clogging may be gradual, or it may occur instantaneously (Nakayama and Bucks 1991). The phenomenon of clogging and self-cleaning of the emitter is also reported (Adin and Sacks 1991) and may be caused by the combined effect of fluctuations of suspended solids content in the water and hydraulic operation of the system. When the system is turned on, the high initial velocity of water may move sediment particles, partially cleaning the dripper. Similarly, the high startup velocity in the supply lines cleans out the hose and flushes accumulated particles downstream. This explains why clogging has a greater effect on the drippers located at the end of the lateral where more particles settle due to low water velocity (Capra and Scicolone 1998). However, clogging problems can also occur near the lateral inlet where the shear stress in the flow increases the probability of particle aggregation (Bounoua, 2010). Regardless of the cause, severely clogged drip irrigation
systems may be difficult or impossible to remediate (Lamm and Camp 2007). The detection of such a phenomenon as early as possible would therefore seem to be pertinent.
Although emitter clogging is a common problem in irrigation systems, it is difficult to be expressed with mathematical models at present (Zhang et al., 2011).The detection of clogged emitters remains difficult because of the large number of emitting points as well as the difficulty in observing what happens directly at these points. Moreover, it becomes impossible when the drippers are buried in the soil, whether at shallow (drip tapes) or deeper depth. An effective technique for the detection of clogging in microirrigation systems must be developed (Talozi and Hills 2001), particularly in the case of subsurface drip irrigation development. Whatever the source of the clogging problem, a methodology for early detection of clogging in the field can be useful in initiating cleaning processes (flushing or injection of chemicals) and avoiding replacement of laterals. Moreover, detection of clogging during its initial stages makes it easier to remedy.
Nakayama and Bucks (1981) presented a simulation model for emitter clogging in trickle irrigation without considering the hydraulic implications of clogging, such as the increase in average pressure head along the line due to the decrease in discharge of clogged emitters. Bralts et al. (1982) proposed theoretical equations relating the percentage of plugging to the corresponding total flow variation on drip irrigation laterals. Their theoretical analysis and laboratory measurements assumed that the level of plugging was uniformly distributed along a lateral line. Povoa and Hills (1994) developed a hydraulic model to detect emitter clogging and leakage in laterals of microirrigation systems considering several scenarios of partial and full emitter plugging. The authors showed that the detection of pressure fluctuations due to clogging or leakage was observable using pressure sensors at lateral inlets. Talozi and Hills (2001) developed a mathematical model that simulates the effects of emitter clogging in a microirrigation subunit. They also evaluated different clogging scenarios with their model and discussed clogging effects on subunit hydraulics. These authors concluded that full clogging of some emitters can be detected by pressure sensors placed at the pump outlet, manifold inlet, manifold endpoint, and at a few points along the manifold. Their idea was to identify clogging from the hydraulic gradient along the manifold and compare it with an initial situation free of any clogging. These works discussed methods for detecting clogging based on pressure measurements at lateral and subunit level, but they are complicated to operate because of the number and distance between measurement points. It emerged that these methods were not adaptable to estimating the position of clogging and thus its influence on distribution uniformity. A methodology based on pressure measurements is only technically feasible but requires a large number of high accuracy pressure sensors which may be very expensive.
The idea developed in the present paper further builds on previous works with the following objectives: a) to develop and validate by means of experimentation a methodology for simulating various clogging conditions and positions in a single lateral and the corresponding effects on lateral hydraulics; b) to propose a protocol based on pressure and flow rate measurements to detect clogging level and estimate its position along a single lateral.
MATERIAL AND METHODS
Description of test material and facilities
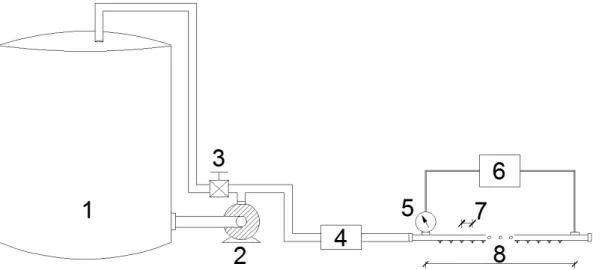
The measurements were conducted with a facility consisting of a supply tank of 500 L connected to a centrifugal pump (Gardena 3000/3, 600 W) delivering a maximum flow rate of 3 m3h-1 with a maximum pressure head of 32 m. A valve positioned between the pump and a flow meter (Endress Hauser, range 0 to 3 m3h-1, accuracy 0.2%) facilitated the return of part of the flow to the tank to set the lateral inlet pressure. A differential pressure transducer (Endress Hauser, 0 to 50 kPa, accuracy of 0.2%) was connected via 4-mm diameter tubing to the inlet and outlet of the lateral under test. A pressure transducer (Endress Hauser, range 0 to 600 kPa, accuracy 0.2%) was added at the lateral inlet. The lateral was made of polyethylene: length 36 m, internal diameter 16.7 mm, wall thickness 1.8 mm; to which 120 on-line emitters were connected at 0.3 m intervals (1).
The drippers used were non-regulated E1000®-John Deere Water, provided in three nominal flow rates (2, 4, and 8 Lh-1). The operating pressure ranged from 80 to 200 kPa, while the nominal value was 100 kPa. The drippers were designed in such a way that the labyrinth could be modified to combine various levels of discharge, which enabled us to simulate various levels of clogging.
Fig. 1 Experimental setup: (1) tank, (2) pump, (3) valve, 4) flow meter, (5) pressure transducer, (6)
differential pressure transducer, (7) emitter spacing and (8) lateral length
Testing conditions
Initially, the local head losses induced by the insertion of drippers were experimentally determined. The 120 emitters connected to the lateral were plugged and various flow rates (range 0 to 900 Lh-1) were applied through the lateral under a constant pressure of 130 kPa, which was intentionally higher than the nominal value in order to increase the head loss along the lateral. The criteria of hydraulic design of laterals accounting for emitters operating in turbulent flow are usually set as 10% and 20% emitter outflow variation which is equivalent to values of about 20% and 40% of allowable head loss along the lateral (Yildirim 2009). Considering the testing pressure of 130 kPa, a maximum measured head loss of 21.4 kPa (2.18 m) can be observed, which is still slightly lower than 20% of the lateral inlet pressure. That experimental condition thus
assures to reproduce the hydraulic conditions that would be found in-field. A plain pipe was also tested under the range mentioned in order to distinguish between continuous head loss and local head losses.
Thereafter, emitters of 8 Lh-1 represented the control situation without clogging, (normal operating condition) while discharges of 4 Lh-1 and 2 Lh-1 represented various levels and positions of clogging. A similar methodology was described by Povoa and Hills (1994) focusing on partial and total clogging occurring only near the lateral end.
Twenty-five scenarios of clogging were induced by arranging various sequences of 2, 4, and 8 Lh-1 emitters along the lateral. Five levels of clogging (or discharge reduction) were evaluated from 0 to 50% by arranging the various emitters along the lateral and represented as a fraction of decrease in lateral inlet flow rate ( ). The levels of clogging were induced in different positions along the lateral and their respective effects on hydraulic parameters were measured. Conditions A, B, and C represent the most common situations in the field, once clogging is more likely to occur at the lateral downstream rather than at the inlet portion (Povoa and Hills 1994, Capra and Scicolone 1998). Conditions D and E represent clogging increasing from the lateral inlet to the lateral end, which is also sometimes observed in field conditions. According to Niu et al. (2012) inlets and corners of labyrinth emitters are the places where clogging often initiates. The flow velocity at the channel inlet changes abruptly due to the sudden contraction of cross section from drip tape to emitter labyrinth channel. It seems the high turbulence and shear stress induced at this particular position increases the probability of small particles of clay entering and aggregating. Bounoua (2010) found particles of more than 1mm diameter behind an 80µ m filter in field conditions. These larger particles have been observed within driplines as a result of flocculation and aggregation of fine particles enhanced by the presence of ions (Nakayama and Bucks 1981, Niu et al. 2012). On the other hand, fluid mechanics simulations show that the labyrinth presents areas where the velocity of water is close to zero, which may help particle sedimentation and trapping over the course of several irrigation events. Finally, the five following scenarios were evaluated combining the different emitters discharge:
• Condition A: average clogging increasing from the lateral end to the lateral inlet, using emitters of 8 Lh-1 gradually replaced with 4 Lh-1 emitters;
• Condition B: severe clogging increasing from the lateral end to the lateral inlet, using emitters of 8 Lh-1 gradually replaced with 2 Lh-1 emitters;
• Condition C: severe clogging followed by average clogging increasing from the lateral end to the lateral inlet, using emitters of 8 Lh-1 gradually replaced with emitters of 4 Lh-1 and 2Lh-1, the most severe clogging conditions being located at the end of the lateral;
• Condition D: average clogging increasing from the lateral inlet to the lateral end, using emitters of 8 Lh-1 gradually replaced with 4 Lh-1 emitters;
• Condition E: severe clogging increasing from the lateral inlet to the lateral end, using emitters of 8 Lh-1 gradually replaced with 2 Lh-1 emitters.
All the clogging tests were performed under a 130 kPa regulated pressure. Although not representative of most field conditions, where the network and pump operating points move while clogging progresses, such conditions allowed the analysis of pure clogging effects on lateral hydraulics.
For each type of emitter a sample of 25 emitters was evaluated prior to the experiment, following the ISO9261 standard (2004), to determine the manufacturing uniformity (coefficient of variation of flow rate,
) and the flow rate versus pressure function (range of testing pressure 80 to 240 kPa with increment of 20 kPa). The water temperature during these tests was 23 ± 1ºC.
(%) = 100 (1)
where: = coefficient of variation of flow rate (%); : standard deviation of flow rate (Lh-1); : average of flow rate (Lh-1).
Methodology for simulating clogging and its effects on hydraulic parameters of a single lateral
For a given level of clogging, the location where the problem occurs affects the head loss (Povoa and Hills 1994), the pressure profile and consequently the discharge of each emitter. Individual emitter discharges rely on the pressure profile along the lateral, which can be reproduced by a step-by-step method calculating hydraulic parameters between consecutive emitters.
The approach proposed is based on the Darcy–Weisbach equation, which appears to be the most appropriate (Bagarello et al. 1995, Romeo et al. 2002). It can be applied for levelled laterals accounting for emitters with known flow rate versus pressure curve. Scenarios of clogging are induced by arranging emitters along the lateral to achieve a desired reduction in flow rate. The Darcy–Weisbach equation can be expressed as:
ℎ = 2 (2)
where: ℎ = continuous head loss between two consecutive emitters (m); = friction coefficient of Darcy-Weisbach formula (-); = distance between emitters (m); = internal diameter of the pipe (m); = gravitational acceleration (m s-2); = mean water velocity at uniform pipe sections (m s-1).
The value of the friction coefficient relies on the flow regime (turbulent, transient or laminar) depending on the position along the lateral. Although the Blasius equation is traditionally combined with the Darcy-Weisbach equation to estimate this coefficient along laterals (Demir et al. 2007, Rettore Neto et al. 2009), this approach is valid only for hydraulically smooth pipes and Reynolds numbers ( ) between 4000 and 105. However, values of inferior to 4000 are usually observed near the end of microirrigation laterals. Alternatively, the Churchill equation (Eq. 3) could be used, since it is valid for rough and smooth pipes, for the full range of flow regime from laminar to turbulent and is easy to use with a step-by-step method. The parameter in the Churchill equation is primarily significant for large Reynolds numbers in the fully turbulent region, whereas the parameter is primarily significant for lower Reynolds numbers in the transition region (Allen 1996). = 8 8 +( + )1 .!" = #−2.457 ln 7 *.++ 0.27 ,-."/ 0 = 37530 0 (3)
where: - = roughness of pipe wall surface (m); = Reynolds number = 2
3 ; 4 = kinematic viscosity (m
The insertion of emitters along the lateral line induces local pressure losses that are often expressed as a fraction of the kinetic head (Eq. 4) (Yildirim 2010).
ℎ 5= 652 (4)
where: ℎ 5 = local head loss generated by an emitter insertion (m); 65 = coefficient of local head loss ( - ); 27
8 = kinetic head at the emitter's position (m).
The coefficient 65 depends on the ratio between the cross-sectional area of flow where an emitter is located and the cross-sectional area of the pipe (Bagarello et al. 1997). However, under clogging conditions the geometry of emitters' insertion can be changed by clogging agents developing around the insertion of on-line emitters or attached to the wall of in-line emitters. 65 can therefore be affected by the severity of clogging on each emitter and according to the clogging agent nature, but it is not addressed in this study. The use of computational fluid dynamics (CFD) to study flow characteristics inside drip irrigation emitters can help to optimize their design and improve their clogging resistance (Qingsong et al., 2006; Li et al., 2008). Thus CFD techniques also could be useful to analyse how clogging affects the coefficient of local head loss of emitters.
Total head loss between two consecutive emitters (9 ) results from Eq. (5), whereas total head loss along the lateral (9 ) results from the sum of all individual values of 9 .
9 = ℎ + ℎ 5 (5)
The major challenge is to simulate properly the pressure profile along the lateral under partial clogging conditions. The pressure head at the lateral inlet (9:;) and the accumulated head loss from the lateral inlet to an emitter < (9 *→>) are required to determine the pressure head on the emitter < (ℎ>). The index < represents an emitter or a position along the lateral and it ranges from 1 to the number of emitters in the lateral (?). Initially, the pressure profile and the head loss curve along the lateral are unknown. The pressure profile can be adjusted by performing successive iterations. The first iteration is run using a constant inlet pressure. After each iteration, the pressure head on each emitter is calculated considering the pressure head at the lateral inlet decreased by the accumulated head loss (ℎ>= 9:;− 9 *→>). The difference between relative errors of consecutive iterations (Δ@) is minimised after a few iterations, usually five, when Δ@ becomes inferior to
0.01%. The relative error of consecutive iterations is given by Eq. (6), where @>A BCA>DE represents the relative error between simulated and measured values of head loss (Eq. 7).
Δ@ = @>A BCA>DEF − @>A BCA>DE (6) @>A BCA>DE= 100|H CIJB KF IA>HCA K|H CIJB K (7) This methodology enables simulation of the effects of various levels of clogging on head loss and flow rate. An open-source web application for helping with simulations based on the described methodology has been developed and is available at https://github.com/apcpires/cloggingLateral. A flowchart summarising the methodology proposed to simulate clogging conditions and its effects on the hydraulic parameters of a single lateral is also available via the same link.
Statistical indices used to assess the methodology for simulating clogging
the accuracy and precision of a model in a single value (
Camargo & Sentelhas coefficient is the product of Pearson's correlation coefficient (eq. index of agreement (eq. 9) (Willmott
L MK where: N = measured values; O
index of agreement; P = Camargo & Sentel
Table 2 Criteria for model assessing based on Camargo & Sentelhas coefficient (Camargo and Sentelhas
1997)
Performance Excellent Very good
c > 0.85 0.76
RESULTS AND DISCUSSION
Measurement of the head loss caused by the insertion of drippers
Continuous head loss along the lateral (
plain pipe and the same pipe with 120 plugged emitters, respectively (
introuvable.a). Local head losses were estimated by the difference between total and continuous head loss.
According to Bagarello et al. (1997), for a given pipe
Reynolds number and it is usually characterised by an average value. For testing conditions of velocity between 0.13 and 1.28 ms-1 (
an average value of 0.15 and standard deviation of 5.83×10 loss compared to the plain pipe (
a
Fig. 2 a) Curves of flow rate versus head loss resulted from testing a plain pipe and the same pipe with 120
plugged emitters; b) Coefficient of local head loss (
the accuracy and precision of a model in a single value (Eq. 10) that can be interpreted based on Camargo & Sentelhas coefficient is the product of Pearson's correlation coefficient (eq.
) (Willmott et al. 1985).
= ∑ R(NE>U >− N̅)(O>− O)T V∑ (NE>U >− N̅) V∑ (OE>U >− O) K= 1 − ∑ (O>− N>) E >U ∑ (|OE>U >− N̅| + |N>− N̅|) P = L MK
O = estimated values; L = Pearson's correlation coefficient;
= Camargo & Sentelhas coefficient.
Criteria for model assessing based on Camargo & Sentelhas coefficient (Camargo and Sentelhas
Very good Good Regular Unsatisfactory
0.76-0.85 0.66-0.75 0.61-0.65 0.51-0.60
RESULTS AND DISCUSSION
Measurement of the head loss caused by the insertion of drippers
Continuous head loss along the lateral (9 ) and total head loss (9 ) were determined based on testing a same pipe with 120 plugged emitters, respectively (Erreur
a). Local head losses were estimated by the difference between total and continuous head loss. . (1997), for a given pipe-emitter system, 65 is practically independent of Reynolds number and it is usually characterised by an average value. For testing conditions of velocity
between 2100 and 21000), the coefficient of local head loss (
an average value of 0.15 and standard deviation of 5.83×10⁻³, which represents an increase of 15% in head loss compared to the plain pipe (Erreur ! Source du renvoi introuvable.b).
b
Curves of flow rate versus head loss resulted from testing a plain pipe and the same pipe with 120 plugged emitters; b) Coefficient of local head loss (WX) versus flow velocity
) that can be interpreted based on Table 1. The Camargo & Sentelhas coefficient is the product of Pearson's correlation coefficient (eq. 8) and Willmott's
(8)
(9)
(10) = Pearson's correlation coefficient; MK = Willmott's Criteria for model assessing based on Camargo & Sentelhas coefficient (Camargo and Sentelhas
Bad Awful
0.41-0.50 ≤ 0.40
) were determined based on testing a
Erreur ! Source du renvoi
a). Local head losses were estimated by the difference between total and continuous head loss. is practically independent of Reynolds number and it is usually characterised by an average value. For testing conditions of velocity and 21000), the coefficient of local head loss (65) presented , which represents an increase of 15% in head
Coefficient of variation of flow rate (YZ[) and relation pressure-flow rate
The flow rate versus pressure curve as well as the CVq of emitters was determined using an automated testing bench available in the laboratory, complying with ISO 9261 requirements, which is independent from the clogging bench. For an operating pressure of 120 kPa, the emitters of 2, 4, and 8 Lh-1 presented of 1.49, 1.33, and 2.08%, respectively. These results correspond to a very good level of manufacturing according to ISO 9261. Such a level of homogeneity is essential to precisely reproduce experimental levels of clogging. Considering the equations presented in Table 3, displaying the value of the exponent, these drippers are classified as non-regulated.
Table 3 Relation pressure-flow rate of the emitters (testing pressure - ℎ, flow rate - , and standard deviation
of flow rate - )
2 Lh-1 4 Lh-1 8 Lh-1
ℎ (kPa) (Lh-1) (Lh-1) ℎ (kPa) (Lh-1) (Lh-1) ℎ (kPa) (Lh-1) (Lh-1) 81 1.851 0.027 80 3.596 0.043 80 7.396 0.144 99 2.048 0.032 101 4.007 0.053 101 8.220 0.166 121 2.224 0.033 122 4.362 0.058 120 8.920 0.186 138 2.390 0.041 139 4.666 0.067 138 9.687 0.192 161 2.531 0.042 160 5.013 0.071 161 10.278 0.208 185 2.707 0.044 181 5.302 0.076 179 10.837 0.200 200 2.830 0.046 200 5.557 0.085 200 11.417 0.232 219 2.976 0.047 220 5.844 0.089 220 11.991 0.227 239 3.082 0.049 240 6.101 0.098 239 12.432 0.267 = 0.235 ℎ*.\0]; = 0.998 = 0.432 ℎ*.\] ; = 0.999 = 0.912 ℎ*.\``; = 0.999
Measured values of flow rate and head loss under variable clogging conditions
Table 4 shows the clogging conditions induced by arranging emitters of 2, 4, and 8 Lh-1 in various positions along the same lateral, as well as the respective measured values of flow rate and total head loss along the lateral.
Assessment of the methodology for simulating clogging conditions
Fig. 3 shows measured and estimated values of head loss and flow rate, as well as the corresponding statistical indices. Based on the Camargo & Sentelhas coefficient (P) the proposed methodology to simulate clogging along a lateral presented an excellent performance.
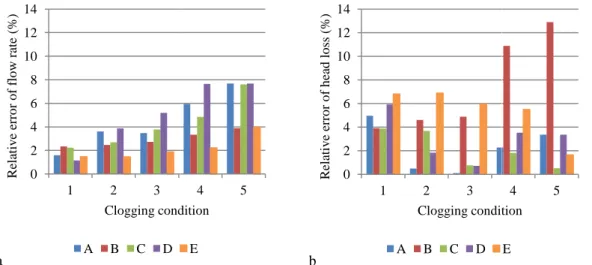
Fig. 4 presents relative errors between measured and estimated values of lateral flow rate and total head loss. The maximum relative error on estimating lateral flow rate was 7.68% (conditions A5 and D5), which seems to be an acceptable error. The highest relative errors of head loss reached 12.90% (B5) and 10.88% (B4) and these high values were possibly caused by experimental errors accumulated with the fact that the head loss was very low. Consequently the differential pressure transducer was operating at its limit of accuracy. Neglecting both errors, the maximum relative error would be 6.88% (E2). In a similar study, Povoa and Hills (1994) reported that estimated head loss by their model did not deviate more than 4% from field data, which appears to be a very good result since their model assumes a uniform pressure profile along the lateral and it neglects local head losses.
Relation between clogging condition and head loss along the lateral
Fig. 5 shows estimated and measured values of head loss on each testing condition highlighting the decrease in head losses as clogging increases under a constant inlet pressure. Considering the measurements on each level of clogging, a wide range of head loss values was observed. By analysing the experimental data, the coefficients of variation of head loss were 11.4, 22.6, 31.3, 36.7 and 36.4% corresponding to the levels of clogging of 0.1, 0.2, 0.3, 0.4 and 0.5, respectively. Each coefficient of variation of head loss was calculated based on the five values of head loss obtained from the experiments evaluating five scenarios of clogging (A, B, C, D and E) on each level of clogging. It was proven that clogging position significantly affects the head loss along the lateral. The decrease in head loss as level of clogging increased was smaller under conditions D and E (clogging induced near the lateral inlet) than under conditions A, B, and C (clogging near the lateral end). Moreover, analysing conditions D1 and E1, the measured values of head loss remained close to the values observed under normal (clean) condition (9 (EDBHCa) = 2.180 m; 9 ( ) = 2.081 m; 9 (b ) = 2.094 m); hence, if pressure is the indicator, very accurate sensors are required to reveal initial stages of such clogging (Povoa and Hills 1994). On the other hand, clogging problems occurring near to the lateral end (conditions A, B, and C) can easily be detected. A 10% increase in the level of clogging results in meaningful decrease in head loss (Fig. 5).
Table 4 Arrangement of emitters along the lateral and respective measured values of flow rate (c) and total
head loss (9 )
∗ Condition Arrangement of emitters along the lateral Measured values
c (m3 h-1) 9 (m) 0.0 Normal 120 (8 Lh-1) 1.061 2.180 0.1 A1 96 (8 Lh-1) + 24 (4 Lh-1) 0.968 1.685 0.2 A2 72 (8 Lh-1) + 48 (4 Lh-1) 0.887 1.313 0.3 A3 48 (8 Lh-1) + 72 (4 Lh-1) 0.779 0.981 0.4 A4 24 (8 Lh-1) + 96 (4 Lh-1) 0.685 0.789 0.5 A5 120 (4 Lh-1) 0.576 0.721 0.1 B1 104 (8 Lh-1) + 16 (2 Lh-1) 0.978 1.712 0.2 B2 88 (8 Lh-1) + 32 (2 Lh-1) 0.882 1.263 0.3 B3 72 (8 Lh-1) + 48 (2 Lh-1) 0.782 0.895 0.4 B4 56 (8 Lh-1) + 64 (2 Lh-1) 0.680 0.576 0.5 B5 40 (8 Lh-1) + 80 (2 Lh-1) 0.573 0.375 0.1 C1 98 (8 Lh-1) + 18 (4 Lh-1) + 4 (2 Lh-1) 0.975 1.705 0.2 C2 76 (8 Lh-1) + 36 (4 Lh-1) + 8 (2 Lh-1) 0.880 1.268 0.3 C3 54 (8 Lh-1) + 54 (4 Lh-1) + 12 (2 Lh-1) 0.784 0.950 0.4 C4 32 (8 Lh-1) + 72 (4 Lh-1) + 16 (2 Lh-1) 0.681 0.694 0.5 C5 10 (8 Lh-1) + 90 (4 Lh-1) + 20 (2 Lh-1) 0.582 0.572 0.1 D1 24 (4 Lh-1) + 96 (8 Lh-1) 0.947 2.081 0.2 D2 48 (4 Lh-1) + 72 (8 Lh-1) 0.869 1.906 0.3 D3 72 (4 Lh-1) + 48 (8 Lh-1) 0.777 1.578 0.4 D4 96 (4 Lh-1) + 24 (8 Lh-1) 0.689 1.171 0.5 D5 120 (4 Lh-1) 0.576 0.721 0.1 E1 16 (2 Lh-1) + 104 (8 Lh-1) 0.951 2.094 0.2 E2 32 (2 Lh-1) + 88 (8 Lh-1) 0.848 1.923
0.3 E3 48 (2 Lh
0.4 E4 64 (2 Lh
0.5 E5 80 (2 Lh
* : Fraction of decrease in inlet flow rate caused by clogging problems
Fig. 3 Measured versus estimated values and statistical indices:
Fig. 4 Relative errors between measured and estimated values of
under clogging conditions 0 2 4 6 8 10 12 14 1 2 3 Re la ti v e erro r o f fl o w ra te (% ) Clogging condition A B C D a Lh-1) + 72 (8 Lh-1) 0.751 64 (2 Lh-1) + 56 (8 Lh-1) 0.653 80 (2 Lh-1) + 40 (8 Lh-1) 0.561 : Fraction of decrease in inlet flow rate caused by clogging problems
versus estimated values and statistical indices: (a) head loss and (b) flow rate
errors between measured and estimated values of (a) lateral flow rate and
4 5 Clogging condition E 0 2 4 6 8 10 12 14 1 2 3 Re la ti v e erro r o f h ea d l o ss (% ) Clogging condition A B C D b 0.751 1.685 0.653 1.376 0.561 1.061 flow rate
lateral flow rate and (b) total head loss,
4 5
Clogging condition E
Fig. 5 Estimated and measured values of total head loss under 25 conditions of clogging
Based on Fig. 5 and assuming that clogging rates are randomly distributed along a lateral, predicting clogging based on head loss measurements seems to be quite inaccurate in field conditions. For instance, if head loss is 1.5 m, Fig. 5 indicates a corresponding level of clogging varying from 0.15 to 0.36. Povoa and Hills (1994) reported that a minimum clogging level of 5% (conditions similar to A, B, and C scenarios) on a single lateral could readily be detected by pressure and head loss measurements. Although head loss does not seem to be the best method to determine the level of clogging, its sensitivity is enough to facilitate approximation of the position of clogging along a lateral of which the flow rate is known.
Relation between clogging condition and flow rate at lateral inlet
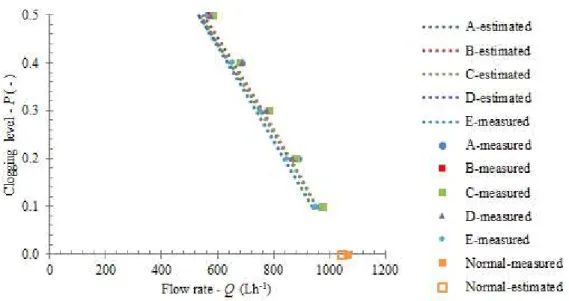
Fig. 6 shows the estimated and measured values of flow rate on each of the 25 clogging conditions. Whatever the clogging position, the coefficients of variation of measured flow rate under each of the clogging levels from 0.1 to 0.5 were less than 2.1%. This demonstrates that under steady pressure at the lateral inlet, the flow rate can be considered as non-affected by the clogging position along the lateral. Finally, measurement of flow rate seems to be an effective method of estimating the level of clogging in a single lateral with steady pressure at the inlet.
In cases of clogging, it was confirmed that the decrease in total flow rate, lowering the head loss, resulted in higher available pressure in the lateral and higher flow rate of non-clogged emitters, thus enhancing the decrease of distribution uniformity (Bralts et al. 1982, Talozi and Hills 2001).
Fig. 6 Estimated and measured values of flow rate under 25 conditions of clogging
Relation between clogging condition and pressure profile along a single lateral
Fig. 7 illustrates from simulations the effects of several levels and positions of clogging on the pressure profile of a lateral. When clogging increases from the lateral end (condition B), the pressure head presents a steep drop in the beginning of the lateral flattening towards lateral downstream. The higher the clogging level, the shorter the steep pressure drop region. On the other hand, when clogging increases from the lateral inlet (condition E), pressure head decreases along most of the lateral, flattening near the lateral end. In initial stages of such clogging, the pressure profile remains quite similar to the profile observed in the lateral free of clogging. Whatever the clogging situation, most head loss occurs up to the first half of the lateral (i.e. where the water velocity is higher). Consequently a pressure sensor could be installed at the middle of the lateral rather than at the end in order to shorten the pressure conveying tube.
Fig. 7 The effect of level and position of clogging on pressure profile (dotted lines represent clogging
increasing from the lateral inlet towards the lateral end - condition E; solid lines represent the same clogging levels increasing from the lateral end to the lateral inlet - condition B)
Assessment of clogging prediction based on head loss and flow rate measurement
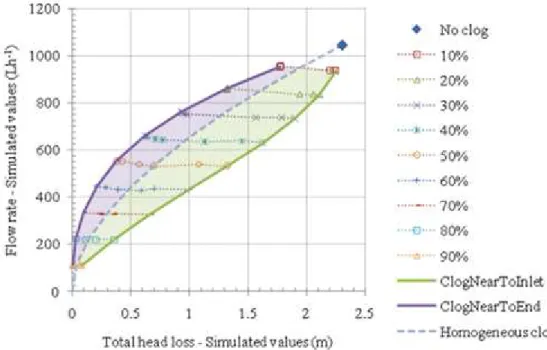
One of the first challenges in predicting clogging problems along a microirrigation lateral consists of deciding which hydraulic parameters must be measured in order to properly estimate levels of clogging at a reasonable cost. Povoa and Hills (1994) and Talozi and Hills (2001) encourage the use of pressure sensors placed at specific points of the microirrigation system. Our simulations clearly show that the knowledge of flow rate and head loss (or at least pressure at the lateral end if inlet pressure is regulated) enables approximation of the level and location of clogging in a lateral. Flow rate is practically unaffected by the clogging position along the lateral (Fig. 6), but is highly sensitive to the level of clogging; hence flow rate measurement can be recommended to indicate the level of clogging. On the other hand, head loss is not sufficient to determine the level of clogging, but is sensitive to the position of clogging along a lateral. Furthermore, for a given lateral setup it is possible to draw a chart relating flow rate and head loss for various levels and positions of clogging (Fig. 8). Assuming that measurements of head loss and flow rate are available, this diagram enables estimation of the level and location of clogging which is useful in planning maintenance routines.
Pressure measurements have the advantages of being non-intrusive, exempt from mechanical parts, robust, and cheap. However, the measurement of head loss requires an additional tube to convey pressure from the lateral end (or around its middle) to the inlet. If inlet pressure is regulated, a simple end (or middle) pressure sensor may suffice. Flow rate measurements are a little more complicated to operate if we seek a low-cost field solution. Water meters could be used but they are sensitive to clogging because of their mechanical parts. Although differential pressure-flow meters interfere with the flow, inducing pressure loss, they may be an interesting alternative since these kinds of device are mechanically simple, robust and low-cost and may be operated with pressure sensors in order to provide automated methods of gathering data.
Fig. 8 Chart for estimating level and position of clogging on a single lateral based on flow rate and head loss
CONCLUSIONS
A methodology for simulating clogging and the corresponding effects on lateral hydraulics was developed and validated, based on experimental data and statistical indices. This work highlights that monitoring of lateral clogging can be achieved by measurement of just two hydraulic parameters: flow rate and head loss along the lateral (or pressure at the end of the lateral if the inlet pressure is regulated). Flow rate enables estimation of the level of clogging, whereas head loss facilitates approximation of the location of clogging in a lateral. This protocol for monitoring clogging may be especially useful for subsurface irrigation systems, but requires field experiments to prove its feasibility.
The methodology for simulating clogging is especially sensitive to the internal diameter of the pipe and local head loss caused by the insertion of emitters along the lateral, therefore the input values of both parameters must be accurate. Changes in local head loss due to clogging agents developing around the insertion of on-line emitters or attaching to the wall of in-on-line emitters remains an unaddressed problem in this study. An open-source web application based on the described methodology is available at https://github.com/apcpires/cloggingLateral and may be used or improved on for aiding simulations of clogging.
The results and conclusions presented in this work are valid for non-regulated drippers and laterals with constant inlet pressure. For pressure-compensating drippers the problem is more complicated because clogging may result in either increase or decrease in flow rate.
ACKNOWLEDGMENTS
The authors are grateful to John Deere Water for supplying the drippers used in this research, as well as the following institutions for their financial support: Institut national de recherche en sciences et technologies pour l'environnement et l'agriculture (IRSTEA, France), Instituto Nacional de Ciência e Tecnologia - Engenharia da Irrigação (INCT-EI, Brazil), Escola Superior de Agricultura Luiz de Queiroz (ESALQ/USP, Brazil), in the framework of the Brazil-France cooperation program ARCUS II.
REFERENCES
Adin A, Alon G (1986) Mechanisms and process parameters of filter screens. J Irrig Drain Eng 112 (4): 293-304
Adin A, Sacks M (1991) Dripper‐clogging factors in wastewater irrigation. J Irrig Drain Eng 117 (6): 813‐827
Allen RG (1996) Relating the Hazen–Williams and Darcy–Weisbach friction loss equations for pressurised irrigation. Appl Eng Agric 12 (6): 685-693
Bagarello V, Ferro V, Provenzano G, Pumo D (1995) Experimental study on flow-resistance law for small-diameter plastic pipes. J Irrig Drain Eng 121 (5): 313-316
Bagarello V, Ferro V, Provenzano G, Pumo D (1997) Evaluating pressure losses in drip irrigation lines. J Irrig Drain Eng 123 (1): 1-7
Bounoua S (2010) Etude du colmatage des systèmes d’irrigation localisée (Investigation of localised irrigation system clogging), PhD Thesis, University of Marseille.
Bralts VF, Wu I, Gitlin HM (1981) Drip irrigation uniformity considering emitter plugging. Trans ASABE 24 (5): 1234-1240
Bralts VF, Wu I, Gitlin HM (1982) Emitter plugging and drip irrigation lateral line hydraulics. Trans ASABE 25 (5): 1274-1281
Camargo AP, Sentelhas PC (1997) Avaliação do desempenho de diferentes métodos de estimativa da evapotranspiração potencial no estado de São Paulo. Rev Bras Agrometeorol 5 (1): 89-97
Capra A, Scicolone B (1998) Water quality and distribution uniformity in drip/trickle irrigation systems. J Agric Eng Res 70 (4): 355-365
Demir V, Yurdem H, Degirmencioglu A (2007) Development of prediction models for friction losses in drip irrigation laterals equipped with integrated in-line and on-line emitters using dimensional analysis. Biosyst Eng 96 (4): 617-631
Duran-Ros M, Puig-Burgués J, Arbat G, Barragán J, Cartagena FR (2009) Effect of filter, emitter and location on clogging when using effluents. Agric Water Manag 96 (1): 67-79
ISO 9261 (2004) Agricultural irrigation equipment - Emitters and emitting pipe - Specification and test methods. 16 p
Lamm FR, Camp CR (2007) Subsurface drip irrigation. In: Lamm FR, Ayars JE, Nakayama FS (ed) Microirrigation for crop production, Elsevier, chap. 13, p. 473-551
Li Y, Yang P, Xu T, et al (2008) CFD and digital particle tracking to assess flow characteristics in the labyrinth flow path of a drip irrigation emitter. Irrig Sci 26 (5): 427-438
Liu H, Huang G (2009) Laboratory experiment on drip emitter clogging with fresh water and treated sewage effluent. Agric Water Manag 96 (5): 745-756
Nakayama FS, Bucks DA (1981) Emitter clogging effects on trickle irrigation uniformity. Trans ASABE 24 (1): 77-80
Nakayama FS, Bucks DA (1991) Water quality in drip/trickle irrigation: A review. Irrig Sci 12 (4): 187-192 Niu W, Liu L, Chen X (2012) Influence of fine particle size and concentration on the clogging of labyrinth emitters. Irrig Sci. doi: 10.1007/s00271-012-0328-2
Pinto MF, Camargo AP, Almeida ACS, Alves DG, Botrel TA (2011) Desenvolvimento de um sistema para o controle do pH da água para microirrigação. Rev Bras Eng Agric Ambient 15 (2): 211-217
Povoa AF, Hills DJ (1994) Sensitivity of microirrigation system pressure to emitter plugging and lateral line perforations. Trans ASAE 37 (3): 793-799
Puig-Bargués J, Lamm FR, Trooien TP, Clark GA (2010) Effect of dripline flushing on subsurface drip irrigation systems. Trans ASABE 53 (1): 147-155
Qingsong W, Shi Y, Dong W, et al. (2006) Study on hydraulic performance of drip emitters by computational fluid dynamics. Agric Water Manag 84 (1): 130-136
Rettore Neto O, Miranda JH, Frizzone JA, Workman SR (2009) Local head loss of non-coaxial emmiters inserted in polyethylene pipe. Trans ASABE 52 (3): 729-738
Romeo E, Royo C, Monzón A (2002) Improved explicit equation for estimation of the friction factor in rouge and smooth pipes. Chem Eng J 86 (3): 369-374
Talozi SA, Hills DJ (2001) Simulating emitter clogging in a microirrigation subunit. Trans ASABE 44 (6): 1503-1509
Willmott CJ, Ackleson SG, Davis RE, et al (1985) Statistics for the evaluation and comparison of models. J Geophys Res 90 (C5): 8995-9005
Yildirim G (2009) Simplified procedure for hydraulic design of small-diameter plastic pipes. Irrig and Drain 58 (2): 209-233
Yildirim G (2010) Total energy loss assessment for trickle lateral lines equipped with integrated in-line and on-line emitters. Irrig Sci 28 (4): 341-352
Zhang J, Zhao W, Tang Y, Lu B (2011) Structural optimization of labyrinth-channel emitters based on hydraulic and anti-clogging performances. Irrig Sci 29 (5): 351-357