The human telomerase RNA gene (hTERC) is regulated during
carcinogenesis but is not dependent on DNA methylation
Isabelle Guilleret
1,*, Pu Yan
1,*, Louis Guillou
1,
Richard Braunschweig
1, Jean-Michel Coindre
2and
Jean Benhattar
1,31Institut de Pathologie, Centre Hospitalier Universitaire Vaudois, CH-1011
Lausanne, Switzerland and2Institut Bergonie´, 33076 Bordeaux, France 3To whom correspondence should be addressed
Email: [email protected]
Telomerase, the ribonucleoprotein complex involved in
telomere maintenance, is composed of two main
compon-ents: hTERT and hTERC. hTERT seems to be the
rate-limiting factor for telomerase activity, although
hTERC expression was also shown to correlate to a certain
extent with telomerase reactivation. To determine whether
the absence of hTERC expression could be the consequence
of DNA methylation, we quantified hTERC RNA in 60
human samples (19 telomerase-negative normal tissues,
nine telomerase-positive and 22 telomerase-negative tumor
tissues, eight telomerase-positive and two
telomerase-nega-tive cell lines) using a quantitatelomerase-nega-tive dot blot on RT–PCR
products. Most of the normal tissues did not express hTERC
whereas, in positive cell lines and in
telomerase-positive tumor tissues, a strong up-regulation was observed,
suggesting that hTERC transcription is up-regulated during
tumorigenesis. The two telomerase-negative cell lines did
not express hTERC. In a series of 22 telomerase-negative
soft tissue sarcomas (STS), half did not express hTERC at
all, or only weakly, whereas a wide range of expression
was observed in the other half. As methylation might be
involved in hTERC silencing, we examined the methylation
pattern in all samples by direct sequencing and
methyl-ation-specific single stand conformation analysis after
bisulfite modification. hTERC methylation was never
observed, neither in normal nor in tumor tissues.
Further-more, there was no correlation between hTERC expression
and proliferation, telomere length or hTERT expression
in telomerase-negative STS. In contrast, three of eight
positive cell lines and the two
telomerase-negative cell lines were found to be hypermethylated,
suggesting that the methylation observed may occur during
cell line establishment. In conclusion, this study shows that
hTERC expression is indeed regulated during
carcino-genesis, but this regulation is unlikely to depend on hTERC
methylation, cell proliferation rate, telomere length or
hTERT expression.
Introduction
Human telomeres are nucleoprotein complexes located at the
extremity of linear chromosomes (1). They are considered to
play a key role in controlling the mitotic clock, via their length
Abbreviations: ALT, alternative lengthening of telomeres; MS-SSCA,
methyl-ation-specific single stand conformation analysis; STS, soft tissue sarcomas. *These authors contributed equally to this work.
(2). In normal human somatic cells, they shorten at each cell
division. In contrast, their length is maintained in most tumor
cells by the action of a ribonucleoproteic enzyme called
telomerase (3). The telomerase large complex consists of many
components, among which two seem to be essential for the
activity in vivo and in vitro: the first, hTERT protein, shows
reverse transcriptase activity (4); the second, hTERC, is the
RNA matrix used to elongate telomeres. Because of their
potential role in tumorigenesis, these components have been
extensively studied. In vitro, hTERT and hTERC have been
shown to form the minimal complex required for telomerase
activity (5). More recently, hTERT gene expression was shown
to correlate closely with telomerase activity in vitro and in vivo,
and thus was thought to be a crucial determinant for telomerase
activity (6,7).
The hTERC gene was identified a few years ago (8). Since
most RT–PCR-based experiments showed that this RNA was
widely expressed in both tumoral and non-tumoral tissues
(9,10), it was concluded that hTERC was not essential to
telomerase reactivation. However, the examination of a series
of tumors using in situ hybridization revealed an up-regulation
of hTERC expression in tumor tissues (11,12). Weak expression
was also occasionally detected in some normal tissues, namely
gastric, esophageal and prostate epithelial basal layers, and
activated lymphocytes (12–14). In a previous study, we
demon-strated that hTERC expression was closely linked to telomerase
activity in colorectal carcinogenesis (15) suggesting that this
gene could play a role during the process of telomerase
re-activation. Based on these observations, we thought it would
be interesting to see if hTERC regulation could be a
tumor-specific phenomenon. Characterization of the human TR gene
revealed that several sites might be involved in its regulation
(8). In a recent report, Zhao et al. (16) showed that the hTERC
gene may be activated by the transcription complex NF-Y, also
by transcription factors such as Sp1 and pRB (Retinoblastoma
protein), and may be repressed by Sp3. Furthermore, the
presence of a large CpG island within the hTERC gene suggests
that methylation could be implicated in hTERC regulation as
well. Recently, a strong correlation between hTERC promoter
methylation and lack of hTERC expression was observed
exclusively in telomerase-negative cell lines (17). Therefore,
it is possible that hTERC methylation results in hTERC
silencing in at least a subset of telomerase-negative tumors.
Immortalized telomerase-negative tumors are malignant
cells, which use a telomerase-independent mechanism (18). A
subset of this tumor category, using the ALT mechanism
(alternative lengthening of telomeres) (19) has been shown
to exhibit ultra-long, heterogeneously sized telomeres and
characteristic multiprotein structures (20). Recent studies
sug-gested that the length of telomeres in ALT cells might be
obtained by homologous recombination and copies switching
between telomeric tracts (21,22). Soft tissue sarcomas (STS)
constitute a large and heterogeneous group of malignant
mesenchymal tumors. About half of them do not express
by guest on November 24, 2016
http://carcin.oxfordjournals.org/
telomerase (23,24). These telomerase-negative STS might
constitute an appropriate material for studying the regulation
of hTERC expression.
In the present study, we examined hTERC expression and
hTERC methylation in a series of human normal tissues,
non-soft tissue tumors, and tumor cell lines, as well as in a series
of telomerase-negative STS. We observed strong variations of
hTERC expression according to the cell type studied. In
addition, the analysis of methylation patterns showed that the
hTERC gene is unlikely to be regulated by methylation-based
mechanisms in telomerase-negative normal tissues and in
tumor tissues. The few partial methylation patterns observed
in telomerase-positive cell lines could represent a side effect
of cell culture.
Materials and methods
Tissue samplesNormal and tumor tissues were obtained from the Frozen Tissue Bank of the University Institute of Pathology of Lausanne. Nineteen human normal tissue samples (bladder, brain, breast, colon, heart, liver, muscle, placenta and prostate) and nine telomerase-positive human tumor tissues (bladder/invasive transitional carcinoma G3, non-invasive transitional carcinoma G2, invasive transitional carcinoma G3; breast/invasive ductal carcinoma G2; colon/ invas-ive adenocarcinoma moderately differentiated G2, invasinvas-ive adenocarcinoma poorly differentiated G3, invasive adenocarcinoma moderately differentiated G2; kidney/non papillomary conventional clear cell sarcomatoid invasive carcinoma G4; and lung/invasive adenocarcinoma moderately differentiated G2) were examined in this study. Twenty-two telomerase-negative STS examined previously by TRAP assay, hTERT expression, Mib-1 expression, and telomere lengths (25) were also analyzed. All samples were carefully checked by experienced pathologists (L.Guillou and R.Braunschweig) and contained at least 70% of tumor cells.
Tumor cell lines
Ten human tumor cell lines (breast, MCF-7; cervix, A431, HeLa; colon, Co115, SW480; lung, H520, SW2; prostate, PC-3; osteosarcoma, Saos-2, U-2 os) were also studied. With few exceptions (SW480, SW2 and Co115, from the Swiss Institute for Cancer Research, ISREC, Lausanne, Switzerland), these cells were obtained from the American Type Culture Collection. Cells were routinely cultured in Dulbecco’s modified medium with glutamax-1 supplemented with 10% fetal bovine serum (5% for Saos-2 and U-2 os), or Leibovitz medium (L15) with 5% FBS and 0.2% NaHCO3 for SW480 (all
products from Gibco BRL, Paisley, UK). All cells lines were tested and found to be negative for Mycoplasma contamination.
DNA and RNA extraction and TRAP assay
DNA, RNA and proteins were extracted from consecutive tissue sections. To establish the methylation status of hTERC promoter and exon, genomic DNA was isolated using the DNeasy tissue kit (Qiagen, Germany) according to the manufacturer’s protocol. Total RNA was extracted from frozen tissue sections or cells using Trizol (Life Technologies, Rockville, MD). RT–PCR on hTERT RNA was performed as described previously (23). TRAP assay was performed according to the modified protocol described by Yan et al. (23).
Analysis of hTERC expression by RT–PCR and quantitative dot blot
Total RNA (2.5 µg) was first digested by DNase I (Roche Diagnostics, Mannheim, Germany) according to the manufacturer’s protocol. RNA was purified by phenol–chloroform extraction followed by ethanol precipitation. cDNA was obtained using pd(N)6 random primer (Amersham, Freiburg, Germany) and Expand Reverse Transcriptase (Roche Diagnostics) as per manufacturer’s protocol. PCR on hTERC cDNA was performed by using the primer set 5⬘-CGCCGTGCTTTTGCTCC-3⬘ and 5⬘-ACTCGCTCCGTTCCT-CTTCC-3⬘, in a final 5% DMSO, and the following PCR conditions: 23 cycles of 94°C for 30 s, 62°C for 45 s and 72°C for 45 s, followed by 10 min at 72°C on a Primus (MWG-Biotech) apparatus. cDNA quality was checked by PCR amplification of p53 and GAPDH cDNA (23). Calibration scales were realized by mixing total RNA from an hTERC positive cell line (HeLa) with total RNA from a negative sample (U-2 os) in 100 ng final. Percentages used were: 100, 50, 25, 10, 2.5, 1, 0.25 and 0%. Then, RT–PCR was realized in the conditions described above. All tissue samples and calibration scales were amplified together in the same PCR reactions. A DIG-labeled probe was produced by re-amplification of an hTERC positive RT–PCR, in a PCR including dUTP-DIG.
For quantitative dot blot, RT–PCR products were denatured 10 min at
100°C and put immediately on ice. Two microliters of each product were loaded on Eletran®N⫹ nylon membrane (BDH Laboratory Supplies, Poole,
UK) and fixed under UV. The membrane was pre-hybridized in a 5⫻ SSC/ 2⫻ blocking/0.02% SDS/0.1% N-lauroyl/50% formamide for 1 h at 42°C. Hybridization with the DIG-labeled probe (100 ng in 3 ml) was done for 2 h at 42°C. The membrane was then washed twice in 2⫻ SSC/0.1% SDS for 5 min at room temperature, and twice in 0.2⫻ SSC/0.1% SDS for 15 min at 68°C. After 2 min incubation in maleate buffer pH 7.5/Tween® 20, and 30 min in maleate buffer pH 7.5/1⫻ blocking, the antibody anti-DIG (Roche Diagnostics) was added. The chemiluminescence reaction was performed after three washes with maleate buffer pH 7.5/Tween®20, and one wash in 100
mM Tris pH 9.5/100 mM NaCl. Detection was realized with CDP-Star⫹ ready-to-use (Roche Diagnostics) according to the manufacturer’s protocol. Signals were analyzed from X-omat film (Eastman Kodak Company, Rochester, NY) after different times of exposure, by comparing intensities with the internal calibration scale.
hTERC methylation analysis by MS-SSCA and sequencing after bisulfite modification
In order to differentiate methylated from unmethylated cytosine, genomic DNA was modified by sodium bisulfite using a protocol adapted from Raizis
et al. (26) and Bian et al. (27). Two microliters of DNA in 36µl of water
were cleaved by 4µl of 1 N HCl for 2 min exactly at room temperature. Then, 4.5µl of 3 M NaOH was added and DNA denaturation was performed for 20 min at 37°C. Sodium bisulfite (500µl) and hydroxyquinone (28 µl) were then added to a final concentration of 40.5% and 10 mM, respectively. The reaction was performed overnight at 55°C. After addition of 80µl of water and 365 µ1 of pure ethanol, DNA was purified using the DNeasy tissue kit columns (Qiagen). Following washing with the kit wash buffer, desulfonation was performed on the column by addition of 500µl of 0.15 M NaOH I 90% EtOH. Incubation was performed for 10 min at room temperature and in the dark. After washing, the modified DNA was eluted from the column with 50µl of 10 mM of Tris–HCl pH 8.0.
Two sets of primers were used for PCR on hTERC, one for the promoter region: 5⬘-GGAAATGGAATTTTAATTTTT-3⬘ and 5⬘-AACCAACAACTAA-CATTTTTT-3⬘, and one for the exon region: 5⬘-TAAATAAAAAATGTTAGT-TGT-3⬘ and 5⬘-ACCTAAAAAACCTAAACC-3⬘. PCR conditions used to amplify hTERC promoter were 40 cycles of 94°C for 45 s, 51°C for 45 s and 72°C for 75 s, followed by 15 min at 72°C. The same PCR cycling conditions in a final concentration of 5% DMSO and an annealing temperature of 48°C were used for hTERC exon. Sequencing of all PCR products was done on an ABI prism 310 sequencer (Perkin-Elmer, Branchburg, NJ). Each PCR product was analyzed by methylation-specific single stand conformation analysis (MS-SSCA) as described previously (27).
Control plasmid was generated by subcloning 672 bp, bases –212 to ⫹459 bp of the hTERC gene (GenBank accession no. U86046), in the pGEM-T vector (Promega, Madison, WI). The plasmid was divided in two parts: one was left unmethylated and the other was fully methylated at all CpG sites using SssI methylase (New England Biolabs, Hertfordshire, UK) according to the manufacturer’s protocol. Unmethylated and methylated plasmids were mixed at different ratios. The bisulfite modification was performed on fully methylated and unmethylated plasmids, as well as on different mixes.
5-aza-dC treatment
Cells were immediately treated after seeding in standard conditions, with 3µM of 5-aza-dC every 48 h for 1 week. The cells were then collected for DNA and RNA extraction.
Results
hTERC expression and methylation in tumor cell lines and in
normal and human tumor tissues
Telomerase-positive cell lines expressed hTERC RNA at a
very high level, with marked variations from one cell line to
another (from 50 to 385%, Table I), as compared with our
reference set (HeLa cells, 100%). In contrast, no hTERC RNA
could be detected in the telomerase-negative cell lines, U-2 os
and Saos-2. Tumors from various organs showed a wide range
of hTERC expression (from 10 to 69%, Table I). Finally,
hTERC RNA expression could not be detected in 68%
(13/19) of normal tissues with our RT–PCR and dot blotting
assay. In contrast, five normal samples showed a low level of
transcription and one sample presented a 6.5% relative hTERC
by guest on November 24, 2016
http://carcin.oxfordjournals.org/
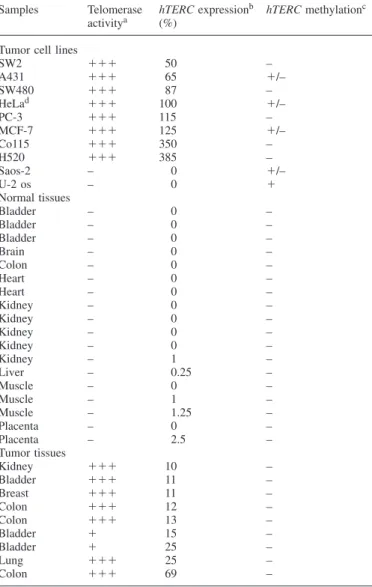
Table I. hTERC expression and methylation in tumor cell lines, normal
tissue and tumor samples
Samples Telomerase hTERC expressionb hTERC methylationc
activitya (%)
Tumor cell lines
SW2 ⫹⫹⫹ 50 – A431 ⫹⫹⫹ 65 ⫹/– SW480 ⫹⫹⫹ 87 – HeLad ⫹⫹⫹ 100 ⫹/– PC-3 ⫹⫹⫹ 115 – MCF-7 ⫹⫹⫹ 125 ⫹/– Co115 ⫹⫹⫹ 350 – H520 ⫹⫹⫹ 385 – Saos-2 – 0 ⫹/– U-2 os – 0 ⫹ Normal tissues Bladder – 0 – Bladder – 0 – Bladder – 0 – Brain – 0 – Colon – 0 – Heart – 0 – Heart – 0 – Kidney – 0 – Kidney – 0 – Kidney – 0 – Kidney – 0 – Kidney – 1 – Liver – 0.25 – Muscle – 0 – Muscle – 1 – Muscle – 1.25 – Placenta – 0 – Placenta – 2.5 – Tumor tissues Kidney ⫹⫹⫹ 10 – Bladder ⫹⫹⫹ 11 – Breast ⫹⫹⫹ 11 – Colon ⫹⫹⫹ 12 – Colon ⫹⫹⫹ 13 – Bladder ⫹ 15 – Bladder ⫹ 25 – Lung ⫹⫹⫹ 25 – Colon ⫹⫹⫹ 69 –
aTelomerase activity by TRAP assay:⫹⫹⫹, marked activity; ⫹, low
activity; –, no activity.
bAs determined by quantitative dot blot of RT–PCR products. 100% control
determined in HeLa cells.
cAs determined by direct sequencing and MS-SSCA.⫹, methylated
pattern ; –, unmethylated pattern ;⫹/–, mixture of methylated and unmethylated patterns.
d100% control of hTERC expression.
expression (Table I). When comparing telomerase-negative
normal tissues to telomerase-positive tumor tissues, hTERC
expression ratios were markedly different.
In order to determine the putative origin of these variations
in hTERC expression, we examined the methylation status of
the hTERC promoter and exon. Bisulfite modification of DNA
changes all unmethylated cytosines to uracils while leaving
methylated cytosines intact. The modified DNA was then
amplified with primers without CpG repeats and directly
sequenced. To determine the clonal nature of the methylated
pattern, each PCR product was also analyzed by MS-SSCA.
This approach can identify patterns of band mobility
corres-ponding to the presence or absence of methylated CpG sites.
All tumors and normal tissues were found to be hypomethylated
by sequencing and MS-SSCA in their promoter and exon
Fig. 1. Telomerase activity, hTERC expression and methylation patterns of hTERC promoter in human tissues and tumor cell lines. Lanes 0 and 100%,
MS-SSCA controls obtained from plasmids containing hTERC sequences; lane 0%, MS-SSCA from unmethylated plasmid; lane 100%, MS-SSCA from a fully methylated plasmid; lanes 1–3, normal tissues without telomerase activity from bladder, muscle and prostate respectively; lanes 4–6, telomerase-positive tumor tissues (colon, kidney and lung); lanes 7–10, telomerase-negative STS; lanes 11–13, telomerase-positive cell lines (A431, HeLa and SW2); lanes 14 and 15, osteosarcoma cell line without telomerase activity (Saos-2 and U-2 os, respectively). Telomerase activity, as obtained by the TRAP assay, was reported in the top of the gel:⫹, marked activity and –, no activity. hTERC expression was summarized by expression (⫹) or with no expression (–). See Table I for values. Arrows in the MS-SSCA of the hTERC promoter indicate the fully methylated bands. Identical patterns were obtained in hTERC exon.
regions (Figure 1, lanes 1–6). Using MS-SSCA only, three of
the eight telomerase-positive tumors (MCF-7, HeLa and A431)
presented a mixed pattern of fully methylated and fully
unmethylated promoter and exon regions (Figure 1, lanes 11
and 12), but expressed hTERC RNA at a high level (Table I).
The two telomerase-negative and hTERC-negative cell lines
displayed a partially methylated (Saos-2, Figure 1, lane 14) or
a fully methylated pattern (U-2 os, Figure 1, lane 15) for
hTERC promoter as well as for hTERC exon.
As these preliminary results suggest that methylation might
be involved in hTERC repression in telomerase-negative cell
lines, we treated U-2 os with the demethylating reagent
5-aza-dC. The MS-SSCA analysis revealed a clonal fully
demethylated DNA population of ~10%. However, no hTERC
re-expression could be detected by dot blot analysis after
RT–PCR amplification.
hTERC expression and methylation in telomerase-negative soft
tissue sarcomas
Twenty-two telomerase-negative STS were analyzed in this
study. hTERC expression showed wide variations (range from
0 to 186%) (Table II). Interestingly, half of the tumors (11/22)
expressed hTERC at a level similar to that of normal tissues
(between 0 and 6%) (Figure 2), including four of the five
liposarcomas and three of the five leiomyosarcomas examined.
In 41% (9/22) of the telomerase-negative STS, the hTERC
expression level was similar to that observed in the
telomerase-positive tumors (10–70%) (Table II). Only two samples showed
an expression as strong as that of the cell lines (艌70%).
Methylation status was analyzed by MS-SSCA and by
sequen-cing after bisulfite modification in all these telomerase-negative
STS (Figure 1, lanes 7–10). No methylation could be detected
in any of them.
Correlation between hTERC expression and proliferation,
telomere length and hTERT expression, in telomerase-negative
soft tissue sarcomas
Since hTERC regulation might be related to proliferation rate
(14), we tried to correlate its expression with Mib-1 expression
in 20 telomerase-negative STS. This nuclear protein
distingu-ishes between proliferative and non-proliferative cells. Mib-1
expression of
⬍5% was considered as weakly proliferative,
by guest on November 24, 2016
http://carcin.oxfordjournals.org/
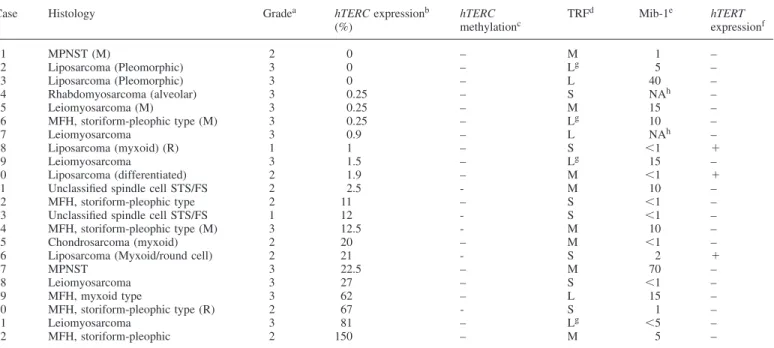
Table II. Expression and methylation of hTERC, TRF, Mib-1 and hTERT expression in telomerase-negative STS
Case Histology Gradea hTERC expressionb hTERC TRFd Mib-1e hTERT
(%) methylationc expressionf 1 MPNST (M) 2 0 – M 1 – 2 Liposarcoma (Pleomorphic) 3 0 – Lg 5 – 3 Liposarcoma (Pleomorphic) 3 0 – L 40 – 4 Rhabdomyosarcoma (alveolar) 3 0.25 – S NAh – 5 Leiomyosarcoma (M) 3 0.25 – M 15 – 6 MFH, storiform-pleophic type (M) 3 0.25 – Lg 10 – 7 Leiomyosarcoma 3 0.9 – L NAh – 8 Liposarcoma (myxoid) (R) 1 1 – S ⬍1 ⫹ 9 Leiomyosarcoma 3 1.5 – Lg 15 – 10 Liposarcoma (differentiated) 2 1.9 – M ⬍1 ⫹
11 Unclassified spindle cell STS/FS 2 2.5 - M 10 –
12 MFH, storiform-pleophic type 2 11 – S ⬍1 –
13 Unclassified spindle cell STS/FS 1 12 - S ⬍1 –
14 MFH, storiform-pleophic type (M) 3 12.5 - M 10 –
15 Chondrosarcoma (myxoid) 2 20 – M ⬍1 –
16 Liposarcoma (Myxoid/round cell) 2 21 - S 2 ⫹
17 MPNST 3 22.5 – M 70 – 18 Leiomyosarcoma 3 27 – S ⬍1 – 19 MFH, myxoid type 3 62 – L 15 – 20 MFH, storiform-pleophic type (R) 2 67 - S 1 – 21 Leiomyosarcoma 3 81 – Lg ⬍5 – 22 MFH, storiform-pleophic 2 150 – M 5 –
aAccording to the FNCLCC grading system.
bAs determined by quantitative dot blot of RT-PCR products. 100% control determined in HeLa cells. cAs determined by direct sequencing and MS-SSCA.
dAs determined by Southern blot. L, long; M, medium; and S, small.
eMib-1 staining has been assessed semi-quantitatively as a proportion of positively stained nuclei for a total of 200–300 nuclei assessed per case. fAs determined by RT-PCR.⫹, Expression; –, no expression.
gExhibiting the elongated and heterogeneous phenotype characteristic of ALT cells. hNA, not available.
Fig. 2. hTERC expression varies according to the cell type. Relative
expression levels of hTERC in various tumor and normal tissues as well as in tumor cell lines were reported according to the cell type. A clear relationship between hTERC expression and the tumor histology can be defined in epithelial telomerase-positive tumors. In contrast, two subgroups could be seen in telomerase-negative STS. The dotted line indicates the 10% of hTERC expression chosen as cut off.
and
艌5%, moderately or highly proliferative (23). The mean
of hTERC expression was found similar in proliferative (10/
20) and non-proliferative (10/20) telomerase-negative STS,
with a relative hTERC expression of 25 and 29%, respectively.
Wide ranges were observed in both categories (Table II).
A previous study revealed that telomere length was
hetero-Table III. Expression of hTERC and hTERT RNA in telomerase-negative
STS
hTERC expression hTERT expression
hTERT⫹ hTERT –
hTERC⫹ 3 16
hTERC – 0 3
Total 3 19
geneous and did not correlate with telomerase activity (25).
In the present report, we tried to correlate hTERC expression
with telomere length in the 22 telomerase-negative STS. TRF
fragments were assessed as short (S), medium (M) or long (L)
when the medium size was situated under 9.6 kb (20% shorter
than mean normal skeletal muscle TRF length), between 9.6
and 14.4 kb, and over 14.4 kb, respectively (25). In our series,
samples were evenly distributed: seven small, eight medium
and seven long. Means of hTERC expressions were 20, 26
and 21% (relative to the 100% in HeLa cells) for short,
medium and long telomeres, respectively.
Finally, we tried to correlate hTERC and hTERT expressions.
As shown in Table III, most telomerase-negative tumors
expressed hTERC but not hTERT (16/22, 73%). Surprisingly,
three cases expressed both genes, without any detectable
telomerase activity. Finally, only three cases (one MPNST and
two pleomorphic liposarcomas) were found that presented no
hTERC nor hTERT expression (Table II).
by guest on November 24, 2016
http://carcin.oxfordjournals.org/
Discussion
Telomerase activity has been shown to depend on at least two
components: the reverse transcriptase, hTERT protein and the
RNA matrix, hTERC. Recent studies identified hTERT as the
rate-limiting factor for telomerase activity. In contrast, little is
known about hTERC regulation and its role in the telomerase
re-activation mechanism is the subject of conflicting results.
These discrepancies raised the following questions: is hTERC
expression up-regulated during tumorigenesis, and which
mechanisms could control this phenomenon?
In order to answer these questions, hTERC expression was
quantified by dot blot after RT–PCR in a series of 60 samples
(Tables I and II). As hTERC gene does not contain any intron,
DNase I digestion was an absolute requirement to avoid a
possible contamination of the results with genomic DNA. This
quantitative PCR and dot blot showed that most normal human
tissues did not express hTERC RNA. Although a few normal
cases revealed weak transcription, the mean of hTERC
expres-sion was at least 30 times less in normal tissues than in
telomerase-positive tumor tissues and 250 times less than in
telomerase-positive tumor cell lines. This strongly suggests
that hTERC gene is strongly up-regulated during tumorigenesis.
A similar ratio in hTERT re-expression (about 24 times) has
been observed between normal renal tissue and sporadic renal
cell carcinoma (28). Thus, it appears that both hTERT and
hTERC seem to be induced or strongly up-regulated during
carcinogenesis. Therefore, as hTERT, hTERC expression can
be considered as a marker of cell transformation. Few studies
have tried to quantify and compare hTERC and hTERT RNAs
in the same tumor tissue sample. In three types of human
cancer (gliomas, hepatocarcinomas and breast carcinomas), a
linear relationship between both RNA types was observed
when hTERT expression reached a certain level of expression.
In in situ carcinoma of the uterine cervix, a linear relationship
between hTERC RNA and hTERT mRNA could be defined
whereas such a correlation was not observed in precancerous
dysplasia of the cervix (29). Therefore, transcriptional levels
of both genes might be cross-regulated when the cancer
becomes established.
hTERC expression was also investigated in
telomerase-negative tumor cell lines and in tumor tissues. hTERC RNA
was not detected in the tumor cell lines, Saos-2 and U-2 os.
In contrast, marked variations (0–150%) of hTERC expression
were observed in the group composed of 22
telomerase-negative STS (Table II). In comparison with the hTERC
levels observed in telomerase-negative normal tissues and in
telomerase-positive tumor tissues, STS samples could be
divided in to two groups: the first group, comprising half the
samples, showed a level of hTERC expression similar to
normal tissue, whereas the other half showed levels similar to
the telomerase-positive tumors (Figure 2). Therefore, hTERC
expression could not be used as a tumor marker in soft
tissue sarcoma.
The presence of a CpG-rich region in the promoter and in
the exon of hTERC led us to hypothesize that it could be one
of the putative hTERC regulatory elements. In a recent study,
Hoare et al. (17) examined the role of methylation in hTERC
transcription. Their results indicated that methylation might
be implicated in telomerase-negative cell lines, but not in
telomerase-negative normal tissues nor in telomerase-positive
tumor tissues. In the present study, using direct sequencing
and MS-SSCA after bisulfite modification of genomic DNA,
identical results were obtained in normal tissue and tumor
samples of various histology and location. MS-SSCA allows
a clonal analysis of DNA population mixture where any clone
⬎5–10% can be easily detected (27). As all tumor samples
contained at least 70% of tumor cells, it is probable that
hTERC methylation is not implicated in hTERC transcription
fluctuations. Interestingly, three of the eight telomerase-positive
cell lines (HeLa, MCF-7 and A431) showed a hypermethylated
pattern by sequencing. Similar results were obtained for HeLa
and MCF-7 (17). In the present study, the use of MS-SSCA
allowed us to demonstrate that one allele was fully methylated
whereas the other one was fully unmethylated, indicating that
one allele is sufficient to induce hTERC gene transcription
(Figure 1).
We next examined hTERC methylation patterns in 22
negative STS. In contrast to the two
telomerase-negative cell lines which were found to be hypermethylated,
hTERC was not methylated in this series of 22 tumors,
suggesting that methylation is not important in the hTERC
regulation mechanism within this interesting group of
telomer-ase-negative tumors.
How can we explain the occurrence of hTERC methylation
in some of the analyzed tumor cell lines? Aberrant methylation
has already been reported in cultured normal fibroblasts (30).
In this particular experiment, growth constraints altered CpG
island methylation, leading to alterations in epigenetic stability.
Furthermore, we observed that treatment with 5-aza-dC of the
telomerase-negative cell line U-2 os did not lead to the
re-expression of the hTERC gene. Thus, the hTERC methylation
detected in the two telomerase-negative cell lines as well
as in the three telomerase-positive cell lines might merely
correspond to a non-specific side effect of cell culture.
Recently, in situ hybridization performed on STS suggested
that telomerase RNA expression may be up-regulated in tumor
cells and may precede morphological transduction (31). In the
present study, a huge range of hTERC expressions were
obtained (from 0 to 186%), indicating that hTERC RNA is
not an appropriate tumoral marker for STS, whereas its use
might be relevant for epithelial tumors. Further studies will
be necessary to investigate this hypothesis. In
telomerase-negative STS, we tried to correlate hTERC expression with
several other parameters, such as the cell proliferation rate as
assessed by Mib-1 staining, telomere length and hTERT
expression in the group of telomerase-negative STS. Our
results indicate that hTERC expression does not correlate with
Mib-1 staining or telomere length. Therefore, other parameters,
which could interfere with hTERC transcription have to be
identified and studied. In a recent report, Zhao et al. (16)
showed that hTERC might be activated by the transcription
complex NF-Y, by the transcription factors Sp1 and pRB
(retinoblastoma) and could be repressed by Sp3. Such
transcrip-tion factors might play a role in the variatranscrip-tions observed in
hTERC transcription. On the other hand, we found that most
telomerase-negative STS did not express hTERT, suggesting
that the lack of telomerase activity probably came from the
lack of hTERT transcription. Along the same lines, we failed
to find a tumor in our series, which expressed hTERT but not
hTERC. Interestingly, three samples lacked expression of both
genes, whereas three others did not show any telomerase
activity in spite of expressing both genes. This latter finding
lends weight to the notion that not only telomerase genes
expression but also post-transcriptional modifications are
required to obtain telomerase activity (32).
by guest on November 24, 2016
http://carcin.oxfordjournals.org/
In summary, the present study shows that the levels of
hTERC expression may vary according to the cell type
exam-ined (normal tissue versus telomerase-positive tumor versus
telomerase-positive tumor cell lines) and are up-regulated
during tumorigenesis. With the exception of
telomerase-nega-tive cell lines, variations in hTERC RNA expression are not
related to a change in the methylation status of the hTERC
gene. In addition, variations in hTERC expression in
telomer-ase-negative STS were not linked to the methylation status,
proliferation rate, telomere length, or hTERT expression.
Acknowledgements
We wish to thank Patricia Martin for technical assistance, and Dr Sophia Taylor for proofreading. This work was funded by a grant from the Swiss National Science Foundation (grant number: 3200-061624.00).
References
1. Blackburn,E.H. (2001) Switching and signaling at the telomere. Cell, 106, 661–673.
2. Campisi,J., Kim,S.H., Lim,C.S. and Rubio,M. (2001) Cellular senescence, cancer and aging: the telomere connection. Exp. Gerontol., 36, 1619–1637. 3. Liu,J.P. (2000) Telomerase: not just black and white, but shades of gray.
Mol. Cell. Biol. Res. Commun., 3, 129–135.
4. Nakamura,T.M., Morin,G.B., Chapman,K.B., Weinrich,S.L., Andrews,W.H., Lingner,J., Harley,C.B. and Cech,T.R. (1997) Telomerase catalytic subunit homologs from fission yeast and human. Science, 277, 955–959.
5. Weinrich,S.L., Pruzan,R., Ma,L. et al. (1997) Reconstitution of human telomerase with the template RNA component hTR and the catalytic protein subunit hTRT. Nature Genet., 17, 498–502.
6. Ramakrishnan,S., Eppenberger,U., Mueller,H., Shinkai,Y. and Narayanan,R. (1998) Expression profile of the putative catalytic subunit of the telomerase gene. Cancer Res., 58, 622–625.
7. Liu,Y., Snow,B.E., Hande,M.P. et al. (2000) The telomerase reverse transcriptase is limiting and necessary for telomerase function in vivo.
Curr. Biol., 10, 1459–1462.
8. Zhao,J.Q., Hoare,S.F., McFarlane,R., Muir,S., Parkinson,E.K., Black,D.M. and Keith,W.N. (1998) Cloning and characterization of human and mouse telomerase RNA gene promoter sequences. Oncogene, 16, 1345–1350. 9. Feng,J., Funk,W.D., Wang,S.S. et al. (1995) The RNA component of
human telomerase. Science, 269, 1236–1241.
10. Yi,X., Shay,J.W. and Wright,W.E. (2001) Quantitation of telomerase components and hTERT mRNA splicing patterns in immortal human cells.
Nucleic Acids Res., 29, 4818–4825.
11. Soder,A.I., Going,J.J., Kaye,S.B. and Keith,W.N. (1998) Tumour specific regulation of telomerase RNA gene expression visualized by in situ hybridization. Oncogene, 16, 979–983.
12. Heine,B., Hummel,M., Demel,G. and Stein,H. (1998). Demonstration of constant upregulation of the telomerase RNA component in human gastric carcinomas using in situ hybridization. J. Pathol., 185, 139–144. 13. Paradis,V., Dargere,D., Laurendeau,I., Benoit,G., Vidaud,M., Jardin,A. and
Bedossa,P. (1999) Expression of the RNA component of human telomerase (hTR) in prostate cancer, prostatic intraepithelial neoplasia and normal prostate tissue. J. Pathol., 189, 213–218.
14. Hiyama,T., Yokozaki,H., Kitadai,Y., Haruma,K., Yasui,W., Kajiyama,G. and Tahara,E. (1999) Overexpression of human telomerase RNA is an early event in oesophageal carcinogenesis. Virchows Arch., 434, 483–487.
15. Yan,P., Saraga,E.P., Bouzourene,H., Bosman,F.T. and Benhattar,J. (2001) Expression of telomerase genes correlates with telomerase activity in human colorectal carcinogenesis. J. Pathol., 193, 21–26.
16. Zhao,J.Q., Glasspool,R.M., Hoare,S.F., Bilsland,A., Szatmari,I. and Keith,W.N. (2000) Activation of telomerase rna gene promoter activity by NF-Y, Sp1 and the retinoblastoma protein and repression by Sp3. Neoplasia,
2, 531–539.
17. Hoare,S.F., Bryce,L.A., Wisman,G.B., Burns,S., Going,J.J., van der Zee,A.G. and Keith,W.N. (2001) Lack of telomerase RNA gene hTERC expression in alternative lengthening of telomeres cells is associated with methylation of the hTERC promoter. Cancer Res., 61, 27–32.
18. Reddel,R.R., Bryan,T.M., Colgin,L.M., Perrem,K.T. and Yeager,T.R. (2001) Alternative lengthening of telomeres in human cells. Radiat. Res., 155, 194–200.
19. Bryan,T.M., Englezou,A., Dalla-Pozza,L., Dunham,M.A. and Reddel,R.R. (1997) Evidence for an alternative mechanism for maintaining telomere length in human tumors and tumor-derived cell lines. Nature Med., 3, 1271–1274.
20. Henson,J.D., Neumann,A.A., Yeager,T.R. and Reddel,R.R. (2002) Alternative lengthening of telomeres in mammalian cells. Oncogene, 21, 598–610.
21. Dunham,M.A., Neumann,A.A., Fasching,C.L. and Reddel,R.R. (2000) Telomere maintenance by recombination in human cells. Nature Genet.,
26, 447–450.
22. Varley,H., Pickett,H.A., Foxon,J.L., Reddel,R.R. and Royle,N.J. (2002) Molecular characterization of inter-telomere and intra-telomere mutations in human ALT cells. Nature Genet., 30, 301–305.
23. Yan,P., Coindre,J.M., Benhattar,J., Bosman,F.T. and Guillou,L. (1999) Telomerase activity and human telomerase reverse transcriptase mRNA expression in soft tissue tumors: correlation with grade, histology and proliferative activity. Cancer Res., 59, 3166–3170.
24. Aogi,K., Woodman,A., Urquidi,V., Mangham,D.C., Tarin,D. and Goodison,S. (2000) Telomerase activity in soft-tissue and bone sarcomas.
Clin. Cancer Res., 12, 4776–4781.
25. Yan,P., Benhattar,J., Coindre,J.M. and Guillou,L. (2002) Telomerase activity and hTERT mRNA expression can be heterogeneous and does not correlate with telomere length in soft tissue sarcoma. Int. J. Cancer, 98, 851–856.
26. Raizis,A.M., Schmitt,F. and Jost,J.P. (1995) A bisulfite method of 5-methylcytosine mapping that minimizes template degradation. Anal.
Biochem., 226, 161–166.
27. Bian,Y.S., Yan,P., Osterheld,M.C., Fontolliet,C. and Benhattar,J. (2001) Promoter methylation analysis on microdissected paraffin-embedded tissues using bisulfite treatment and PCR-SSCP. Biotechniques, 30, 66–72. 28. Paradis,V., Bieche,I., Dargere,D. et al. (2001) hTERT expression in sporadic
renal cell carcinomas. J. Pathol., 195, 209–217.
29. Stanta,G., Bonin,S., Niccolini,B., Raccanelli,A. and Baralle,F. (1999) Catalytic subunit of telomerase expression is related to RNA component expression. FEBS Lett., 460, 285–288.
30. Pieper,R.O., Lester,K.A. and Fanton,C.P. (1999) Confluence-induced alterations in CpG island methylation in cultured normal human fibroblasts.
Nucleic Acids Res., 27, 3229–3235.
31. Yoo,J. and Robinson,R.A. (2000) Expression of telomerase activity and telomerase RNA in human soft tissue sarcomas. Arch. Pathol. Lab. Med.,
124, 393–397.
32. Ulaner,G.A., Hu,J.F., Vu,T.H., Giudice,L.C. and Hoffman,A.R. (2001) Tissue-specific alternate splicing of human telomerase reverse transcriptase (hTERT) influences telomere lengths during human development. Int. J.
Cancer, 91, 644–649.
Received June 24, 2002; revised August 29, 2002; accepted September 2, 2002
by guest on November 24, 2016
http://carcin.oxfordjournals.org/