HAL Id: hal-02547931
https://hal-univ-lyon1.archives-ouvertes.fr/hal-02547931
Submitted on 24 Nov 2020HAL is a multi-disciplinary open access archive for the deposit and dissemination of sci-entific research documents, whether they are pub-lished or not. The documents may come from teaching and research institutions in France or abroad, or from public or private research centers.
L’archive ouverte pluridisciplinaire HAL, est destinée au dépôt et à la diffusion de documents scientifiques de niveau recherche, publiés ou non, émanant des établissements d’enseignement et de recherche français ou étrangers, des laboratoires publics ou privés.
abilities in the maize rhizosphere
Sébastien Renoud, Marie-Lara Bouffaud, Audrey Dubost, Claire
Prigent-Combaret, Laurent Legendre, Yvan Moenne-Loccoz, Daniel Muller
To cite this version:
Sébastien Renoud, Marie-Lara Bouffaud, Audrey Dubost, Claire Prigent-Combaret, Laurent Leg-endre, et al.. Co-occurrence of rhizobacteria with nitrogen fixation and/or 1-aminocyclopropane-1-carboxylate deamination abilities in the maize rhizosphere. FEMS Microbiology Ecology, Wiley-Blackwell, 2020, 96 (5), �10.1093/femsec/fiaa062�. �hal-02547931�
For Peer Review
http://mc.manuscriptcentral.com/fems
Co-occurrence of rhizobacteria with nitrogen fixation and/or 1-aminocyclopropane-1-carboxylate deamination
abilities in the maize rhizosphere
Journal: FEMS Microbiology Ecology Manuscript ID FEMSEC-20-01-0023.R2 Manuscript Type: Research article
Date Submitted by the Author: n/a
Complete List of Authors: Renoud, Sébastien; Université de Lyon, Université Claude Bernard Lyon 1 UMR5557
Bouffaud, Marie-Lara; Université de Lyon, UMR CNRS 5557 Ecologie Microbienne
Dubost, Audrey; Universite Claude Bernard Lyon 1 Faculte des Sciences et Technologies, UMR 5557 Microbial Ecology Laboratory
Prigent-Combaret, Claire; Université de Lyon, UMR CNRS 5557 Ecologie Microbienne
Legendre, Laurent; Université de Lyon, UMR5557
Moënne-Loccoz, Yvan; Université de Lyon, UMR CNRS 5557 Ecologie Microbienne
Muller, Daniel; Université de Lyon, UMR5557
For Peer Review
395x318mm (72 x 72 DPI) 3 4 5 6 7 8 9 10 11 12 13 14 15 16 17 18 19 20 21 22 23 24 25 26 27 28 29 30 31 32 33 34 35 36 37 38 39 40 41 42 43 44 45 46 47 48 49 50 51 52 53 54 55For Peer Review
1 Co-occurrence of rhizobacteria with nitrogen fixation and/or
1-aminocyclopropane-1-2 carboxylate deamination abilities in the maize rhizosphere
3 4 5
6 Sébastien Renoud1‡, Marie-Lara Bouffaud1‡, Audrey Dubost1, Claire Prigent-Combaret1,
7 Laurent Legendre1,2, Yvan Moënne-Loccoz1 and Daniel Muller1*
8
9 1 Univ Lyon, Université Claude Bernard Lyon 1, CNRS, INRAE, VetAgro Sup, UMR5557
10 Ecologie Microbienne, 43 bd du 11 novembre 1918, F-69622 Villeurbanne, France 11 2 Univ Lyon, Université de St Etienne, F-42000 St Etienne, France
12
13 ‡ Current addresses:
14 S.R. : BGene genetics Bâtiment B Biologie, F-38400 Saint Martin d'Hères, France
15 M.L.B. : Helmholtz Center for Environmental Research UFZ, Theodor-Lieser-Straβe 4, 16 06120 Halle, Germany
17 18
19 Running title: nifH and acdS bacteria on maize
20 21
22 *Corresponding author: UMR CNRS 5557 Ecologie Microbienne, Université Lyon 1, 43 bd
23 du 11 Novembre 1918, 69622 Villeurbanne cedex, France. Phone: +33 4 72 43 27 14. E-mail: 24 daniel.muller@univ-lyon1.fr 25 3 4 5 6 7 8 9 10 11 12 13 14 15 16 17 18 19 20 21 22 23 24 25 26 27 28 29 30 31 32 33 34 35 36 37 38 39 40 41 42 43 44 45 46 47 48 49 50 51 52 53 54 55 56 57 58 59
For Peer Review
26 ABSTRACT
27
28 The plant microbiota may differ depending on soil type, but these microbiota probably share 29 the same functions necessary for holobiont fitness. Thus, we tested the hypothesis that 30 phytostimulatory microbial functional groups are likely to co-occur in the rhizosphere, using 31 groups corresponding to nitrogen fixation (nifH) and 1-aminocyclopropane-1-carboxylate 32 deamination (acdS), i.e. two key modes of action in plant-beneficial rhizobacteria. The analysis 33 of three maize fields in two consecutive years showed that quantitative PCR numbers of nifH 34 and of acdS alleles differed according to field site, but a positive correlation was found overall 35 when comparing nifH and acdS numbers. Metabarcoding analyses in the second year indicated 36 that the diversity level of acdS but not nifH rhizobacteria in the rhizosphere differed across 37 fields. Furthermore, between-class analysis showed that the three sites differed from one 38 another based on nifH or acdS sequence data (or rrs data), and the bacterial genera contributing 39 most to field differentiation were not the same for the three bacterial groups. However, co-40 inertia analysis indicated that the genetic structures of both functional groups and of the whole 41 bacterial community were similar across the three fields. Therefore, results point to co-selection 42 of rhizobacteria harboring nitrogen fixation and/or 1-aminocyclopropane-1-carboxylate 43 deamination abilities.
44
45 Keywords: microbiota; phytostimulation; functional group; functional microbiota; holobiont;
46 ITSNTS theory 47 48 3 4 5 6 7 8 9 10 11 12 13 14 15 16 17 18 19 20 21 22 23 24 25 26 27 28 29 30 31 32 33 34 35 36 37 38 39 40 41 42 43 44 45 46 47 48 49 50 51 52 53 54 55 56 57 58 59
For Peer Review
49 INTRODUCTION
50
51 Plant Growth-Promoting Rhizobacteria (PGPR) colonize plant roots and implement a range of 52 plant-beneficial traits, which may result in enhanced plant development, nutrition, health and/or 53 stress tolerance (Almario et al. 2014; Cormier et al. 2016; Gamalero and Glick 2015; Hartman 54 et al. 2018; Vacheron et al. 2013). As a consequence, PGPR strains have received extensive 55 attention for use as microbial inoculants of crops (Bashan et al. 2014; Couillerot et al. 2013). 56 Plant-beneficial effects exhibited by PGPR are underpinned by a wide range of modes 57 of actions, which include (i) enhanced nutrient availability via associative nitrogen fixation 58 (Puri et al. 2016, Deynze et al. 2018) or phosphate solubilization (Arruda et al. 2013), (ii) 59 stimulation of root system establishment through phytohormone synthesis (Cassán et al. 2014) 60 or consumption of the ethylene precursor 1-aminocyclopropane-1-carboxylate (ACC) via an 61 enzymatic deamination (Glick 2014), and (iii) the induction of systemic resistance responses in 62 plant (Pieterse and Van Wees 2015). In addition to phytostimulation, certain PGPR may also 63 achieve inhibition of phytoparasites using antimicrobial secondary metabolites (Agaras et al. 64 2015) or lytic enzymes (Pieterse and Van Wees 2015). Often, PGPR strains display more than 65 one phytostimulatory mode of action, which is considered important for effective plant-66 beneficial effects (Bashan and de-Bashan 2010; Bruto et al. 2014; Rana et al. 2011; Vacheron 67 et al. 2017). Therefore, the co-occurrence of multiple phytostimulation traits is likely to have 68 been subjected to positive evolutionary selection in PGPR populations to maximize success of 69 the plant-PGPR cooperation. This hypothesis is substantiated by genome sequence analysis of 70 many prominent PGPR strains from contrasted taxa (Bertalan et al. 2009; Chen et al. 2007; 71 Redondo-Nieto et al. 2013; Wisniewski-Dyé et al. 2012).
72 Even though PGPR strains tend to accumulate several plant-beneficial traits (Bruto et 73 al. 2014), the co-occurrence patterns of these traits are not random. This takes place in part
3 4 5 6 7 8 9 10 11 12 13 14 15 16 17 18 19 20 21 22 23 24 25 26 27 28 29 30 31 32 33 34 35 36 37 38 39 40 41 42 43 44 45 46 47 48 49 50 51 52 53 54 55 56 57 58 59
For Peer Review
74 because many past horizontal gene transfers of the corresponding genes were ancient (Frapolli 75 et al. 2012), often leading to clade-specific profiles of plant-beneficial traits (Bruto et al. 2014). 76 However, the analysis of 304 proteobacterial genomes from contrasted taxa evidenced, overall, 77 the co-occurrence of nifHDK (nitrogen fixation) and acdS (ACC deamination) based on Exact-78 Fisher pairwise tests (Bruto et al. 2014), raising the possibility that nitrogen fixation and ACC 79 deamination might be useful traits when combined in a bacterium. Indeed, nitrogen fixation and 80 ACC deamination occur together in various rhizobacteria (Blaha et al. 2006; Duan et al. 2009; 81 Jha et al. 2012; Ma, Guinel, and Glick, 2003; Nukui et al. 2006), but the relation between both 82 traits can be complex. In Azospirillum lipoferum 4B for instance, the plasmid-borne gene acdS
83 is eliminated during phase variation while nif genes are maintained (Prigent-Combaret et al.
84 2008), and in Mesorhizobium loti transcription of acdS is controlled by the nitrogen fixation
85 regulator gene nifA2 (Nukui et al. 2006). Moreover, ACC deamination was described as
86 facilitator of the legume-rhizobia symbiosis (Ma et al. 2003; Nascimento et al. 2012).
87 At the scale of an individual plant, the rhizosphere is colonized by a diversified range 88 of bacteria, including nifH acdS bacteria as well as bacteria harboring only nifH or acdS (Blaha 89 et al. 2006; Bouffaud et al. 2018). There is additional level of complexity in that many of these 90 bacteria are PGPR, but some of them are not (Bruto et al. 2014). However, the overall impact 91 of nitrogen fixation and ACC deamination on the plant is likely to be the sum of the contribution 92 of individual root-colonizing bacteria displaying these traits. This raises the question whether 93 there is, for the plant, an optimal balance between the functional microbial groups of nifH 94 rhizobacteria and acdS rhizobacteria in the rhizosphere. On this basis, we tested here the 95 hypothesis that rhizobacteria with either nitrogen fixation ability or ACC deamination ability 96 (or with both) co-occur on roots. For that purpose, we used three maize fields under reduced 97 nitrogen fertilization practices, with samplings carried out at 6-leaf and flowering stages during 98 two consecutive years, and numbers of nifH and acdS rhizobacteria were monitored by
3 4 5 6 7 8 9 10 11 12 13 14 15 16 17 18 19 20 21 22 23 24 25 26 27 28 29 30 31 32 33 34 35 36 37 38 39 40 41 42 43 44 45 46 47 48 49 50 51 52 53 54 55 56 57 58 59
For Peer Review
99 quantitative PCR. In addition, nifH and acdS rhizobacteria were assessed by metabarcoding 100 (MiSeq Illumina sequencing) of nifH and acdS genes at one sampling, in parallel to sequencing 101 of 16S rRNA genes for the whole rhizobacterial community.
102
103 2. MATERIALS AND METHODS
104
105 2.1. Field experiment
106 The experiment was conducted in 2014 and 2015 at field sites located in Chatonnay (L), 107 Sérézin-de-la-Tour (FC) and Saint Savin (C), near the town of Bourgoin-Jallieu (Isère, France). 108 According to the FAO soil reference base, L field corresponds to a luvisol, FC a fluvic cambisol 109 and C a calcisol (Table 1). The trial set-up has been described in Rozier et al. (2017).
110 For each of the fields, the crop rotation consists in one year wheat, six years maize and 111 one year rapeseed, and wheat was grown the year before the 2014 experiment. The maize 112 sowing season ranges from middle April to middle May in the area. Maize seeds (Zea mays 113 ‘Seiddi’; Dauphinoise Company, France) were sown on April 18 (FC) and 23 (C and L)in 2014 114 andApril 30 (C) and May 11 (FC and L) in 2015. Five replicate plots, which were 12 (FC and 115 C) or 8 (L) maize rows wide and 12 m long, were defined in each field. The fields were 116 undergoing a reduction in chemical fertilization usage and did not receive any nitrogen 117 fertilizers in 2014 and 2015. Only non-inoculated plots from the overall trial (Rozier et al. 2017) 118 were used.
119
120 2.2. Plant sampling
121 In 2014 and 2015, plants were sampled at six leaves and at flowering. In 2014, the first sampling 122 was done on May 25 (FC) and 26 (C and L). On each replicate plot, six plants were chosen 123 randomly, the entire root system was dug up and shaken vigorously to dislodge soil loosely
3 4 5 6 7 8 9 10 11 12 13 14 15 16 17 18 19 20 21 22 23 24 25 26 27 28 29 30 31 32 33 34 35 36 37 38 39 40 41 42 43 44 45 46 47 48 49 50 51 52 53 54 55 56 57 58 59
For Peer Review
124 adhering to the roots. At sites FC and C, one pooled sample of six roots system was obtained 125 per plot, i.e. a total of five pooled samples per field site. At site L, each of the six roots system 126 was treated individually to obtain 30 samples. The second sampling was done on July 8 (FC 127 and C) and 9 (L), on all five plots. Six plants were sampled per plot and treated individually to 128 obtain 30 samples per field site.
129 In 2015, the first sampling was done on May 27 (C), June 5 (FC) and June 8 (L). In each 130 replicate plot, four root systems were sampled and treated individually to obtain 20 samples per 131 field site. The second sampling was done on July 15 (C), 16 (FC) and 17 (L), and four root 132 systems were sampled and treated individually to obtain 20 samples per field site.
133 Each sample was immediately flash-frozen on site, in liquid nitrogen, and lyophilized 134 back at the laboratory (at -50°C for 24 h). Roots and their adhering soil were separated and the 135 latter stored at -80°C.
136
137 2.3. DNA extraction from root-adhering soil
138 DNA from root-adhering soil was extracted with the FastDNA SPIN kit (BIO 101 Inc., 139 Carlsbad, CA). To this end, 500 mg (for the pooled samples from FC and C in 2014) or 300 mg 140 samples (for all other samples) were transferred in Lysing Matrix E tubes from the kit, and 5 µl 141 of the internal standard APA9 (109 copies ml-1) was added to each Lysing Matrix E tube to
142 normalize DNA extraction efficiencies between rhizosphere samples, as described (Park and 143 Crowley, 2005; Couillerot et al. 2010). This internal standard APA9 (i.e. vector pUC19 with 144 cassava virus insert; GenBank accession number AJ427910) requires primers AV1f 145 (CACCATGTCGAAGCGACCAGGAGATATCATC) and AV1r 146 (TTTCGATTTGTGACGTGGACAGTGGGGGC). After 1 h incubation at 4°C, DNA was 147 extracted and eluted in 50 µl of sterile ultra-pure water, according to the manufacturer’s 148 instructions. DNA concentrations were assessed by Picogreen (ThermoFisher).
3 4 5 6 7 8 9 10 11 12 13 14 15 16 17 18 19 20 21 22 23 24 25 26 27 28 29 30 31 32 33 34 35 36 37 38 39 40 41 42 43 44 45 46 47 48 49 50 51 52 53 54 55 56 57 58 59
For Peer Review
149
150 2.4. Size of microbial functional groups
151 The amounts of nifH genes were estimated by quantitative PCR based on the primers polF/polR 152 (Poly, Jocteur Monrozier, and Bally, 2001), as described by Bouffaud et al. (2016). The reaction 153 was carried out in 20 µl containing 4 μl of PCR-grade water, 1 μl of each primer (final 154 concentration 0.50 μM), 10 μl of LightCycler-DNA Master SYBR Green I master mix (Roche 155 Applied Science, Meylan, France) and 2 µl of sample DNA (10 μg). The cycling program 156 included 10 min incubation at 95°C, followed by 50 cycles of 95°C for 15 s, 64°C for 15 s and 157 72°C for 10 s. Melting curve calculation and Tm determination were performed using the Tm 158 Calling Analysis module of Light-Cycler Software v.1.5 (Roche Applied Science).
159 The amount of acdS genes was estimated by quantitative PCR based on the primers 160 acdSF5/acdSR8 (Bouffaud et al. 2018). The reaction was carried out in 20 µl containing 4 μl of 161 PCR grade water, 1 μl of each primer (final concentration 1 μM), 10 μl of LightCycler-DNA 162 Master SYBR Green I master mix (Roche Applied Science) and 2 µl of sample DNA (10 μg). 163 The cycling program included 10 min incubation at 95°C, followed by 50 cycles of 94°C for 164 15 s, 67°C for 15 s and 72°C for 10 s. The fusion program for melting curve analysis is described 165 above.
166 Real-time PCR quantification data were converted to gene copy number per gram of 167 lyophilized root-adhering soil, as described (Bouffaud et al. 2018; Bouffaud et al. 2016). 168
169 2.5. nifH, acdS and rrs sequencing from rhizosphere DNA
170 Sequencing was performed on 2015’ samples taken when maize reached 6 leaves. Each sample 171 was an equimolar composite sample of four DNA extracts obtained from root-adherent soil, 172 resulting in 5 samples per field site, i.e. a total of 15 samples. DNA extracts were sent to MR 173 DNA laboratory (www.mrdnalab.com; Shallowater, TX) for sequencing.
3 4 5 6 7 8 9 10 11 12 13 14 15 16 17 18 19 20 21 22 23 24 25 26 27 28 29 30 31 32 33 34 35 36 37 38 39 40 41 42 43 44 45 46 47 48 49 50 51 52 53 54 55 56 57 58 59
For Peer Review
174 For nifH and acdS sequencing, PCR primers were the same ones used for quantitative 175 PCR (i.e., polF/polR for nifH and acdSF5/acdSR8 for acdS). For rrs sequencing, PCR primers 176 515/806 were chosen for the V4 variable region of the 16S rRNA gene. For all three genes, the 177 forward primer carried a barcode. Primers were used in a 30-cycle PCR (5 cycles implemented 178 on PCR products), using the HotStarTaq Plus Master Mix Kit (Qiagen, Valencia, CA) under 179 the following conditions: 94°C for 3 min, followed by 28 cycles of 94°C for 30 s, 53°C for 40 180 s and 72°C for 1 min, with a final elongation step at 72°C for 5 min. PCR products were checked 181 in 2% agarose gel to determine amplification success and relative band intensity. Multiple 182 samples were pooled together in equal proportions based on their molecular weight and DNA 183 concentrations. Pooled samples were purified using calibrated Ampure XP beads and used to 184 prepare a DNA library following Illumina TruSeq DNA library preparation protocol. 185 Sequencing was performed on a MiSeq following the manufacturer’s guidelines.
186 Sequence data were processed using the analysis pipeline of MR DNA. Briefly, 187 sequences were depleted of barcodes, sequences < 150 bp or with ambiguous base calls 188 removed, the remaining sequences denoised, operational taxonomic units (OTUs; defined at 189 3% divergence threshold for the three genes) generated, and chimeras removed. Final OTUs 190 were taxonomically classified using BLASTn against a curated database derived from 191 Greengenes (DeSantis et al. 2006), RDPII (http://rdp.cme.msu.edu) and NCBI 192 (www.ncbi.nlm.nih.gov). Final OTUs of the acdS sequencing were classified using an in-house 193 curated acdS database, obtained after curation of acdS homolog genes from the FunGene acdS 194 8.3 database, as described by Bouffaud et al. (2018). Diversity indices of Shannon (H) and 195 Simpson (1-D) were calculated using sequencing subsample data for which each sample had 196 the same number of sequences.
197 An acdS phylogenetic tree (based on maximum-likelihood method) was computed using
198 acdS sequences from ten arbitrarily-chosen OTUs per genus recovered in our sequencing data
3 4 5 6 7 8 9 10 11 12 13 14 15 16 17 18 19 20 21 22 23 24 25 26 27 28 29 30 31 32 33 34 35 36 37 38 39 40 41 42 43 44 45 46 47 48 49 50 51 52 53 54 55 56 57 58 59
For Peer Review
199 and from one reference taxa for each genus, and related cystein desulfhydrase genes D-200 cystein desulfhydrase genes from strains Escherichia coli strains K-12, ER3413, 042 and 201 RM9387, Escherichia albertii KF1, Escherichia fergusonii ATCC 35469, Enterobacter
202 sacchari SP1, Enterobacter cloacae ECNIH2, Enterobacter asburiae L1, Enterobacter sp. 638
203 and Enterobacter lignolyticus SCF1 (used as out-group). 204
205 2.6. Statistical analysis
206 Statistical analysis of quantitative PCR data was carried out by ANOVA and Fishers’ LSD tests. 207 For each gene sequenced, comparison of bacterial diversity between field sites was carried out 208 by Between-Class Analysis (BCA) using ADE4 (Chessel et al. 2004; Culhane et al. 2005; Dray, 209 Dufour, and Chessel, 2007) and ggplot2 packages for R, and the 12 genera contributing most 210 to field site differentiation were identified. To assess co-trends between nifH and acdS 211 variables, as well as between rrs and nifH or acdS variables, sequence data were also assessed 212 using co-inertia analysis (CIA) (Dray et al. 2003; Dray et al. 2007), which was computed with 213 the ADE4 package in the R statistical software environment (Culhane et al. 2005). CIA is a 214 dimensional reduction procedure designed to measure the similarity of two sets of variables, 215 here the proportions of nifH and acdS bacterial genera obtained during between-class analyses. 216 Its significance was assessed using Monte-Carlo tests with 10,000 permutations. Unless 217 otherwise stated, statistical analyses were performed using R v3.1.3 (Team, 2014), at P < 0.05 218 level.
219
220 2.7. Nucleotide sequence accession numbers
221 Illumina MiSeq paired-end reads have been deposited in the European Bioinformatics Institute 222 (EBI) database under accession numbers PRJEB14347 (ERP015984) for rrs; PRJEB14346 223 (ERP015983) for nifH, PRJEB14343 (ERP015981) for acdS.
3 4 5 6 7 8 9 10 11 12 13 14 15 16 17 18 19 20 21 22 23 24 25 26 27 28 29 30 31 32 33 34 35 36 37 38 39 40 41 42 43 44 45 46 47 48 49 50 51 52 53 54 55 56 57 58 59
For Peer Review
224
225 3. RESULTS
226
227 3.1. Relation between numbers of nifH and acdS alleles in the three field sites
228 The number of acdS bacteria in the rhizosphere of maize harvested at 6-leaf stage in 2014 (7.87 229 to 17.4 × 10⁷ acdS gene copies g-1 of dry soil) and 2015 (1.76 to 2.81 × 10⁷ acdS gene copies
230 g-1 of dry soil) did not differ significantly between field sites (Figure 1AB). At flowering stage,
231 however, the number of acdS bacteria differed from one site to the next, both in 2014 and in 232 2015 (Figure 1EF). At that growth stage, the lowest rhizosphere abundance was observed in 233 site L (5.08 × 10⁷ acdS gene copies g-1 of dry soil) and the highest in site C (1.76 × 10⁸ acdS
234 gene copies g-1 of dry soil) in 2014, whereas site ranking was the opposite in 2015 (8.35 versus
235 44.0 × 10⁶ acdS gene copies g-1 of dry soil for sites C and L, respectively).
236 The numbers of nifH rhizobacteria differed according to field site (Figure 1CDGH). In 237 2014, the lowest nifH abundance was observed in rhizospheres of site L (1.06 and 20.8 × 10⁷
238 nifH gene copies g-1 of dry soil at respectively six leaves and flowering) and the highest in those
239 of site C (6.43 and 147.0 × 10⁷ nifH gene copies g-1 of dry soil at respectively six leaves and
240 flowering) (Figure 1CG). In 2015, the numbers of nifH rhizobacteria was higher in site C (9.31 241 × 108 nifH gene copies g-1 of dry soil) than in FC (1.30 × 10⁸ nifH gene copies g-1 of dry soil)
242 and L (2.52 × 10⁸ nifH gene copies g-1 of dry soil) at six leaves, whereas the situation was
243 opposite at flowering, with higher abundance in site L (40.7 × 10⁷ nifH gene copies g-1 of dry
244 soil) than C (9.81 × 10⁷ nifH gene copies g-1 of dry soil) and FC (5.66 × 10⁷ nifH gene copies
245 g-1 of dry soil) (Figure 1DH).
246 When comparing the log numbers of nifH rhizobacteria and acdS rhizobacteria across 247 the 12 site × sampling combinations, significant (3.8 × 10⁻⁵ < P < 0.01) positive correlations
248 (0.67 < r < 0.98, n = 20) were found in 9 of 12 cases, with only three correlations that were not
3 4 5 6 7 8 9 10 11 12 13 14 15 16 17 18 19 20 21 22 23 24 25 26 27 28 29 30 31 32 33 34 35 36 37 38 39 40 41 42 43 44 45 46 47 48 49 50 51 52 53 54 55 56 57 58 59
For Peer Review
249 significant, i.e. in site C at 6-leaf stage in 2014 (P = 0.10, n = 5) and FC at flowering in 2014 250 (P = 0.67, n = 5) and 2015 (P = 0.19, n = 20) (Figure 2). In summary, moderate but significant 251 differences in the numbers of nifH and/or acdS rhizobacteria could take place according to field 252 site, sampling year and/or maize phenology, and in most cases a positive correlation was found 253 between the log values of both numbers.
254
255 3.2. Relation between diversities of nifH and acdS alleles in the three field sites
256 Illumina MiSeq sequencing of nifH and acdS (as well as rrs) was carried out on 15 rhizosphere 257 samples from 6-leaf maize grown in 2015. For nifH, 1,342,966 reads were obtained (10,775 to 258 62,752 sequences per sample), for a total of 36,241 OTUs. Rarefaction analysis showed that 259 curves reached a plateau (Figure S1A). Subsampling was done with 10,775 sequences per 260 sample, for a total of 34,459 OTUs. For acdS, 5,490,230 reads were obtained (68,376 to 139,245 261 sequences per sample), with a total of 32,468 OTUs. Rarefaction curves reached a plateau 262 (Figure S1B). Subsampling was done with 68,376 sequences per sample, for a total of 26,246 263 OTUs. After quality filtering, 6,082,255 reads were obtained for rrs (51,696 to 223,926 264 sequences per sample), giving a total of 39,600 OTUs (3% cut-off). Rarefaction analysis 265 showed that the sequencing effort captured most of the diversity with curves reaching a plateau 266 (Figure S1C). Subsampling was done with 51,696 sequences per sample, for a total of 25,437 267 OTUs.
268 The effect of field site on nifH diversity of diazotrophic bacteria was not significant 269 based on analysis of Shannon and Simpson indices. Conversely, the effect of field site on acdS 270 diversity of ACC deaminase bacteria was significant based on the Shannon (P = 1.9. × 10-4)
271 and Simpson indices (P = 8.6 × 10⁻⁴). The Shannon index was lower in FC (6.32) than in L
272 (6.82) and C (6.92), whereas the Simpson index was higher in FC (6.42 × 10⁻³) than in L (2.88
273 × 10-3) and C (2.38 × 10⁻³). The effect of field site on rrs diversity of the total bacterial
3 4 5 6 7 8 9 10 11 12 13 14 15 16 17 18 19 20 21 22 23 24 25 26 27 28 29 30 31 32 33 34 35 36 37 38 39 40 41 42 43 44 45 46 47 48 49 50 51 52 53 54 55 56 57 58 59
For Peer Review
274 community was significant based on the Shannon (P = 1.8 × 10⁻⁵) and Simpson indices (P =1.6
275 × 10-4). As in the case of acdS data, the Shannon index was lower in FC (7.20) than in L (7.41)
276 and C (7.71), whereas the Simpson index was higher in FC (3.42 × 10⁻³) than in L (2.28 × 10
-277 3) and C (1.40 × 10⁻³).
278 The correlation (n = 5) between nifH diversity and acdS diversity was positive and 279 significant at site L, when considering both the Shannon index (r = 0.98 ; P = 0.01; Figure 3) 280 and the Simpson index (r = 0.86 ; P = 0.06; Figure 3). However, the correlation was not 281 significant at the other two sites, regardless of the diversity index. When considering also rrs 282 diversity, a significant correlation was found only with nifH diversity at site C (r = 0.91 ; P = 283 0.03; Figure 3). In summary, there was no relation between the diversities of nifH rhizobacteria 284 and acdS rhizobacteria, based on comparison of diversity indices in the three field sites and 285 correlation analyses at two of the three field sites.
286 3 4 5 6 7 8 9 10 11 12 13 14 15 16 17 18 19 20 21 22 23 24 25 26 27 28 29 30 31 32 33 34 35 36 37 38 39 40 41 42 43 44 45 46 47 48 49 50 51 52 53 54 55 56 57 58 59
For Peer Review
287 3.3. Relation between prevalence of nifH and/or acdS rhizobacterial taxa in the three field
288 sites
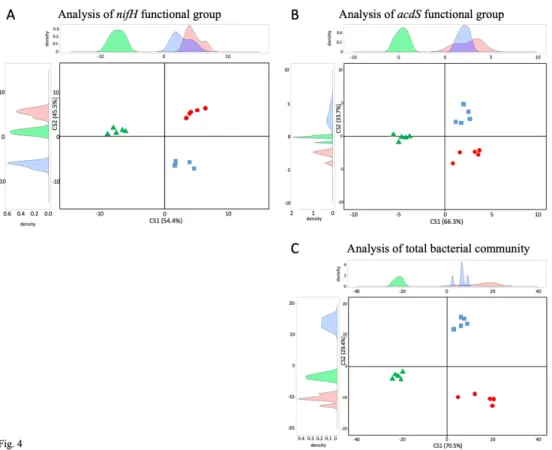
289 Between-class analysis of nifH data showed that the composition of diazotrophic bacteria 290 differed according to field site (Figure 4A). The first axis (54% of between-class variability) 291 distinguished site C from FC and L, and the 12 genera contributing most to this differentiation 292 were Xanthobacter, Dechloromonas, Methyloferula, Ideonella, Nitrospirillum and Tolumonas 293 (more prevalent in C than in L and FC), as well as Desulfovibrio, Selenomonas,
294 Ruminiclostridium, Paludibacter, Gloeocapsopsis and Ruminococcus (less prevalent in C than
295 in FC and L). The second axis (46% of between-class variability) distinguished site L from the 296 two other sites, and the 12 genera contributing most to this differentiation included Rhizobium,
297 Gluconacetobacter, Skermanella, Leptothrix, Streptomyces and Methylocapsa (more prevalent
298 in L than in FC and C), as well as Marichromatium, Pelobacter, Gordonibacter, Desulfobulbus,
299 Desulfovibrio and Sideroxydan (less prevalent in L than in C and FC).
300 Between-class analysis of acdS data showed that the composition of ACC deaminase 301 bacteria differed according to field site (Figure 4B). The first axis (66% of between-class 302 variability) distinguished site C from FC and L, and the 12 genera contributing most to this 303 differentiation were Achromobacter, Azospirillum, Pseudolabrys, Roseovarius, one unassigned 304 OTU and Polaromonas (more prevalent in C than in L and FC), as well as Cupriavidus,
305 Burkholderia, Bosea, Bradyrhizobium and Methylobacterium (less prevalent in C than in FC
306 and L). The second axis (34% of between-class variability) distinguished each of the three sites 307 from one another, and the 12 genera contributing most to this differentiation included
308 Azorhizobium, Pseudomonas, Gluconobacter, Collimonas, Herbaspirillum and Burkholderia
309 (more prevalent in FC than in C and L), as well as Ralstonia, Loktanella, Devosia, Variovorax,
310 Novosphingobium and Chelatococcus (more prevalent in L than in C and FC).
3 4 5 6 7 8 9 10 11 12 13 14 15 16 17 18 19 20 21 22 23 24 25 26 27 28 29 30 31 32 33 34 35 36 37 38 39 40 41 42 43 44 45 46 47 48 49 50 51 52 53 54 55 56 57 58 59
For Peer Review
311 Between-class analysis of rrs data showed that the composition of the total bacterial 312 community differed according to field site (Figure 4C). The first axis (71% of between-class 313 variability) distinguished C from the two other sites, and the 12 genera contributing most to this 314 differentiation were Algisphaera, Fibrobacter, Amaricoccus, Hirschia, Desulfacinum and
315 Saccharophagus (more prevalent in C than in L and FC), as well as Actinomadura, Lutispora,
316 Bacillus, Rhodopseudomonas, Kouleothrix and Roseiflexus (less prevalent in C than in FC and
317 L). The second axis (29% of between-class variability) distinguished site L from FC and C, and 318 the 12 genera contributing most to this differentiation included Flavobacterium,
319 Gluconobacter, Maricaulis, Prolixibacter, ‘Candidatus Xiphinematobacter’, Chthoniobacter
320 (more prevalent in FC than L), as well as Conexibacter, Hyphomicrobium, Pseudonocardia,
321 Tumebacillus, Chelatococcus and Mycobacterium (less prevalent in FC than in L).
322 In summary, between-class analysis of nifH and acdS data indicated that the 323 composition of diazotrophic bacteria and of ACC deaminase bacteria differed according to field 324 site, but the main discriminant genera differed completely for both types of bacteria. In both 325 cases, the discriminant taxa were also different from the main range of bacterial taxa 326 distinguishing the three sites most when comparing the latter based on rrs data, at the scale of 327 the entire rhizobacterial community.
328
329 3.4. Relation between the genetic structures of nifH and acdS rhizobacteria in the three
330 field sites
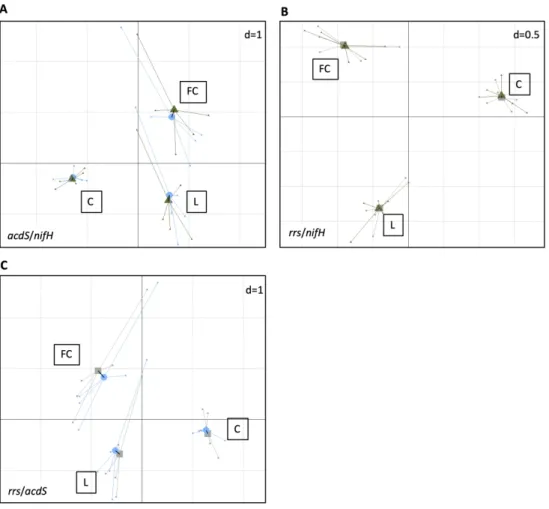
331 Since there was a positive correlation between log numbers of nifH and/or acdS rhizobacteria 332 but the corresponding bacterial genera discriminating most between the three fields studied 333 were not the same, the structuration between nifH and acdS diversity was explored by co-334 inertia analysis to compare more globally the genetic structures of these rhizobacterial groups 335 across the three field sites. Monte-Carlo permutation tests showed a significant co-structuration
3 4 5 6 7 8 9 10 11 12 13 14 15 16 17 18 19 20 21 22 23 24 25 26 27 28 29 30 31 32 33 34 35 36 37 38 39 40 41 42 43 44 45 46 47 48 49 50 51 52 53 54 55 56 57 58 59
For Peer Review
336 (P = 9 × 10⁻⁵) of nifH and acdS rhizobacteria, with a RV coefficient of 0.83. This accounted for
337 57% of data variability. The plot of the co-inertia matrix illustrates the strength of the 338 relationship between acdS and nifH diversities, as superposition of acdS and nifH groups 339 showed a strong co-trend in all three field sites (Figure 5).
340 Co-inertia analyses of nifH and acdS diversities were also performed with rrs diversity, 341 and permutations tests also showed co-structuration in both cases, with respectively RV 342 coefficients of 0.89 and 0.91, the two axes explaining 52% and 69% of variability. 343 Superposition of rrs community with acdS and with nifH groups indicated a strong co-trend 344 across the three fields.
345 In summary, the genetic structures of nifH and acdS rhizobacterial groups across the 346 three field sites were very close. Co-inertia was strong also when comparing each with the 347 whole rhizobacterial community based on rrs data.
348
349 4. DISCUSSION
350
351 The current work made use of molecular tools available to characterize functional groups of
352 nifH and acdS bacteria. Quantification of nifH rhizobacteria was performed with primers
353 PolF/PolR (Poly et al. 2001) rather than other well-established primers such as Zf/Zr (Zehr and 354 McReynolds, 1989) since the latter are not effective for quantitative PCR (Boyd and Peters 355 2013; Gaby and Buckley 2017; Poly et al. 2001). The same primers have also been used for 356 sequencing, both for consistency and efficacy for diazotroph characterization (Mårtensson et 357 al. 2009; Wartiainen et al. 2008). Recently, acdS primers suitable for monitoring of ACC 358 deamination bacteria have been made available (Bouffaud et al. 2018). These primers are 359 effective to amplify true acdS genes while not amplifying related D-cystein desulfhydrase genes 360 coding for other PLP-dependent enzymes, which was verified again in the current work (Figure
3 4 5 6 7 8 9 10 11 12 13 14 15 16 17 18 19 20 21 22 23 24 25 26 27 28 29 30 31 32 33 34 35 36 37 38 39 40 41 42 43 44 45 46 47 48 49 50 51 52 53 54 55 56 57 58 59
For Peer Review
361 S2). Indeed, phylogenetic analysis of the acdS sequences showed that none clustered within the 362 out-group (built with strains harboring D-cystein desulfhydrase genes), confirming that the 363 sequences obtained were true acdS sequences, as highlighted in previous studies (Blaha et al. 364 2006; Bouffaud et al. 2018; Li et al. 2015; Nascimento et al. 2012).
365 The level of taxonomic information carried by nifH sequences has been described in the 366 literature, showing that nifH was sufficiently conserved to enable reliable taxonomic affiliations 367 including for the assessment of rhizobacteria (Vinuesa et al. 2005), and its phylogeny was 368 congruent with the one derived from rrs (Achouak et al. 1999; Zehr et al. 2003). As for acdS, 369 phylogenetic analysis of the new sequences obtained (along with reference acdS sequences) 370 confirmed that the taxonomic affiliations made at the genus level were correct. However, the 371 130-bp acdS amplicons obtained with the current quantitative PCR primers do not enable any 372 taxonomic affiliation below the genus level, i.e. at the species level (Bouffaud et al. 2018). 373 In this work, the hypothesis that nifH and acdS rhizobacterial populations co-occur on 374 roots was assessed with maize taken from three fields, using quantitative PCR and MiSeq 375 sequencing. The results that were obtained did substantiate this hypothesis, based on (i) positive 376 correlations between the sizes of nifH and acdS rhizobacterial groups, and (ii) comparable 377 genetic structures indicated by inertia analysis for both functional groups across the three field 378 sites studied. Several studies have assessed the co-occurrence of particular microorganisms and 379 measured between-taxa correlations in soil systems (Barberán et al. 2011; Freilich et al. 2010), 380 but few have done so at the level of functional groups. For instance, co-occurrence analysis of 381 nitrite-dependent anaerobic ammonium oxidizers and methane oxidizers in paddy soil showed 382 that the structure of these communities changed with soil depth (Wang et al. 2012). The co-383 occurrence of plant-beneficial functions in the rhizosphere has been investigated, but often the 384 assessment was restrained to narrow taxonomic levels, such as within the Pseudomonas genus 385 (Almario et al. 2014; Frapolli et al. 2012; Vacheron et al. 2016). It is interesting to note that not
3 4 5 6 7 8 9 10 11 12 13 14 15 16 17 18 19 20 21 22 23 24 25 26 27 28 29 30 31 32 33 34 35 36 37 38 39 40 41 42 43 44 45 46 47 48 49 50 51 52 53 54 55 56 57 58 59
For Peer Review
386 all microorganisms harboring acdS and/or nifH expressed the corresponding functions in 387 rhizosphere based on assessment of qRT-PCR data, as previously described for nifH (Bouffaud 388 et al. 2016) or acdS (Bouffaud et al. 2018).
389 Specific taxa can be selected by environmental conditions prevailing on plant roots 390 (Bakker et al. 2014; Berg and Smalla, 2009; Raaijmakers et al. 2009; Vandenkoornhuyse et al. 391 2015). Thus, a first possibility to account for the co-occurrence of both functional groups could 392 be that both nifH bacteria and acdS bacteria do well in the maize rhizosphere. Indeed, both types 393 of bacteria are readily found on roots (Almario et al. 2014; Arruda et al. 2013; Blaha et al. 2006; 394 Bruto et al. 2014; Bruto et al. 2014; Mårtensson et al. 2009). Such co-occurrence would make 395 sense in ecological terms, because associative nitrogen fixation and ACC deamination are 396 functions limiting plant nutrient deficiency by supplying nitrogen (Pii et al. 2015) and 397 enhancing root system development (thereby improving uptake of mineral nutriments including 398 nitrogen) (Glick, 2014), respectively.
399 A second possibility could be that bacteria that harbor both genes/functions are well 400 adapted to maize roots. Indeed, Bruto et al. (2014) showed that the nif operon co-occurred with
401 acdS in several bacterial clades, and for instance the genera Bradyrhizobium or Burkholderia
402 contain several species harboring both functions (Bruto et al. 2014). Furthermore, the co-inertia 403 between these two functional groups and the total community raises the possibility that 404 additional functions could also be present in addition to associative nitrogen fixation and ACC 405 deamination. Indeed, comparative genomics studies showed that bacterial taxa display multiple 406 specific functions, including plant interaction functions (Bruto et al. 2014; Lassalle et al. 2015; 407 Vacheron et al. 2017), and thus these functions would also be co-selected when selecting the 408 corresponding rrs-based taxa. In the current study, Bradyrhizobium represented 17 to 25% of 409 acdS+ bacteria and 20 to 42% of nifH+ bacteria in the maize rhizosphere, and the high proportion
410 of this bacterial clade may contribute to the co-occurence of diazotrophs and ACC deaminase
3 4 5 6 7 8 9 10 11 12 13 14 15 16 17 18 19 20 21 22 23 24 25 26 27 28 29 30 31 32 33 34 35 36 37 38 39 40 41 42 43 44 45 46 47 48 49 50 51 52 53 54 55 56 57 58 59
For Peer Review
411 producers that was found. However, when the 10,369 completely-sequenced bacterial genomes 412 available in the NCBI database were screened, it showed that 833 of them harbored acdS and 413 461 others nifH, but only 122 genomes had both genes. Therefore, it could be that this second 414 possibility is insufficient for a complete explanation of the current findings.
415 A third possibility to consider is the joint occurrence of both functions in the 416 rhizosphere, regardless of the taxa harboring them, thereby providing functional redundancy 417 (Shade and Handelsman, 2012). Several studies in soil or aquatic settings have suggested that 418 the metabolic/functional potential of microbial communities rather than their taxonomic 419 variations are closely related to environmental conditions (Bouffaud et al. 2018; Burke et al. 420 2011; Louca et al. 2016; Louca et al. 2017 ). These observations were conceptualized as the 421 "It's the song, not the singer" theory (ITSNTS; Doolittle and Booth 2017), i.e. functional groups 422 within microbial communities (the songs) would be better conserved and more relevant 423 ecologically than the taxa themselves (the singers). Consistent with the ITSNTS theory, our 424 study suggests that the assembly of the rhizosphere microbial community would entail a balance 425 between phytostimulation-relevant genes, which may be needed to achieve an effective 426 holobiont (i.e., the plant host and its functional microbiota), and points to the preponderance of 427 functional interactions within the plant holobiont. This hypothesis, which has been put forward 428 recently for root-associated microorganisms (Lemanceau et al. 2017), remains speculative at 429 this stage and deserves further research attention. In particular, methodology development is 430 needed to enable direct assessment of key plant-beneficial groups when parallel monitoring of 431 several genes is required (e.g. for auxin production or P solubilization, which entail many 432 genetic pathways), in contrast to ACC deamination and N fixation for which analysis of a single 433 gene (acdS and nifH, respectively) may suffice.
434 To test whether the current findings could be also relevant under other environmental 435 conditions, we reassessed the data obtained for nifH (Bouffaud et al. 2016) and acdS (Bouffaud
3 4 5 6 7 8 9 10 11 12 13 14 15 16 17 18 19 20 21 22 23 24 25 26 27 28 29 30 31 32 33 34 35 36 37 38 39 40 41 42 43 44 45 46 47 48 49 50 51 52 53 54 55 56 57 58 59
For Peer Review
436 et al. 2018) from two maize lines grown in another soil (luvisol) with different management 437 histories (cropped soil vs meadow soil). A positive correlation (r = 0.45 ; P = 0.050 ; n = 20) 438 was found between the numbers of nifH and acdS bacteria in the monocropping soil but not in 439 meadow soil (P = 0.75 ; n = 10), suggesting that maize monocropping history could have been 440 an important factor. However, these findings were obtained with young plants only (21 days), 441 grown in sieved soil under greenhouse conditions.
442 In conclusion, the current findings indicate that rhizobacteria with nitrogen fixation 443 capacity and counterparts harboring ACC deamination ability co-occur in the maize 444 rhizosphere, pointing to the possibility that plants may rely on multiple, complementary 445 phytostimulatory functions provided by their microbial partners. Additional method 446 development is needed to extend this type of assessment to additional phytostimulatory groups 447 and other microbial functional groups important for plant performance.
448
449 ACKNOWLEDGEMENTS
450 This work was supported in part by project Azodure (ANR Agrobiosphère
ANR-12-AGRO-451 0008). We are grateful to J. Haurat and H. Brunet for technical help, as well as D. Abrouk
452 (iBio platform, UMR CNRS 5557 Écologie Microbienne) and J. Thioulouse (UMR CNRS
453 LBBE) for helpful discussion. The authors declare no conflict of interest.
454
455 DATA ACCESSIBILITY
456 Illumina MiSeq paired-end reads have been deposited in the European Bioinformatics Institute 457 (EBI) database under accession numbers PRJEB14347 (ERP015984) for rrs; PRJEB14346 458 (ERP015983) for nifH, PRJEB14343 (ERP015981) for acdS.
459 460 AUTHOR CONTRIBUTIONS 3 4 5 6 7 8 9 10 11 12 13 14 15 16 17 18 19 20 21 22 23 24 25 26 27 28 29 30 31 32 33 34 35 36 37 38 39 40 41 42 43 44 45 46 47 48 49 50 51 52 53 54 55 56 57 58 59
For Peer Review
461 LL, YML and DM designed the project, SR, LL, CPC, YML and DM carried out field work
462 and samplings, SR conducted the molecular work, SR, MLB and AD implemented
463 bioinformatic analyses, SR, YML and DM analyzed data, SR, YML and DM prepared the first
464 draft of the manuscript, which was finalized by all authors.
465 3 4 5 6 7 8 9 10 11 12 13 14 15 16 17 18 19 20 21 22 23 24 25 26 27 28 29 30 31 32 33 34 35 36 37 38 39 40 41 42 43 44 45 46 47 48 49 50 51 52 53 54 55 56 57 58 59
For Peer Review
466 REFERENCES
467
468 Achouak W, Normand P, Heulin T. Comparative phylogeny of rrs and nifH genes in the Bacillaceae.
469 Int J Syst Evol Microbiol 1999;49(3):961-967. doi:10.1099/00207713-49-3-961
470 Agaras BC, Scandiani M, Luque A et al. Quantification of the potential biocontrol and direct plant
471 growth promotion abilities based on multiple biological traits distinguish different groups of
472 Pseudomonas spp. isolates. Biological Control 2015;90:173-186.
473 doi:https://doi.org/10.1016/j.biocontrol.2015.07.003
474 Almario J, Gobbin D, Défago G et al. Prevalence of type III secretion system in effective biocontrol
475 pseudomonads. Res Microbiol 2014;165(4):300-304.
476 doi:https://doi.org/10.1016/j.resmic.2014.03.008
477 Almario J, Muller D, Défago G et al. Rhizosphere ecology and phytoprotection in soils naturally
478 suppressive to Thielaviopsis black root rot of tobacco. Environ Microbiol
2014;16(7):1949-479 1960. doi:10.1111/1462-2920.12459
480 Arruda L, Beneduzi A, Martins A et al. Screening of rhizobacteria isolated from maize (Zea mays L.)
481 in Rio Grande do Sul State (South Brazil) and analysis of their potential to improve plant
482 growth. Appl Soil Ecol 2013;63:15-22. doi:https://doi.org/10.1016/j.apsoil.2012.09.001
483 Bakker MG, Schlatter DC, Otto-Hanson L et al. Diffuse symbioses: roles of plant–plant, plant–
484 microbe and microbe–microbe interactions in structuring the soil microbiome. Mol Ecol
485 2014;23(6):1571-1583. doi:10.1111/mec.12571
486 Barberán A, Bates ST, Casamayor EO et al. Using network analysis to explore co-occurrence patterns
487 in soil microbial communities. ISME J 2011;6:343–351. doi:10.1038/ismej.2011.119
488 https://www.nature.com/articles/ismej2011119#supplementary-information
489 Bashan Y, de-Bashan LE. Chapter Two - How the plant growth-promoting bacterium Azospirillum
490 promotes plant growth—A critical assessment. In: Sparks DL (ed). Advances in Agronomy.
491 Academic Press, 2010, 108, 77-136. 3 4 5 6 7 8 9 10 11 12 13 14 15 16 17 18 19 20 21 22 23 24 25 26 27 28 29 30 31 32 33 34 35 36 37 38 39 40 41 42 43 44 45 46 47 48 49 50 51 52 53 54 55 56 57 58 59
For Peer Review
492 Bashan Y, de-Bashan LE, Prabhu SR et al. Advances in plant growth-promoting bacterial inoculant
493 technology: formulations and practical perspectives (1998–2013). Plant Soil
2014;378(1):1-494 33. doi:10.1007/s11104-013-1956-x
495 Berg G, Smalla K. Plant species and soil type cooperatively shape the structure and function of
496 microbial communities in the rhizosphere. FEMS Microbiol Ecol 2009;68(1):1-13.
497 doi:10.1111/j.1574-6941.2009.00654.x
498 Bertalan M, Albano R, de Pádua V et al. Complete genome sequence of the sugarcane nitrogen-fixing
499 endophyte Gluconacetobacter diazotrophicus Pal5. BMC Genomics 2009;10(1):450.
500 doi:10.1186/1471-2164-10-450
501 Blaha D, Prigent-Combaret C, Mirza MS et al. Phylogeny of the 1-aminocyclopropane-1-carboxylic
502 acid deaminase-encoding gene acdS in phytobeneficial and pathogenic Proteobacteria and
503 relation with strain biogeography. FEMS Microbiol Ecol 2006;56(3):455-470.
504 doi:10.1111/j.1574-6941.2006.00082.x
505 Bouffaud M-L, Renoud S, Dubost A et al. 1-Aminocyclopropane-1-carboxylate deaminase producers
506 associated to maize and other Poaceae species. Microbiome 2018;6(1):114.
507 doi:10.1186/s40168-018-0503-7
508 Bouffaud M-L, Renoud S, Moënne-Loccoz Y et al. Is plant evolutionary history impacting recruitment
509 of diazotrophs and nifH expression in the rhizosphere? Sci Rep 2016;6:21690.
510 doi:10.1038/srep21690 http://www.nature.com/articles/srep21690#supplementary-information
511 Boyd E, Peters J. New insights into the evolutionary history of biological nitrogen fixation. Front
512 Microbiol 2013;4:201. doi:10.3389/fmicb.2013.00201
513 Bruto M, Prigent-Combaret C, Luis P et al. Frequent, independent transfers of a catabolic gene from
514 bacteria to contrasted filamentous eukaryotes. Proc R Soc Lond B: Biol Sci 2014;281:1789.
515 doi:10.1098/rspb.2014.0848
516 Bruto M, Prigent-Combaret C, Muller D et al. Analysis of genes contributing to plant-beneficial
517 functions in plant growth-promoting rhizobacteria and related Proteobacteria. Sci Rep
518 2014;4:6261. doi:10.1038/srep06261 3 4 5 6 7 8 9 10 11 12 13 14 15 16 17 18 19 20 21 22 23 24 25 26 27 28 29 30 31 32 33 34 35 36 37 38 39 40 41 42 43 44 45 46 47 48 49 50 51 52 53 54 55 56 57 58 59
For Peer Review
519 Burke C, Steinberg P, Rusch D et al. Bacterial community assembly based on functional genes rather
520 than species. Proc Natl Acad Sci USA 2011;108(34):14288-14293.
521 doi:10.1073/pnas.1101591108
522 Cassán F, Vanderleyden J, Spaepen S. Physiological and agronomical aspects of phytohormone
523 production by model Plant-Growth-Promoting Rhizobacteria (PGPR) belonging to the genus
524 Azospirillum. J. Plant Growth Regul 2014;33(2):440-459. doi:10.1007/s00344-013-9362-4
525 Chen XH, Koumoutsi A, Scholz R et al. Comparative analysis of the complete genome sequence of
526 the plant growth–promoting bacterium Bacillus amyloliquefaciens FZB42. Nature Biotechnol
527 2007;25:1007. doi:10.1038/nbt1325
https://www.nature.com/articles/nbt1325#supplementary-528 information
529 Chessel D, Dufour AB, Thioulouse J. The ade4 package-I-One-table methods. R News 2004;4(1):5-10.
530 Cormier F, Foulkes J, Hirel B et al. Breeding for increased nitrogen-use efficiency: a review for wheat
531 (T. aestivum L.). Plant Breeding 2016;135(3):255-278. doi:10.1111/pbr.12371
532 Couillerot O, Ramírez-Trujillo A, Walker V et al. Comparison of prominent Azospirillum strains in
533 Azospirillum–Pseudomonas–Glomus consortia for promotion of maize growth. Appl
534 Microbiol Biotechnol 2013;97(10):4639-4649. doi:10.1007/s00253-012-4249-z
535 Culhane AC, Thioulouse J, Perrière G et al. MADE4: an R package for multivariate analysis of gene
536 expression data. Bioinformatics 2005;21(11):2789-2790. doi:10.1093/bioinformatics/bti394
537 Deynze A, Zamora P, Delaux P-M et al. Nitrogen fixation in a landrace of maize is supported by a
538 mucilage-associated diazotrophic microbiota. PLoS Biol 2018;16(8):e2006352.
https://doi-539 org.inee.bib.cnrs.fr/10.1371/journal.pbio.2006352
540 DeSantis TZ, Hugenholtz P, Larsen N et al. Greengenes, a chimera-checked 16S rRNA gene database
541 and workbench compatible with ARB. Appl Environ Microbiol 2006;72(7):5069-5072.
542 doi:10.1128/aem.03006-05
543 Doolittle WF, Booth A. It’s the song, not the singer: an exploration of holobiosis and evolutionary
544 theory. Biol Philos 2017;32(1):5-24. doi:10.1007/s10539-016-9542-2
3 4 5 6 7 8 9 10 11 12 13 14 15 16 17 18 19 20 21 22 23 24 25 26 27 28 29 30 31 32 33 34 35 36 37 38 39 40 41 42 43 44 45 46 47 48 49 50 51 52 53 54 55 56 57 58 59
For Peer Review
545 Dray S, Chessel D, Thioulouse J. Co-inertia analysis and the linking of ecological data tables. Ecology
546 2003;84(11):3078-3089. doi:10.1890/03-0178
547 Dray S, Dufour AB, Chessel D. The ade4 Package—II: Two-table and K-table methods. R News
548 2007;7:47-52.
549 Duan J, Müller KM, Charles T et al. 1-aminocyclopropane-1-carboxylate (ACC) deaminase genes in
550 Rhizobia from southern Saskatchewan. Microb Ecol 2009;57(3):423-436.
551 doi:10.1007/s00248-008-9407-6
552 Frapolli M, Pothier JF, Défago G et al. Evolutionary history of synthesis pathway genes for
553 phloroglucinol and cyanide antimicrobials in plant-associated fluorescent pseudomonads. Mol
554 Phylogenet Evol 2012;63(3):877-890. doi:https://doi.org/10.1016/j.ympev.2012.02.030
555 Freilich S, Kreimer A, Meilijson I et al. The large-scale organization of the bacterial network of
556 ecological co-occurrence interactions. Nucleic Acids Res 2010;38(12):3857-3868.
557 doi:10.1093/nar/gkq118
558 Gaby JC, Buckley DH. The use of degenerate primers in qPCR analysis of functional genes can cause
559 dramatic quantification bias as revealed by investigation of nifH primer performance. Microb
560 Ecol 2017;74(3):701-708. doi:10.1007/s00248-017-0968-0
561 Gamalero E, Glick BR. Bacterial modulation of plant ethylene levels. Plant Physiol
2015;169(1):13-562 22. doi:10.1104/pp.15.00284
563 Glick BR. Bacteria with ACC deaminase can promote plant growth and help to feed the world.
564 Microbiol Res 2014;169(1):30-39. doi:https://doi.org/10.1016/j.micres.2013.09.009
565 Hartman K, van der Heijden MGA, Wittwe RA et al. Cropping practices manipulate abundance
566 patterns of root and soil microbiome members paving the way to smart farming. Microbiome
567 2018;6(1):14. doi:10.1186/s40168-017-0389-9
568 Jha B, Gontia I, Hartmann A. The roots of the halophyte Salicornia brachiata are a source of new
569 halotolerant diazotrophic bacteria with plant growth-promoting potential. Plant Soil
570 2012;356(1):265-277. doi:10.1007/s11104-011-0877-9 3 4 5 6 7 8 9 10 11 12 13 14 15 16 17 18 19 20 21 22 23 24 25 26 27 28 29 30 31 32 33 34 35 36 37 38 39 40 41 42 43 44 45 46 47 48 49 50 51 52 53 54 55 56 57 58 59
For Peer Review
571 Lassalle F, Muller D, Nesme X. Ecological speciation in bacteria: reverse ecology approaches reveal
572 the adaptive part of bacterial cladogenesis. Res Microbiol 2015;166(10):729-741.
573 doi:https://doi.org/10.1016/j.resmic.2015.06.008
574 Lemanceau P, Blouin M, Muller D, et al. Let the core microbiota be functional. Trends Plant Sci
575 2017;22(7):583-595. doi:https://doi.org/10.1016/j.tplants.2017.04.008
576 Li Z, Chang S, Ye S et al. Differentiation of 1-aminocyclopropane-1-carboxylate (ACC) deaminase
577 from its homologs is the key for identifying bacteria containing ACC deaminase. FEMS
578 Microbiol Ecol 2015;91(10):fiv112-fiv112. doi:10.1093/femsec/fiv112
579 Louca S, Parfrey LW, Doebeli M. Decoupling function and taxonomy in the global ocean microbiome.
580 Science 2016;353(6305):1272-1277. doi:10.1126/science.aaf4507
581 Louca S, Jacques SMS, Pires APF et al. High taxonomic variability despite stable functional structure
582 across microbial communities. Nat Ecol Evol 2017;1:0015. doi:10.1038/s41559-016-0015
583 Ma W, Guinel FC, Glick, BR. Rhizobium leguminosarum biovar viciae
1-aminocyclopropane-1-584 carboxylate deaminase promotes nodulation of pea plants. Appl Environ Microbiol
585 2003;69(8):4396-4402. doi:10.1128/aem.69.8.4396-4402.2003
586 Mårtensson L, Díez B, Wartiainen I et al. Diazotrophic diversity, nifH gene expression and
587 nitrogenase activity in a rice paddy field in Fujian, China. Plant Soil 2009;325(1):207-218.
588 doi:10.1007/s11104-009-9970-8
589 Nascimento FX, Brígido C, Glick BR et al. ACC deaminase genes are conserved among
590 Mesorhizobium species able to nodulate the same host plant. FEMS Microbiol Lett
591 2012;336(1):26-37. doi:10.1111/j.1574-6968.2012.02648.x
592 Nukui N, Minamisawa K, Ayabe S-I et al. Expression of the 1-aminocyclopropane-1-carboxylic acid
593 deaminase gene requires symbiotic nitrogen-fixing regulator gene nifA2 in Mesorhizobium loti
594 MAFF303099. Appl Environ Microbiol 2006;72(7):4964-4969. doi:10.1128/aem.02745-05
595 Pieterse CMJ, Van Wees SCM. Induced disease resistance. In: Lugtenberg B (ed). Principles of
Plant-596 Microbe Interactions: Microbes for Sustainable Agriculture. Springer International
597 Publishing, 2015, 123-33. 3 4 5 6 7 8 9 10 11 12 13 14 15 16 17 18 19 20 21 22 23 24 25 26 27 28 29 30 31 32 33 34 35 36 37 38 39 40 41 42 43 44 45 46 47 48 49 50 51 52 53 54 55 56 57 58 59
For Peer Review
598 Pii Y, Mimmo T, Tomasi N et al. Microbial interactions in the rhizosphere: beneficial influences of
599 plant growth-promoting rhizobacteria on nutrient acquisition process. A review. Biol Fertil
600 Soils 2015;51(4):403-415. doi:10.1007/s00374-015-0996-1
601 Poly F, Jocteur Monrozier L, Bally R. Improvement in the RFLP procedure for studying the diversity
602 of nifH genes in communities of nitrogen fixers in soil. Res Microbiol 2001;152(1):95-103.
603 doi:https://doi.org/10.1016/S0923-2508(00)01172-4
604 Prigent-Combaret C, Blaha D, Pothier J et al. Physical organization and phylogenetic analysis of acdR
605 as leucine-responsive regulator of the 1-aminocyclopropane-1-carboxylate deaminase gene
606 acdS in phytobeneficial Azospirillum lipoferum 4B and other Proteobacteria. FEMS
607 Microbiol Ecol 2008;65(2):202-219. doi:10.1111/j.1574-6941.2008.00474.x
608 Puri A, Padda KP, Chanway CP. Evidence of nitrogen fixation and growth promotion in canola
609 (Brassica napus L.) by an endophytic diazotroph Paenibacillus polymyxa P2b-2R. Biol Fertil
610 Soils 2016;52(1):119-125. doi:10.1007/s00374-015-1051-y
611 Raaijmakers JM, Paulitz TC, Steinberg C et al. The rhizosphere: a playground and battlefield for
612 soilborne pathogens and beneficial microorganisms. Plant Soil 2009;321(1):341-361.
613 doi:10.1007/s11104-008-9568-6
614 Rana A, Saharan B, Joshi M et al. Identification of multi-trait PGPR isolates and evaluating their
615 potential as inoculants for wheat. Ann Microbiol 2011;61(4):893-900.
doi:10.1007/s13213-616 011-0211-z
617 Redondo-Nieto M, Barret M, Morrissey J et al. Genome sequence reveals that Pseudomonas
618 fluorescens F113 possesses a large and diverse array of systems for rhizosphere function and
619 host interaction. BMC Genomics 2013;14(1):54. doi:10.1186/1471-2164-14-54
620 Rozier C, Hamzaoui J, Lemoine D et al. Field-based assessment of the mechanism of maize yield
621 enhancement by Azospirillum lipoferum CRT1. Sci Rep 2017;7(1):7416.
doi:10.1038/s41598-622 017-07929-8
623 Shade A, Handelsman J. Beyond the Venn diagram: the hunt for a core microbiome. Environ
624 Microbiol 2012;14(1):4-12. doi:10.1111/j.1462-2920.2011.02585.x 3 4 5 6 7 8 9 10 11 12 13 14 15 16 17 18 19 20 21 22 23 24 25 26 27 28 29 30 31 32 33 34 35 36 37 38 39 40 41 42 43 44 45 46 47 48 49 50 51 52 53 54 55 56 57 58 59
For Peer Review
625 Team, R. R: A Language and Environment for Statistical Computing 2014. Vienna, Austria: R
626 Foundation for Statistical Computing.
627 Vacheron J, Desbrosses G, Bouffaud M-L et al. Plant growth-promoting rhizobacteria and root system
628 functioning. Front Plant Sci 2013;4:356. doi:10.3389/fpls.2013.00356
629 Vacheron J, Desbrosses G, Renoud S et al. Differential contribution of plant-beneficial functions from
630 Pseudomonas kilonensis F113 to root system architecture alterations in Arabidopsis thaliana
631 and Zea mays. Mol Plant-Microbe Interact 2017;31(2):212-223.
doi:10.1094/MPMI-07-17-632 0185-R
633 Vacheron J, Moënne-Loccoz Y, Dubost A et al. Fluorescent Pseudomonas strains with only few
plant-634 beneficial properties are favored in the maize rhizosphere. Front Plant Sci 2016;7:1212.
635 doi:10.3389/fpls.2016.01212
636 Vandenkoornhuyse P, Quaiser A, Duhamel et al. The importance of the microbiome of the plant
637 holobiont. New Phytol 2015;206(4):1196-1206. doi:doi:10.1111/nph.13312
638 Vinuesa P, Silva C, Lorite MJ et al. Molecular systematics of rhizobia based on maximum likelihood
639 and Bayesian phylogenies inferred from rrs, atpD, recA and nifH sequences, and their use in
640 the classification of Sesbania microsymbionts from Venezuelan wetlands. Syst Appl Microbiol
641 2005;28(8):702-716. doi:https://doi.org/10.1016/j.syapm.2005.05.007
642 Wang Y, Zhu G, Harhangi HR et al. Co-occurrence and distribution of nitrite-dependent anaerobic
643 ammonium and methane-oxidizing bacteria in a paddy soil. FEMS Microbiol Lett
644 2012;336(2):79-88. doi:10.1111/j.1574-6968.2012.02654.x
645 Wartiainen I, Eriksson T, Zheng W et al. Variation in the active diazotrophic community in rice
646 paddy—nifH PCR-DGGE analysis of rhizosphere and bulk soil. Appl Soil Ecol
2008;39(1):65-647 75. doi:https://doi.org/10.1016/j.apsoil.2007.11.008
648 Wisniewski-Dyé F, Lozano L, Acosta-Cruz E et al. Genome sequence of Azospirillum brasilense
649 CBG497 and comparative analyses of Azospirillum core and accessory genomes provide
650 insight into niche adaptation. Genes 2012;3(4):576.
3 4 5 6 7 8 9 10 11 12 13 14 15 16 17 18 19 20 21 22 23 24 25 26 27 28 29 30 31 32 33 34 35 36 37 38 39 40 41 42 43 44 45 46 47 48 49 50 51 52 53 54 55 56 57 58 59
For Peer Review
651 Zehr JP, Jenkins BD, Short SM et al. Nitrogenase gene diversity and microbial community structure: a
652 cross-system comparison. Envirol Microbiol 2003;5(7):539-554.
doi:10.1046/j.1462-653 2920.2003.00451.x
654 Zehr JP, McReynolds LA. Use of degenerate oligonucleotides for amplification of the nifH gene from
655 the marine cyanobacterium Trichodesmium thiebautii. Appl Environ Microbiol
656 1989;55(10):2522-2526. 657 3 4 5 6 7 8 9 10 11 12 13 14 15 16 17 18 19 20 21 22 23 24 25 26 27 28 29 30 31 32 33 34 35 36 37 38 39 40 41 42 43 44 45 46 47 48 49 50 51 52 53 54 55 56 57 58 59
For Peer Review
658 Legend
659
660 FIGURE 1. Size of the acdS and nifH functional groups compared in the three field sites L, FC
661 and C over four sampling times. Means and standard deviations are shown for the acdS group 662 at 6 leaves in 2014 (A) and 2015 (B) and at flowering in 2014 (E) and 2015 (F) and for the nifH 663 group at 6 leaves in 2014 (C) and 2015 (D) and at flowering in 2014 (G) and 2015 (H). The 664 analysis was done using pooled samples of six roots systems (n= 5) at FC and C and individual 665 root systems (n = 30) at L in 2014, and individual root systems (n = 20) at all three sites in 2015. 666 Statistical differences between sites are indicated by letters a-c (ANOVA and Fischer’s LSD 667 tests, P < 0.05).
668
669 FIGURE 2. Correlation between log numbers of nifH (X axis) and acdS genes (Y axis).
670 Correlation was established using the Pearson coefficient. The analysis was done using pooled 671 samples of six roots systems (n= 5) at FC and C and individual root systems (n = 30) at L in 672 2014, and individual root systems (n = 20) at all three sites in 2015.
673
674 FIGURE 3. Correlation between Shannon diversity indices of nifH and acdS (A), Simpson
675 diversity indices of nifH and acdS (B), Shannon diversity indices of rrs and acdS or nifH (C), 676 and Simpson diversity indices of rrs and acdS or nifH (D). Correlation was established 677 separately at each of the three field sites L, FC and C, using the Pearson coefficient (n = 5). 678
679 FIGURE 4. Comparison of nifH (A), acdS (B) and rrs (C) diversity between sites L, FC and C
680 by between-class analysis. Red circles, green triangles and blue squares are used for samples 681 from sites FC, C and L, respectively. The curves at the top and the left of the panels show the 682 distribution of samples on respectively the X and Y axes.
3 4 5 6 7 8 9 10 11 12 13 14 15 16 17 18 19 20 21 22 23 24 25 26 27 28 29 30 31 32 33 34 35 36 37 38 39 40 41 42 43 44 45 46 47 48 49 50 51 52 53 54 55 56 57 58 59
For Peer Review
683
684 FIGURE 5. Co-inertia analysis between acdS and nifH diversities (A), rrs and nifH diversities
685 (B) and rrs and acdS diversities (C). Projection of the samples (n = 5) is based on both acdS 686 (Blue) and nifH (Green), rrs (Grey) and nifH (Green), or rrs (Grey) and acdS (Blue) diversity 687 variables (level = genus) into a same factorial plan. The vector in black shows the strength of 688 co-trends between the two barycenters of variables as related to each site (L, FC, C). Shorter 689 vectors indicate stronger convergent trends between the two variable groups.
690 691
692 FIGURE S1: Rarefaction curves for nifH (A), acdS (B) and rrs (C) genes.
693
694 FIGURE S2. RAxML bipartition tree of 3322 sequenced acdS alleles from Poaceae
695 rhizosphere. The tree was visualized using iTOL software (Letunic I, Bork P. Interactive Tree 696 Of Life (iTOL) v4: recent updates and new developments (2019) Nucleic Acids Res doi:
697 10.1093/nar/gkz239). Branches colored in violet represent the out-group of D-cystein 698 desulfhydrase genes, whereas acdS alleles affiliated to Betaproteobacteria are shown in khaki, 699 to Gammaproteobacteria in blue, to Actinobacteria in green, to Alphaproteobacteria in red, 700 and to microeukaryotes in orange. The tree can be viewed online at the following link 701 http://itol.embl.de/shared/acdStree. 3 4 5 6 7 8 9 10 11 12 13 14 15 16 17 18 19 20 21 22 23 24 25 26 27 28 29 30 31 32 33 34 35 36 37 38 39 40 41 42 43 44 45 46 47 48 49 50 51 52 53 54 55 56 57 58 59
For Peer Review
31 Table 1. Field characteristics of the top (5-30 cm) soil layer.
Texture (%) pH Cation exchange (cmol/kg) Field Soil type
Sand Silt Clay H2O KCl
Organic C (g/kg) Total N (g/kg) C/N ratio CECa Ca2+ Mg2+ K+ FC Fluvic cambisol 26.9 38.3 34.7 7.1 6.3 31.6 3.4 9.3 22.8 21.2 0.67 0.38 L Luvisol 42.9 42.9 14.2 7.3 6.7 21.5 1.6 13.4 93.0 10.5 0.33 0.43 C Calcisol 15.6 74.1 10.3 8.2 7.7 25.9 3.1 8.4 97.0 36.1 0.24 0.29
aCEC, cation exchange capacity.
ScholarOne Support 1-434/964-4100 3 4 5 6 7 8 9 10 11 12 13 14 15 16 17 18 19 20 21 22 23 24 25 26 27 28 29 30 31 32 33 34 35 36 37 38 39 40 41 42 43 44 45 46 47 48 49 50 51 52 53 54 55
For Peer Review
Fig. 1 5 6 7 8 9 acd S lo g o f a cd S co p ie s/ g o f d ry so il 6 leaves 2014 5 6 7 8 9 acdS lo g o f a cd S co p ie s/ g o f d ry so il Flowering 2014 FC L C a c b 5 6 7 8 9 acdS 6 leaves 2015 5 6 7 8 9 acdS Flowering 2015 FC L C a b c FC L C L FC C 5 6 7 8 9 10 nifH lo g o f n if H co p ie s/ g o f d ry so il 6 leaves 2014 FC L C 5 6 7 8 9 10 nifH lo g o f n if H co p ie s/ g o f d ry so il Flowering 2014 FC L C a b c 5 6 7 8 9 10 nifH 6 leaves 2015 FC L C a b b 5 6 7 8 9 10 nifH Flowering 2015 FC L C a c b a b a A B C D E F G H 3 4 5 6 7 8 9 10 11 12 13 14 15 16 17 18 19 20 21 22 23 24 25 26 27 28 29 30 31 32 33 34 35 36 37 38 39 40 41 42 43 44 45 46 47 48 49 50 51 52 53 54 55 56 57 58 59For Peer Review
Correlation 0.80 P = 0.10 Correlation 0.98 P = 2.8 × 10⁻³ Correlation 0.67 P = 7.4 × 10⁻⁵ Correlation 0.67 P = 0.010 Correlation 0.73P = 4.0 × 10⁻³ Correlation 0.87 P = 3.8 × 10⁻⁵ Correlation 0.38 P = 0.19 Correlation 0.69P = 0.010 Correlation 0.86 P = 1.0 × 10⁻⁴ Correlation 0.86 P = 3.7 × 10⁻⁴ Correlation 0.10 P = 0.67 Correlation 0.90 P = 1.0 × 10⁻⁴Site L Site FC Site C
6 le av es 20 14 6 le av es 20 15 Fl ow er in g 20 14 Fl ow er in g 20 15 Fig. 2 3 4 5 6 7 8 9 10 11 12 13 14 15 16 17 18 19 20 21 22 23 24 25 26 27 28 29 30 31 32 33 34 35 36 37 38 39 40 41 42 43 44 45 46 47 48 49 50 51 52 53 54 55 56 57 58 59