HAL Id: halshs-02947077
https://halshs.archives-ouvertes.fr/halshs-02947077
Submitted on 25 Nov 2020HAL is a multi-disciplinary open access archive for the deposit and dissemination of sci-entific research documents, whether they are pub-lished or not. The documents may come from teaching and research institutions in France or abroad, or from public or private research centers.
L’archive ouverte pluridisciplinaire HAL, est destinée au dépôt et à la diffusion de documents scientifiques de niveau recherche, publiés ou non, émanant des établissements d’enseignement et de recherche français ou étrangers, des laboratoires publics ou privés.
Neurofunctional plasticity in fraction learning: An fMRI
training study
Silke Wortha, Johannes Bloechle, Manuel Ninaus, Kristian Kiili, Antero
Lindstedt, Julia Bahnmueller, Korbinian Moeller, Elise Klein
To cite this version:
Silke Wortha, Johannes Bloechle, Manuel Ninaus, Kristian Kiili, Antero Lindstedt, et al.. Neurofunc-tional plasticity in fraction learning: An fMRI training study. Trends in Neuroscience and Education, Elsevier, 2020, 21, pp.100141. �10.1016/j.tine.2020.100141�. �halshs-02947077�
Neurofunctional plasticity in fraction learning: an fMRI training study
12
Silke M. Wortha1,2, Johannes Bloechle3, Manuel Ninaus1,4, Kristian Kiili5, Antero Lindstedt6, Julia 3
Bahnmueller1,7, Korbinian Moeller1,4,7,8 & Elise Klein4,9 4
1 LEAD Graduate School & Research Network, University of Tuebingen, Tuebingen, Germany 5
2 Department of Neurology, Universitätsmedizin Greifswald, Greifswald, Germany 6
3 Department of Psychiatry and Psychotherapy, University of Tuebingen, Tuebingen, Germany 7
4 Leibniz-Institut für Wissensmedien, Tuebingen, Germany 8
5 Faculty of Education and Culture, Tampere University, Tampere, Finland 9
6 Faculty of Information Technology and Communication Sciences, Tampere University, Pori, Finland 10
7 Centre for Mathematical Cognition, School of Science, Loughborough University, United Kingdom 11
8 Individual Development and Adaptive Education Center, Frankfurt am Main, Germany 12
13
9 Université de Paris, LaPsyDÉ, CNRS, Sorbonne Paris Cité, Paris, France 14 15 16 17 18 19 Corresponding author: 20 Silke M. Wortha 21 Department of Neurology, 22 Universitätsmedizin Greifswald, 23 Ferdinand-Sauerbruch-Straße, 24 17475 Greifswald 25 Germany 26 27 [email protected] 28 29 30 31 32 33 34 35 36 37
Abstract 38
39
Background: Fractions are known to be difficult for children and adults. Behavioral studies
40
suggest that magnitude processing of fractions can be improved via number line estimation 41
(NLE) trainings, but little is known about the neural correlates of fraction learning. 42
Method: To examine the neuro-cognitive foundations of fraction learning, behavioral
43
performance and neural correlates were measured before and after a five-day NLE training. 44
Results: In all evaluation tasks behavioral performance increased after training. We observed
45
a fronto-parietal network associated with number magnitude processing to be recruited in all 46
tasks as indicated by a numerical distance effect. For symbolic fractions, the distance effect 47
on intraparietal activation was only observed after training. 48
Conclusion: The absence of a distance effect of symbolic fractions before the training could
49
indicate an initially less automatic access to their overall magnitude. NLE training facilitates 50
processing of overall fraction magnitude as indicated by the distance effect in neural activation. 51
52
Keywords: fraction processing, number line estimation training, flow experience, numerical 53
distance effect, fMRI 54
55
Word count: 150 56
Introduction 58
Over the last decade, research has shown repeatedly that understanding fractions is a 59
crucial predictor of future achievement in higher mathematic [1–3]. However, despite intense 60
research efforts in this area, children’s poor performance when it comes to handling and 61
understanding fractions hardly changed [4–7]. For example, in 2015 Lortie-Forgues and 62
colleagues found that only 27% of 8th graders in the United States were able to choose correctly 63
the number closest to the result of a fraction addition problem out of four given solution probes 64
[8]. A similar result was already reported 1978 by the National Assessment of Educational 65
Progress [9], when only 24% of the 8th graders chose the correct answer to the same question. 66
Importantly, these difficulties in understanding fractions may be persisting regardless of 67
educational efforts because - unlike natural numbers - fraction magnitude processing seems to 68
be more difficult due to its bipartite structure reflecting the relative relation of numerator and 69
denominator [10]. According to the integrated theory of numerical development, magnitude 70
information is the crucial basis for understanding numbers. Moreover, the understanding that 71
all real numbers (e.g., natural numbers, integers, rational numbers) can be represented on a 72
number line is a key assumption for numerical learning. Therefore, promoting fraction 73
magnitude understanding seems crucial for fostering fraction understanding more generally 74
[11–13]. Thus, interventions with the aim to improve fraction understanding and therefore 75
conceptual knowledge of fractions should focus on fostering mastery in processing and 76
representing fraction magnitude. In the context of (fraction) magnitude understanding number 77
lines have been shown to be a beneficial instructional tool [14]. 78
Against this background, we aimed at understanding the neuro-cognitive foundations 79
underlying successful fraction learning and their plasticity. For this purpose, participants had to 80
complete a number line estimation training and a flow questionnaire on five consecutive days. 81
In the following we will highlight the most important research results from the research areas 82
which are relevant for our study. First, we will give a brief overview about the relevance of 83
number line estimation training for fraction magnitude understanding. Second, we will 84
introduce flow as a state which is beneficial for learning and especially for fraction learning. 85
Third, we will summarize present knowledge about the neural correlates of fraction processing 86
and highlight the importance of our study in this context. Finally, we will introduce the aim of 87
the current study including our specific hypothesis. 88
Number line estimation as predictor for fraction magnitude learning
89
The mental number line is a metaphor for the nature of the number magnitude 90
representation whereby numbers are represented spatially with their magnitude increasing from 91
left to right (at least in Western cultures [15]). In numerical cognition research, number line 92
estimation (henceforth NLE) is used repeatedly to assess number magnitude understanding – 93
especially in children ([16–18], but see [19] for additional aspects). In the NLE task, 94
participants have to indicate the spatial position of a target number on a given number line for 95
which only start- and endpoint are specified [18]. 96
As magnitude is the semantic core for any type of number, the task can not only be used 97
to assess, but also to train fraction magnitude understanding [12]. For instance, Hamdan & 98
Gunderson [20] conducted a training study with three conditions for fraction learning (i.e., 99
number line estimation training, area model training, and a non-numerical control). They 100
observed that although children in both the NLE training and the area model training improved 101
in the respective tasks, only children completing the NLE training showed transfer effects to a 102
not trained magnitude comparison task with fractions. 103
Moreover, Barbieri and colleagues [21] used a number line-based intervention to 104
improve fraction understanding in children with poor conceptual knowledge of fractions and 105
compared the number line intervention group to a standard mathematics curriculum group. The 106
number line intervention group showed significantly larger learning gains than the control 107
group. Finally, computerized and game-based versions of the NLE task where used successfully 108
to assess and improve children’s fraction understanding [22–24]. Taken together this 109
substantiates that number lines are a powerful instructional tool and the NLE task can be applied 110
successfully to foster fraction (magnitude) understanding. However, successful fraction 111
magnitude learning might not only depend on improving conceptual knowledge of fractions, 112
but also on a more fundamental ability to be able to reach a beneficial cognitive state for 113
learning which is known as flow experience. 114
Flow experience as an indicator for optimal learning
115
Learning is not a pure cognitive process but is affected by motivation and emotions [25]. 116
A beneficial factor for learning that is considered specifically in computerized approaches on 117
learning is the flow experience of the learner [26]. Flow was first coined by Csikszentmihalyi 118
[27] and can be described as a positive emotional state [28,29] and as a holistic approach to 119
motivation [30]. In particular, flow is characterized by a combination of factors such as 120
increased concentration, reduced self-consciousness, sense of control, that are experienced as 121
intrinsically rewarding [29]. Flow is usually reached when task demands meet personal skills 122
or resources in a balanced way. Thus, when the skills of the learner are too low for the demands 123
of a given task – for instance at the beginning of a training – flow experience is rather low. The 124
same is true when the skills of the learner are too high for a given task which leads to boredom 125
and reduced flow experience. Therefore, flow experience seems to be an optimal state for 126
intrinsically motivated learning, which helps focus on the given task and can lead to improved 127
performance [31]. This is further supported by studies on the neural correlates of flow 128
experience. These studies could show that flow experience is associated with increased 129
activation in areas of the multiple demand system such as inferior frontal gyrus, putamen and 130
anterior insula and decreased activation in areas typically associated with the default mode 131
network such as amygdala, medial prefrontal cortex and posterior cingulate cortex [32,33]. 132
Flow experience was specifically, but not solely considered in different computer-based 133
learning settings. For instance, in game-based learning (for a review see [34]), collaborative 134
learning of problem-solving in virtual environments [35], hypermedia learning [36], e-learning 135
[37], but also in creative processes like music learning [38,39]. As such, flow experience should 136
also be beneficial for fostering fraction magnitude understanding using a computerized NLE 137
training. However, successful fraction magnitude learning might not only depend on improving 138
conceptual knowledge of fractions and on the learners’ flow experience, but also on the 139
successful interplay of certain neural correlates underlying the neuro-cognitive foundations of 140
fraction learning. Therefore, in the following the current state of research on neural correlates 141
of fractional learning is briefly outlined. 142
143
Neural correlates of fraction and proportion magnitude processing
144
Despite above described established relevance of fraction knowledge and longstanding 145
research in educational sciences and psychology, little is still known about the neural 146
mechanisms underlying the processing of proportions and fractions in general and the neural 147
correlates of fraction learning in particular. To date, there are only few neuroimaging studies 148
investigating the neural correlates of processing proportions [40–42] and fractions [43–46] in 149
adults. 150
One important aspect across most studies is that the numerical distance effect was used 151
as an indicator of automatic processing of overall fraction magnitude. The numerical distance 152
effect [47] describes the finding that two numbers are compared faster and more accurately the 153
larger the numerical distance between them (i.e., the farther apart they are on the mental number 154
line, e.g. 3 and 7 is easier to compare than 3 and 4). For instance, for fraction magnitude 155
comparison, Ischebeck et al. [45] observed that neural activation within the right IPS was 156
modulated by the overall numerical distance between the to-be-compared fractions (e.g., 157
numerical distance between 2
4 and 3
7), but not by the numerical distance between numerators
158
or denominators (i.e., numerical distance between 2 and 3 for numerators and numerical 159
distance between 4 and 7 for denominators when comparing 2
4 and 2
7). Moreover, Mock and
160
colleagues [41] observed a joint neural correlate of specific occipito-parietal activation 161
including the right intraparietal sulcus (IPS) for the processing of different notations of 162
proportions including not only fractions, but also pie charts, dot patterns and decimals. 163
Finally, Klabunde et al. [48] conducted a first fMRI training study on proportions in 164
participants with fragile X syndrome and a control group with intellectual disabilities. 165
Participants were trained for two days in 10 min sessions until they were able to have over 80% 166
accuracy on matching fractions to pie charts and pie charts to decimals. Neurofunctional 167
changes from before to after the training indicated significantly increased brain activation in 168
the left inferior parietal lobule, left postcentral gyrus, and left insula for both groups. However, 169
the mechanism of interest in this study was not the distance effect but to investigate neural 170
correlates of stimulus equivalence relations. 171
In summary, previous studies indicate that the distance effect for overall magnitude of 172
the to-be-compared proportions/fractions seems a good measure reflecting automatic 173
processing of overall fraction magnitude. As such, the numerical distance effect as a hallmark 174
effect for magnitude processing indicated that the (right) IPS seems to play a crucial role in the 175
processing of proportion and fraction magnitude independent of the actual task, which is in line 176
with its involvement in the processing of natural number magnitude [49]. As such, one might 177
argue that the presence of a numerical distance effect seems to indicate automatic processing 178
of overall fraction magnitude in proficient fraction processing (see [50] for a similar argument 179
on the relation between distance effect and arithmetic performance), while absence of a 180
numerical distance effect might indicate that the fractions’ magnitude is not automatically 181
accessed. 182
The present study
184
Against this background, we aimed at investigating neuro-functional correlates and their 185
plasticity associated with an NLE training of fraction magnitude understanding. In particular, 186
we evaluated changes in fraction magnitude processing on the neural level as reflected by the 187
numerical distance effect for overall fraction magnitude. To the best of our knowledge, this is 188
the first study investigating the neural correlates of fraction learning through a NLE training in 189
healthy adult participants. We assessed neural activation associated with fraction magnitude 190
processing using fMRI before and after a five-day consecutive NLE training on fractions. 191
Additionally, we assessed participants’ flow experience in each training session. 192
Similar to previous studies applying NLE training to children, we expected the training 193
to improve participants’ conceptual knowledge of fraction magnitude on a behavioral level 194
[20,21]. In particular, we expected significant improvements in NLE performance over the five-195
day training sessions. Additionally, we expected participants flow experience to be associated 196
with NLE training improvements over the five-day training. Finally, on the neural level, we 197
expected significant changes of IPS activation associated with the numerical distance effect 198
from pre- to post fMRI session indicating more automatic processing of fractions’ overall 199
magnitude after the NLE training. This should become evident by a more pronounced numerical 200
distance effect in behavioral measures but also neural activation in IPS after the training. 201 202 Methods 203 Participants 204
48 right-handed adult participants (M = 23.73, SD = 3.65, female = 32) took part in this 205
fMRI study. All participants were German native speakers with normal or corrected to normal 206
vision and reported no history of psychiatric or neurological disorders or drug abuse. The study 207
was approved by the local Ethics Committee of the Medical Faculty of the University of 208
Tübingen. Participants gave written informed consent and received monetary compensation for 209
Study Design 211
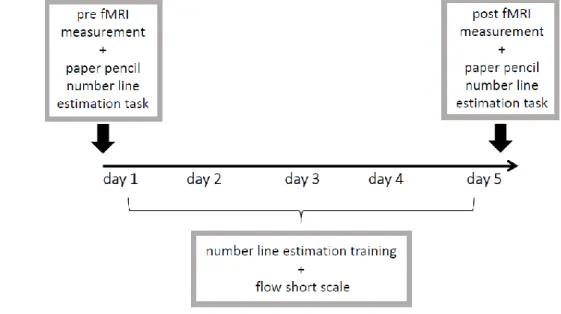
The study was designed as a pre-post fMRI training study with five consecutive days of 212
training between the fMRI measurements. On the first day before the training and on the last 213
day after the training, participants had to complete two different magnitude comparison tasks 214
(i.e., comparison of symbolic fractions and comparison of line proportions, respectively) and a 215
fraction-line proportion matching task (i.e., indicating whether the magnitude reflected by a 216
fraction matched that of a line proportion or not) while their brain activation was measured 217
using fMRI (see Figure 1). In addition to these computerized tasks, participants also completed 218
a paper-pencil-based NLE task prior to entering the scanner for pre- and post-test measurement 219
(for more details see below). Due to technical problems, behavioral data of fMRI measurements 220
could only be obtained from 24 right-handed adult participants (M = 22.50, SD = 3.76, female 221
= 16). Imaging results did not differ substantially between the participant group with and 222
without behavioral data (i.e., no supratheshold clusters at an uncorrected p < .001 and cluster 223
size of 10). Therefore, imaging results as well as all behavioral data obtained outside the scanner 224
(i.e., training data, flow experience and paper-pencil-based number line estimation task) will be 225
reported for all 48 participants, while behavioral fMRI results are reported for the respective 24 226
participants only. 227
The training consisted of a fraction number line estimation task. It took place outside 228
the scanner and each training session lasted around 15-20 minutes depending on participants 229
individual performance. After each training session participants completed a brief questionnaire 230
on mental flow to evaluate possible changes in flow experience over the training period (for 231
more details on the flow questionnaire see below). 232
233 234 235 236
237 238 239 240 241 242 243
Fig. 1: Study design. Before and after a five-day number line estimation training fMRI measurements were
244
conducted to evaluate neurofunctional changes in brain activation through the training. After each training session 245
flow was assessed using the flow short scale [51]. Prior to entering the scanner for the pre and post measurement 246
a paper-pencil number line estimation task was administered. 247
248
Item sets and stimuli 249
In this study, two different item sets (one to be trained and one not to be trained) were 250
used. The order of sets was counterbalanced across participants so that whichever set a 251
participant did not train on served as the untrained set at the pre- and post-test. However, each 252
participant was tested during the fMRI sessions on both item sets. Each item set consisted of 253
48 stimuli with items always presented in randomized order. To ensure comparable difficulty 254
of item sets, they were matched on overall problem size and numerical distance between 255
fraction pairs used. All fractions used in the stimuli sets were proper fractions with nominators 256
and denominators ranging from 1 to 30. To evaluate neurofunctional changes in fraction 257
magnitude processing, pre-post-test evaluation tasks performed in the fMRI scanner included 258
both trained and untrained items. Items of the two item sets can be found in the Appendix. 259
Training Procedure 260
For the training, we used two variations of a fraction number line estimation (NLE) 261
training with feedback, which differed in appearance and framing, but not in numerical content 262
and task. In particular, half of the participants were trained using an NLE task set within a 263
gamified environment (see Figure 2), while the other half were trained in the same NLE task in
264
a non-game environment (see Figure 2). For the gamified NLE task we used the Semideus 265
research engine, which was already applied successfully in previous studies for assessing and 266
training fraction knowledge [23,24,52–54]. 267
In both versions of the NLE task, participants had to indicate the correct position of a 268
given fraction on a number line ranging from 0 to 1 by maneuvering an avatar in the gamified 269
version and moving a white slider along the number line using the left and right arrow keys of 270
a computer keyboard in the non-game version. After reaching the estimated correct position, 271
participants had to press the space bar to select that position. Participants were instructed to 272
indicate the right position as quickly and accurately as possible within a time limit of 10 273
seconds. They received positive feedback (i.e., cheering avatar plus coins awarded in the 274
gamified vs. green checkmark in the non-game version) when their answer fell within a range 275
±5% around the correct position. In case they failed to answer or did not answer accurately 276
enough, negative feedback was given (i.e., avatar struck by lightning plus loss of virtual energy 277
in the gamified vs. red cross shown in the non-game version) and participants had to repeat the 278
item until it was correctly solved within the ±5% range. At each training session, participants 279
worked through 96 items in 12 runs containing 8 items each. Each item from the trained 280
stimulus set was encountered twice within a training session. Items were presented in 281
randomized order and were identical in both versions of the NLE training. 282
283
Fig. 2: Examples of different stages of the gamified (I.) and non-game version (II.) of the NLE training.
285
I. Gamified version: (A) Beginning of a new trial. A fraction is shown in the left upper corner and the avatar 286
Semideus has to be moved on a number line between 0 and 1 towards the anticipated position on the number line 287
of the shown fraction. (B) The result of a successful trial. If the position of the fraction is estimated correctly
288
(tolerated range: ±5 %) Semideus is rewarded with coins. (C) The result of a failed trial. In case the position of the 289
fraction is not estimated correctly Semideus is struck by lightning and the participant needs to try again. (D) 290
Completed level with feedback. Mountain: For completing the level, they earned one star; Coin: for collecting at 291
least 2000 points they earned a second star; Heart: for maintaining at least 80% of the life points, they earned a 292
third star. II. Non-game version: (A) Beginning of a new trial. A fraction is shown in the left upper corner and the 293
participant has to move the white slider on a number line between 0 and 1 towards the anticipated position on the 294
number line of the shown fraction. (B) The result of a successful trial. In case the position of the fraction is 295
estimated correctly (tolerated range: ±5 %) a green check mark appears. (C) The result of a failed trial. If the 296
position of the fraction is not estimated correctly a red cross appears and the participant must try again. (D) 297
Completed level. 298
299
Flow Short Scale 300
Flow was assessed using the German version of the flow short scale [51]. This 301
questionnaire consists of 16 items. Thirteen items are associated with the flow scale (7-point 302
Likert-scale ranging from 1 = totally disagree to 7 = totally agree), which has a three-303
dimensional structure: The first dimension assessed by the scale is fluency of performance (6 304
items, i.e., “My thoughts or activities run fluently and smoothly”, α = .92). The second 305
dimension is absorption by activity (4 items, i.e., “I'm completely focused on what I'm doing 306
right now”, α = .80). Finally, the third dimension is perceived importance or concern (3 items, 307
i.e., “I'm worried about failure”, α = .90). 308
Additionally, the questionnaire includes 3 items of a demand scale (10-point Likert-309
scale ranging from 1 = easy to 10 = difficult), which aims at assessing how demanding the 310
current task was for the participant (i.e., “For me personally, the current requirements are….”). 311
To monitor flow experience over the course of the training, participants had to complete the 312
flow short scale following each completed training session resulting in five completed flow 313
short scales per participant. 314
Paper pencil number line estimation task outside the fMRI scanner 315
In addition to the computerized in-scanner tasks (see below) participants had to 316
complete a paper pencil version of a number line estimation task prior to both fMRI 317
measurements (pre and post training), respectively. The number line ranged from 0 to 1 with 318
only the endpoints specified and participants had to indicate the spatial position on the number 319
line for all items from both item sets (i.e., the trained and the untrained set, thus 96 items in 320
total prior to and after the training). This task allowed to evaluate potential improvements in 321
spatial localization of fractions on the number line through the training. 322
Tasks performed inside the fMRI scanner 323
For the fMRI paradigm a block design was used, with four separate blocks for the three 324
different tasks (i.e., fraction-line proportion matching task, line proportion comparison task and 325
symbolic fraction magnitude comparison task). For each item in the fraction-line proportion 326
matching task we presented a matching (i.e., magnitude of symbolic fraction and line proportion 327
were identical) and a non-matching version (i.e., magnitude of symbolic fraction and line 328
proportion were not identical) in the fraction-line proportion matching task. Therefore, this task 329
took twice as long than both comparison tasks and was run in two blocks. 330
In the fraction-line proportion matching task, participants were shown a fraction and a 331
line proportion (see Figure 3a). They had to indicate whether the fraction and the line proportion 332
reflected the same magnitude or not (i.e., identical: left button, different: right button). In half 333
of the items, magnitudes of fraction and line proportion matched. In the line proportion 334
comparison task (see Figure 3b), participants were shown two line proportions and had to 335
decide which proportion was the numerically larger one by pressing a corresponding response 336
button (i.e., the right button when the upper and the left button when the lower line proportion 337
was larger). Similar, in the symbolic fraction magnitude comparison task (see Figure 3c), 338
participants were shown two fractions and had to decide which fraction was numerically larger 339
again. 340
Each block consisted of 4 practice followed by 48 critical trials. In both sessions, half 341
of the critical trials consisted of trained stimuli while the other half were untrained stimuli. 342
Stimulus order was random for each participant and each session. Additionally, 22 trails of a 343
scrambled word task were randomly interspersed in each block of each condition to control for 344
eye-movements and to control that participants would stay focused. During these trials, two 345
strings of scrambled letters were shown on top of each other and participants had to decide 346
which of the strings would form a real word (see Figure 3d). 347
To prevent adaptation of the BOLD signal, 6000 ms pauses (white screen, RGB values 348
= 255 255 255) were randomly interspersed between trials. All stimuli were projected on a 349
screen outside the scanner and made visible to participants through a mirror mounted on the 350
head coil of the scanner. Foam pads were used to minimize head movements within the head 351
coil during fMRI acquisition. Stimuli were presented in black font against a white background 352
(RGB values = 255 255 255). The experiment was programmed using Presentation® v16.1 353
software (www.neurobs.com). 354
355
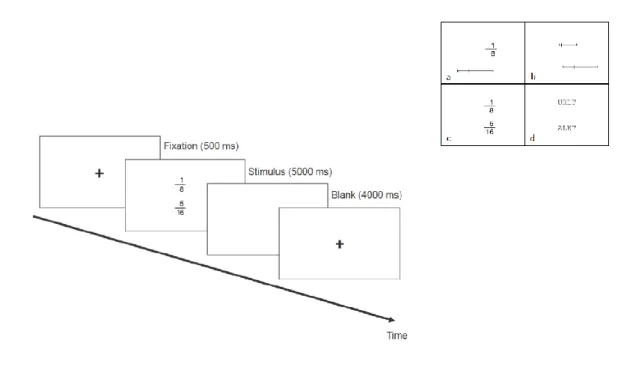
Fig. 3: Experimental procedure with examples (upper right box) for the different tasks. Example for a) the
356
fraction-line proportion matching task, b) the line proportion comparison task, c) the symbolic fraction magnitude 357
comparison task, and d) the scrambled letters control task. In this example the lower four letters can be unscrambled 358
to form the word “kalt” (German word for “cold”). The upper four letters cannot be formed to any word used in 359
German. 360
Each trial started with a fixation cross (500 ms), followed by the respective stimulus 362
which appeared for 5000 ms or until participants responded. Subsequently, a blank screen 363
appeared for 4000 ms followed by the beginning of a new trial (see Figure 3). Participants 364
responded by pressing one of two MRI compatible response buttons with either their left or 365
their right thumb. Participants were instructed to answer as fast and as accurately as possible. 366
367
MRI and fMRI Acquisition 368
A high-resolution T1-weighted anatomical scan was acquired by a 3T Siemens 369
Magnetom Prisma MRI system (Siemens AG; Erlangen, Germany) equipped with a 64–channel 370
head-neck matrix coil (TR = 2400 s, matrix = 256 × 256, 176 slices, voxel size = 1.0 × 1.0 × 371
1.0 mm3; FOV = 256 mm, TE = 2.92 ms; flip angle = 8°). The anatomical scan was always 372
performed at the end of each experimental session. 373
Functional T2*-weighted images were obtained using multiband gradient-echo Echo 374
planar imaging (EPI; TR = 792 ms; TE = 30 ms; flip angle = 58°; FOV = 192 mm, 64 × 64 375
matrix; 48 slices, voxel size = 3.0 × 3.0 × 3.0 mm3). Total scanning time was approximately 80
376
minutes. A baseline (rest) condition was accomplished by including about 20% null events in 377 the paradigm. 378 Analysis 379 Preliminary Analysis 380
Prior to the analysis of the behavioral and imaging data of the present study, possible 381
differences between the two variants of NLE training (gamified vs. non game-based training) 382
were examined both on the behavioral as well as the neuro-functional level. However, the 383
behavioral analysis after the training showed no significant differences in reaction times or error 384
rates for all three evaluation tasks performed in the scanner (i.e., symbolic fraction magnitude 385
comparison, line proportion comparison, and fraction-line proportion matching task, all p-386
values > .05, all Fs ≤ 2.85). In line with this, the analysis of imaging data revealed no significant 387
difference between the two groups after the training for any of the three evaluation tasks at an 388
uncorrected p-value of .001 with a cluster size of k = 10 voxels. Because neither behavioral nor 389
neurofunctional differences were observed for the two trainings, we decided to merge both 390
training groups in order to investigate fraction learning across groups with higher statistical 391 power. 392 393 Behavioral analysis 394
Training and flow data
395
To evaluate learning outcomes over the five training time points and associations with 396
participants’ flow experience during learning we used a latent growth linear mixed-effects 397
model over the five training time points. Regarding dependent variables, we were interested in 398
the mean percentage absolute estimation error (PAE; [55]) and the number of attempts 399
participants needed to estimate a given fraction correctly. Models were fitted in R using ‘lmer’ 400
from the ‘lme4’ package [56]. To provide p-values we used the ‘summary’ function of the 401
“lmerTest” R package [57]. Summary statistics were extracted via the ‘analyze’ function of 402
‘psycho’ [58]. 403
Number line estimation task
404
Mean PAE (cf. [55]) was calculated to reflect performance in the number line estimation 405
task at the two time points. Items without a response were not considered for analyses. To 406
evaluate performance changes in PAE between the pre- vs. post-test, a linear mixed-effects 407
model was fitted using ‘lmer’ from the “lme4” R package [56]. Again, to provide p-values we 408
used the ‘summary’ function of the “lmerTest” R package [57]. Additionally, summary 409
statistics were also extracted via the ‘analyze’ function of “psycho” R package [58]. 410
Behavioral fMRI data
412
For the analysis of the behavioral fMRI data we evaluated reaction times and accuracy 413
as dependent variables. Three separate linear mixed-effects models were run to analyze reaction 414
times for the three different evaluation tasks. Items without a response and items answered 415
incorrectly were not considered for reaction time analyses. To analyze error rates and to include 416
participants’ individual performance as random effect, we ran three separate generalized linear 417
mixed-effects models (GLMM) fitted by using the R package ‘lme4’ [56]. In the GLMMs we 418
assumed a binomial error distribution and used the logit as the link function. For both types of 419
analysis, we provided p-values with the ‘summary’ function of the “lmerTest” R package [57]. 420
421
Imaging analysis 422
fMRI data analyses were performed using SPM12 (http://www.fil.ion.ucl.ac.uk/spm). 423
Images were motion corrected and realigned to each participant’s mean image. The mean image 424
was co-registered with the anatomical whole-brain volume. Imaging data was then normalized 425
into standard stereotaxic MNI space (Montreal Neurological Institute, McGill University, 426
Montreal, Canada). Images were resampled every 2.5 mm using 4th degree spline interpolation 427
to obtain isovoxels and then smoothed with a 5 mm full-width at half-maximum (FWHM) 428
Gaussian kernel to accommodate inter-subject variation in brain anatomy and to increase signal-429
to-noise ratio in the images. Data were high-pass filtered (128 s) to remove low-frequency noise 430
components and corrected for autocorrelation assuming an AR(1) process.Brain activity was 431
convolved over all experimental trials with the canonical hemodynamic response function 432
(HRF) and its first time derivative. 433
For the first level analysis, pre- and post-fMRI training sessions were combined on the 434
subject level in a generalized linear model (GLM). For each participant, we considered the two 435
factors item-set (trained vs. untrained) and session (pre vs post). This resulted in four 436
experimental conditions: trained pre (T1), trained post (T2), untrained pre (UT1) and untrained 437
post (UT2). Additionally, to evaluate the influence of fraction problem difficulty we included 438
the covariate numerical distance between to-be-compared fractions as a parametric regressor in 439
the first level analysis. As a control variable the scrambled word problems (hereafter revered to 440
as “words”) were also included in the first level. Finally, the six movement parameters from 441
preprocessing were entered into the model to capture signal variations due to head motion. 442
These images then entered the second level random-effects group analysis using a
443
flexible factorial design. The SPM Anatomy Toolbox [59], available for all published
444
cytoarchitectonic maps (http://www.fz-juelich.de/ime/spm_anatomy_toolbox), was used for 445
anatomical localization of effects where applicable. For areas not yet implemented, the 446
anatomical automatic labelling tool (AAL) in SPM12 (http://www.cyceron.fr/web/aal 447
anatomical_automatic_labeling.html) was used. 448
All contrasts calculated reflect the parametric modulation of the fMRI signal by the 449
numerical distance between two proportions presented (distance effect). Simple contrasts 450
(distance effect in each notation) were family-wise error corrected at p < .05 at the whole-brain 451
level with a cluster size of k = 10 voxels. Complex contrasts comparing two distance effects 452
(e.g., distance effect in fractions after training vs. distance effect prior to the training) were 453
thresholded at an uncorrected p-value of < .001 at the voxel level with a cluster size of k = 10 454
voxels and were reported when they remained significant following family-wise error 455
correction (FWE) at the cluster-level with pcluster-corr < .05.
456 457 Results 458 Behavioral Results 459
Training and Flow Experience 460
Percentage absolute estimation error
461
Differences in PAE and possible associations with flow experience over time were 462
analyzed using a latent growth linear mixed effect model, predicting PAE by flow experience 463
to account for participants’ individual differences in prior knowledge. The model explained a 465
significant proportion of variance in PAE (R2 = 75.22%; fixed effects: R2 = 12.97%) and showed 466
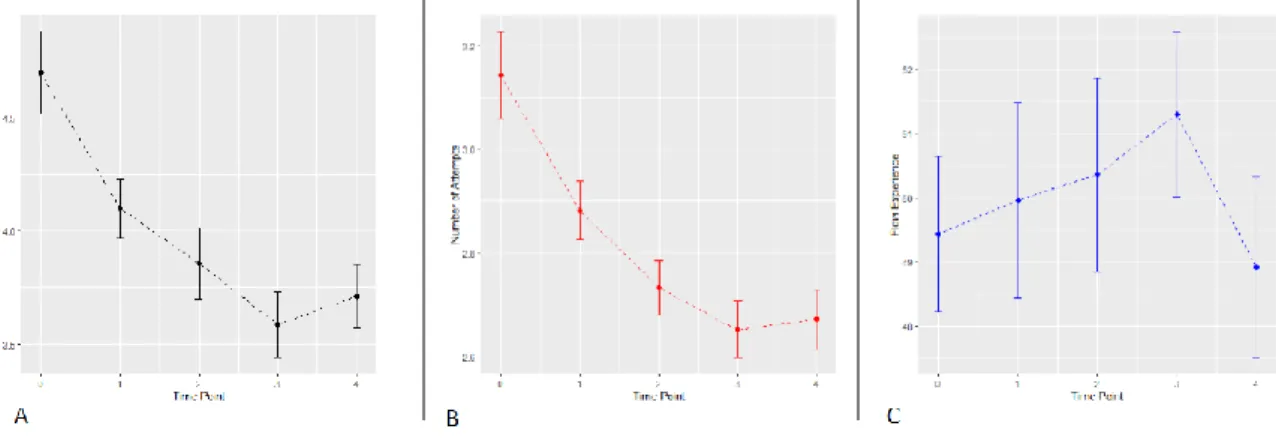
that PAE [β = - 0.34, SE = 0.15, t(193) = - 2.29, p < .05] significantly improved over time (see 467
Figure 4A for PAE changes over time). Moreover, the fixed effect of flow [β = - 0.02, SE = 468
0.01, t(198) = - 3.13, p < .01] was significant, indicating that flow experience changed over 469
time (see Figure 4C for general changes in flow experience over time). The interaction between 470
time and flow experience was not significant [t(193) = 0.62, p = .54]. 471
472
Number of attempts
473
Identical to the first analysis, differences in the number of attempts participants needed 474
to estimate the given fraction during the NLE training correctly over time and possible 475
associations with flow experience were analyzed using again a latent growth linear mixed effect 476
model. Number of attempts needed was predicted by participants’ flow experience and time 477
(i.e., five training time points) as fixed factors. Again, we included a random intercept to 478
account for participants individual differences in prior knowledge. The model explained a 479
significant proportion of variance in the number of attempts needed to estimate the given 480
fraction correctly (R2 = 71.24%; fixed effects: R2 = 16.16%) and showed that the number of 481
attempts significantly decreased over time [β = - 0.18, SE = 0.07, t(194) = - 2.70, p < .01; see 482
Figure 4B for number of attempts changes over time]. Within this model the fixed effect of flow 483
was significant [β = - 0.01, SE = 0.06, t(201) = - 3.40, p < .001], indicating that flow experience 484
changed over time (see Figure 4C for general changes in flow experience over time). Again, 485
the interaction between time and flow experience was not significant [t(194) = 0.95, p = .34]. 486
488 489
Fig. 4: Improvement of PAE (A), number of attempts needed (B), and changes in flow experience (C) over the
490
training period (i.e., five time points). Error bars indicate standard errors (SEM). 491
492
Number line estimation task 493
To investigate whether PAE for the paper pencil-based NLE tasks differed between pre- 494
and post-test we ran another linear mixed effect model. We defined the two time points (pre vs. 495
post) as fixed effect and included a random intercept for subjects to account for individual 496
variability. The overall model predicting differences in PAE on the two number line estimation 497
tests (pre vs. post) explained a significant proportion of variance (R2 = 63.34%, in which the
498
fixed effects explained R2 = 5.56% of the variance). The effect of session was significant [β = 499
- 0.01, SE = 0.00, t(47) = - 3.80, p < .001]indicating that performance was better on the posttest 500
than the pretest (reflected by smaller estimation errors). 501
502
Behavioral fMRI results 503
Fraction-line proportion matching task
504
Performance changes in reaction time between pre- and post fMRI sessions for the 505
fraction-line proportion matching task were evaluated by a linear mixed effect model. We
506
defined session (pre vs. post), itemset used (trained vs. untrained), and numerical distance (i.e., 507
only for the non-matching items) as fixed effects. Moreover, interactions between session and 508
item set as well as session and numerical distance were also included as fixed effects to evaluate 509
whether the possible influence of item set or numerical distance on participants reaction time 510
changed from pre- to post-test. Finally, we included a random intercept to account for 511
participants individual differences in prior knowledge. 512
The model explained significant proportions of variance on participants reaction times 513
(R2 = 26.18%; fixed effects: R2 = 9.74%) and showed that reaction times significantly improved
514
from pre- to post-test [β = - 260.85, SE = 89.37, t(1068) = -2.92, p < .01]. Additionally, the 515
fixed effect of numerical distance was significant [β = -1306.84, SE = 210.59, t(1069) = -6.21, 516
p < .001], indicating that reaction times improved more strongly for increasing distances.
517
Neither the fixed effect of itemset nor the interactions were significant [all t ≤ 0.48, all ps > .05].
518
For the evaluation of performance changes in accuracy between pre- and post-test, we 519
ran a generalized linear mixed-effects model, by using logit as the link function and assuming 520
a binomial distribution of the error rates. To avoid overfitting of the model we only included 521
session, itemset used and numerical distance as fixed effects and a random intercept accounting 522
for individual differences in prior knowledge. The model revealed a significant fixed effect of 523
numerical distance [z = - 6.86, p < .001], indicating that increasing distances between fractions 524
and line proportions led to less errors. The fixed effects of session and trained item were not 525
significant [all z ≤ -0.18, all ps > .05].
526
Line proportion comparison task
527
Identical to the analysis of the fraction-line proportion matching task we ran the same 528
linear mixed-effects model (including session, itemset used, numerical distance, as well as the 529
interaction session and item set and the interaction session and numerical distance as fixed 530
effects and a random intercept to account for individual differences in prior knowledge) to 531
investigate possible performance changes in reaction time on the line proportion comparison 532
task between pre- and post fMRI session. The model explained a significant proportion of
533
variance on participants reaction times (R2 = 42.71%; fixed effects: R2 = 8.57%) and showed
that reaction times significantly improved from pre to post-test [β = -279.33, SE = 118.19, 535
t(507) = -2.36, p < .05]. Additionally, the fixed effect of numerical distance was significant [β
536
= -1686.98, SE = 295.05, t(510) = -5.72, p < .001], indicating that reaction times got 537
significantly faster with increasing distances. Neither the fixed effect of itemset nor the 538
interactions were significant [all t ≤ 0.35, all ps > .05].
539
Again, to investigate possible performance changes in accuracy for the line proportion 540
comparison task between pre- and post-test, we ran a generalized linear mixed-effects model,
541
using logit as the link function and assumed a binomial distribution of the error rates. To avoid 542
overfitting of the model we only included session, itemset used and numerical distance as fixed 543
effects and a random intercept accounting for individual differences in prior knowledge. 544
Analyzing error rates for the line proportion comparison task revealed a significant fixed effect 545
of numerical distance [z = -7.5, p < .001], indicating that increasing distances between line 546
proportions led to less errors. However, there were no significant differences for session and 547
item set [all z ≤ -1.10, all ps > .05].
548
Symbolic fraction magnitude comparison task
549
Finally, possible performance changes in reaction time for the symbolic fraction 550
magnitude comparison task between pre- and post-test were tested identical to the prior two
551
evaluation tasks. We again ran a linear mixed-effects model with session, itemset used, 552
numerical distance as well as the interaction session and item set and the interaction session and 553
numerical distance as fixed effects and a random intercept accounting for individual differences 554
in prior knowledge. Interestingly, in this model only the fixed effect for numerical distance was 555
significant [β = -1282.76, SE = 337.30, t(499) = -3.80, p < .001], indicating that reaction times 556
were significantly faster for increasing distances. Neither the fixed effects of session and itemset 557
nor the interactions were significant [all t ≤ 0.43, all ps > .05].
Possible performance changes in accuracy for the symbolic fraction magnitude 559
comparison task between pre- and post-test, were evaluated again by a generalized linear
560
mixed-effects model, using logit as the link function and assuming a binomial distribution of 561
the error rates. To avoid overfitting of the model we only included session, itemset used and 562
numerical distance as fixed effects and a random intercept accounting for individual differences 563
in prior knowledge. Thus, analyzing error rates for the fraction task revealed a significant fixed 564
effect of session [z = -2.38, p < .05], indicating that participants performed better in the post-565
test compared to the pre-test. Additionally, the fixed effect of numerical distance was significant 566
[z = -9.17, p < .001], indicating that increasing distances between fractions led to less errors 567
when comparing two fractions. However, there was no significant difference for item set [z = 568 0.282, p = .079]. 569 570 Imaging results 571
Distance effect before the training 572
Fraction-line proportion matching task
573
Processing of smaller numerical distances between fractions and line proportions in the 574
fraction-line proportion matching task was associated with stronger magnitude-specific fMRI 575
signal before the training in a bilateral fronto-parietal neural network including areas in the 576
intraparietal cortex (hIP3), the superior parietal cortex (SPL), the inferior frontal gyrus (Areas 577
44 and 45), bilateral inferior temporal gyri as well as bilateral insula. Further activated clusters 578
were found in the bilateral middle frontal gyri as well as right-hemispheric subcortical areas 579
such as thalamus and caudate nucleus as well as the cerebellum (see Table 1, Figure 5A and C 580
depicted in red color). 581
Line proportion comparison task
Processing of smaller numerical distance between to-be-compared line proportions 583
modulated the fMRI signal before the training in a right-hemispheric fronto-parietal network 584
centered around the right intraparietal sulcus (hIP3). Smaller numerical distance between 585
proportions led to stronger activation in the right IPS and the right anterior IPS reflecting 586
fraction magnitude processing. Additionally, there was a significant cluster of activation in the 587
right inferior frontal gyrus (see Table 1, Figure 5B and C depicted in golden color). 588
Symbolic fraction magnitude comparison task
589
Activation in no cluster of voxels was modulated significantly by numerical distance at 590
the given threshold in the symbolic fraction magnitude comparison task before the training. 591
592
Importantly, there were no significant differences in brain activation observed between 593
the two stimulus sets: when comparing the two sets before the training (set to be trained vs. 594
untrained set) in any of the three conditions (i.e., fraction-line proportion matching task, line 595
proportion comparison task, symbolic fraction magnitude comparison task). 596
597 598
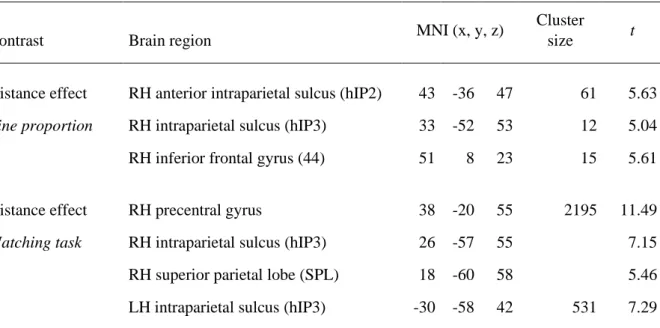
Table 1: Distance effect for line proportion comparison and fraction-line proportion matching task at a 599
familywise error corrected p < .05, cluster size k = 10 at the whole brain level. 600
601
Contrast Brain region MNI (x, y, z)
Cluster
size t
Distance effect RH anterior intraparietal sulcus (hIP2) 43 -36 47 61 5.63
Line proportion RH intraparietal sulcus (hIP3) 33 -52 53 12 5.04
RH inferior frontal gyrus (44) 51 8 23 15 5.61
Distance effect RH precentral gyrus 38 -20 55 2195 11.49
Matching task RH intraparietal sulcus (hIP3) 26 -57 55 7.15
RH superior parietal lobe (SPL) 18 -60 58 5.46 LH intraparietal sulcus (hIP3) -30 -58 42 531 7.29
LH superior parietal lobe (SPL) -25 -57 53 7.01 LH inferior frontal gyrus (IFG 44) -42 5 30 167 7.71 RH inferior frontal gyrus (IFG 44) 53 8 28 179 7.38 LH inferior frontal gyrus (IFG 45) -40 28 23 85 6.77
LH middle frontal gyrus -20 6 55 58 6.25
RH middle frontal gyrus 41 41 18 85 5.91
LH posterior medial frontal gyrus -7 8 58 271 7.24 RH inferior temporal gyrus 51 -52 -10 22 5.91 LH inferior temporal gyrus -50 -57 -10 30 5.79
RH thalamus 18 -22 10 68 7.57 RH caudate nucleus 8 16 3 20 6.24 RH insula 33 -20 15 86 6.76 RH insula 31 28 3 54 6.08 RH insula 41 1 10 13 5.75 LH insula -35 18 3 17 5.55 LH cerebellum -17 -52 -23 306 10.56
Abbreviations: LH – left hemisphere; RH – right hemisphere; MNI – montreal neurological institute). 602
603
Figure 5: Effect of overall magnitude processing in the fractions-lines matching task (Panels A and C: red) and
605
the lines proportion comparison task (Panels B and C: gold) as reflected by the distance effect. 606
607
Training and transfer effects 608
Line proportion comparison / fraction-line proportion matching task
609
When comparing the distance effect after the training to the distance effect before the 610
training, no suprathreshold clusters of activation were observed for the line proportion 611
comparison or in the fraction-line proportion matching task. 612
Symbolic fraction magnitude comparison task
613
Direct comparison of the distance effect after the training to the distance effect before 614
the training in the symbolic fraction magnitude comparison task revealed significant increased 615
activation differences in a bilateral fronto-parietal network centered around the intraparietal 616
sulcus (hIP3; see Table 2, Figure 6). Further clusters of significant increased activation 617
differences were observed in the right superior parietal lobe (SPL) and the left inferior parietal 618
lobe (PFt), the right fusiform gyrus, the bilateral frontal cortex and the left thalamus. 619
When comparing distance effects observed for the trained item set to those observed for 620
untrained item set after the training, no suprathreshold clusters of activation were observed, 621
indicating that the training effect was comparably strong for trained as well as untrained fraction 622
items. This means that for fraction magnitude processing it seemed that the training effect 623
generalized to untrained items after the NLE training. 624
625
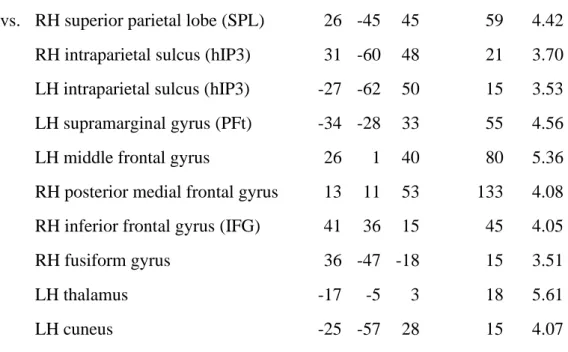
Table 2: Effect of training for processing of overall fraction magnitude as reflected by the distance 626
effect for the symbolic fraction magnitude comparison task. 627
Contrast Brain region MNI (x, y, z)
Cluster size t
Fractions post vs. RH superior parietal lobe (SPL) 26 -45 45 59 4.42 pre training RH intraparietal sulcus (hIP3) 31 -60 48 21 3.70 LH intraparietal sulcus (hIP3) -27 -62 50 15 3.53 LH supramarginal gyrus (PFt) -34 -28 33 55 4.56
LH middle frontal gyrus 26 1 40 80 5.36
RH posterior medial frontal gyrus 13 11 53 133 4.08 RH inferior frontal gyrus (IFG) 41 36 15 45 4.05
RH fusiform gyrus 36 -47 -18 15 3.51
LH thalamus -17 -5 3 18 5.61
LH cuneus -25 -57 28 15 4.07
Abbreviations: LH – left hemisphere; RH – right hemisphere; MNI – montreal neurological institute). 628
629
Figure 6: Effect of training for processing of overall fraction magnitude as reflected by the distance effect for the
630
symbolic fraction magnitude comparison task (pcluster-corr < .05, k = 10 voxels).
631 632 633
Discussion 634
The aim of the present study was to investigate potential neuro-functional changes of 635
brain activation in adult participants through a five-day consecutive NLE training on fraction 636
magnitude. While there already exist a number of studies indicating the effectiveness of NLE 637
training on the behavioral level [20–22,60] and some few studies investigating the neural 638
correlates of fraction and proportion processing [41,42,44,45], little is still known about the 639
neural correlates of fraction learning. 640
Evaluation tasks included symbolic fraction and non-symbolic line proportion 641
magnitude comparison tasks and a fraction-line proportion matching task. Additionally, 642
learning trajectories over the five time points of the NLE training, participants’ corresponding 643
flow experience as well as a paper pencil pre- post NLE task were evaluated. In the following, 644
behavioral as well as neurofunctional results for these measures will be discussed in more detail. 645
646
The interplay between training performance and flow experience
647
Flow experience has been described as an optimal state for intrinsically motivated 648
learning, which helps focus on the given task and can lead to improved performance [31]. 649
Another explanation for optimal learning was first described by Yerkes and Dodson in 1908 650
and refers to the relationship between arousal and performance (i.e., Yerkes-Dodson-Law; 651
[61]). This law states that learners’ optimal performance is achieved on a medium level of 652
arousal reflected by an inverted U-shape relation between the respective parameters. 653
Transferred to flow experience this inverted U-shape suggests that a balance between cognitive 654
demands of the task at hand and individual skill level is the basis for best possible flow 655
experience. Thus, when skills of a learner are too poor for the demands of a given task – for 656
instance at the beginning of a training – flow experience may be rather low. The same is true 657
when skills of a learner are too advanced for a given task. Both non-optimal states can lead to 658
boredom and/or frustration, and reduced flow experience. In turn, this might interfere with 659
learning of the given task [62]. 660
In line with these assumptions, our results for training performance and flow experience 661
over the five day NLE training indicated that at the beginning of the training participants’ flow 662
experience was significantly lower and PAE as well as number of attempts needed to solve a 663
trial successfully were significantly higher as compared to later training days. This possibly 664
reflects an imbalance between task demands and individual skills. PAE and number of attempts 665
needed on the first training day suggest that participants’ ability on the task seemed to be low 666
in the beginning. With each training day passing flow experience increased while at the same 667
time PAE and number of attempts needed decreased. Thus, participants experienced a more and 668
more optimal learning situation in which demands of the task and individual skill level were in 669
balance. 670
Interestingly, on the last training day participants’ flow experience dramatically 671
decreased again to values lower than on the first training day. This was accompanied by slight 672
increases of PAE and number of attempts needed. Thus, we assume that participants peak of 673
performance was already achieved at the 4th training day. We can only speculate whether this 674
was caused either by boredom or the fact that fraction magnitudes could not be estimated more 675
accurately by our participants after 4 days of training. Importantly, however, this decrease in 676
flow experience was not associated with a general decrease in training performance. Moreover, 677
we observed that participants significantly improved in the paper pencil NLE task from pre to 678
post session. 679
Transfer effects in fraction and proportion learning
680
Behavioral data indicated significant performance improvements for all three tasks. 681
Importantly, these improvements did not differ between trained and untrained items, indicating 682
transfer effects of the training to untrained items. Additionally, neurofunctional data showed 683
similar results: before the training no significant differences in brain activation were observed 684
between the two stimulus sets (trained and untrained set) for all three evaluation tasks. After 685
the training, again, no suprathreshold clusters of activation were observed when comparing 686
trained and untrained items for all three evaluation tasks. Thus, indicating that the training effect 687
was comparably strong for trained as well as untrained items and seemed to generalize to 688
untrained items after the NLE training. 689
Moreover, as discussed in more detail below, for the case of the fraction magnitude 690
comparison task we think brain activation associated with numerical distance after the NLE 691
training indicates that overall symbolic fraction magnitude was not automatically processed 692
before training. 693
However, one might argue that our results were elicited by the applied drill-like training 694
approach. In the literature, this is often used to investigate numerical learning in terms of 695
arithmetic fact learning [63,64]. Nevertheless, we are confident that participants did not just 696
learn specific fraction magnitudes by heart for at least two reasons: First, if fraction magnitudes 697
were learned by drill no transfer effect from trained to untrained items should be evident neither 698
on the behavioral nor on the neural level. Moreover, fractions that are learned by heart should 699
not show a numerical distance effect especially for untrained items because their overall 700
magnitude should not be processed. In our study induced automated magnitude activation was 701
also present for untrained items. Thus, it is unlikely that our training supported fact learning but 702
rather improved magnitude representation. 703
Second, previous literature reported different neural correlates for arithmetic fact 704
learning than observed in the current study. In particular, learning arithmetic facts is associated 705
with a shift from bilateral fronto-parietal processing around the IPS to a primarily left 706
hemispheric network in the medial temporary lobe (MTL) involving the hippocampus (cf. [64– 707
66]). However, in the present study, we rather observed a shift towards more activation within 708
the fronto-parietal network of magnitude processing [67–69] – thus, indicating more explicit 709
processing of overall fraction magnitude and not fact retrieval after the training. 710
This supports the notion that the training indeed resulted in a general conceptual 711
improvement and automatization of fraction magnitude processing, in contrast to training fact 712
retrieval of specific fraction magnitudes (cf. [64] for limited evidence of transfer effects in 713
multiplication fact training). 714
Differential neural activity patterns before training and possible implications
715
Surprisingly, and not consistent with the previous literature on neural correlates of 716
fraction processing brain activation before the training for the three tasks of interest revealed 717
different activation patterns in the IPS associated with the numerical distance effect. For the 718
non-symbolic line proportion comparison and the fraction-line proportion matching task we 719
found significant neural activation patterns in the typical fronto-parietal network observed 720
previously for proportion and fraction processing (cf. [40]). In particular, the line proportion 721
comparison task led to increased activation in the right intraparietal sulcus, whereas the 722
fraction-line matching task led to increased activation in the bilateral intraparietal sulcus. This 723
is in line with research on brain activation for symbolic and non-symbolic magnitude processing 724
[70]. 725
Interestingly, for the symbolic fraction magnitude comparison task activation in no 726
cluster of voxels was modulated significantly by numerical distance before the training. This 727
was surprising as previous studies on the neural correlates of fraction magnitude processing 728
consistently reported IPS activity to be modulated by numerical distance for fraction magnitude 729
processing. Importantly, the presented magnitudes did not differ between the three evaluation 730
tasks. This means, that participants of our study were generally able to process the presented 731
magnitudes. However, access to symbolic fraction magnitudes during the respective fraction 732
comparison task might be reduced probably because of the bipartite nature of fractions [10]. 733
Thus, fractions are more difficult to compare than for instance line proportions. 734
Moreover, our fraction items used in this study where more complex because of two 735
reasons: i) Our fraction pairs did not involve fractions with common components. In this case, 736
reasoning about the natural number components alone (i.e., processing numerators and 737
denominators separately) might often not help to find the right solution when comparing two 738
fractions without common components. However, we used fractions without common 739
components as we wanted to specifically investigate and promote overall fraction magnitude 740
processing. For instance, [71] found that mathematic experts showed a distance effect for 741
overall fraction magnitude while comparing fractions without common components but not for 742
fraction pairs with common components. Moreover, comparing fraction pairs with common 743
components is typically susceptible to what has been called the natural number bias [72]. ii) 744
We used fractions with numerators and denominators ranging from 1 to 30. This had two major 745
reasons: a) the difficulty to match two item sets of fraction pairs on both overall numerical 746
distance and problem size including only fractions without common components and b) the fact 747
that we wanted to make sure that fractions were rather unfamiliar to participants to be able to 748
investigate fraction learning on a neural level. Thus, participants may not have had a specific 749
representation of the magnitude of the presented fractions prior to our study. 750
Training induced distance effect in the intraparietal sulcus for fraction magnitude processing
751
In line with previous results of training studies, imaging results after the training showed 752
that the processing of overall symbolic fraction magnitude was improved. In particular, distance 753
related neural activation for symbolic fraction processing became significantly stronger from 754
pre- to post-test in the bilateral intraparietal sulcus. This may indicate that our NLE training 755
helped to establish easier access to the representation of overall fraction magnitude. These 756
results are inconsistent with a NLE training study on natural numbers with pre-post-test fMRI 757
comparing children with and without developmental dyscalculia [73]. After the NLE training 758
both groups showed decreased activation of brain areas involved in number magnitude 759