HAL Id: cea-02489515
https://hal-cea.archives-ouvertes.fr/cea-02489515
Submitted on 24 Feb 2020HAL is a multi-disciplinary open access archive for the deposit and dissemination of sci-entific research documents, whether they are
pub-L’archive ouverte pluridisciplinaire HAL, est destinée au dépôt et à la diffusion de documents scientifiques de niveau recherche, publiés ou non,
concrete steel bond model
C. Mang, Ludovic Jason, L. Davenne
To cite this version:
C. Mang, Ludovic Jason, L. Davenne. Shear wall mock up subjected to monotonic loading with con-crete steel bond model. PANACM 2015 - First Pan-American 3Congress on Computational Mechanics, Apr 2015, Buenos Aires, Argentina. �cea-02489515�
SHEAR WALL MOCK UP SUBJECTED TO MONOTONIC LOADING
WITH CONCRETE STEEL BOND MODEL
CHETRA MANG¹, LUDOVIC JASON² AND LUC DAVENNE
³
1 CEA, DEN, DANS, DM2S, SEMT, LM2SF-91191 Gif sur Yvette, France and
LEME, Université Paris Ouest F-92410 Ville d’Avray, France
chetra.mang@cea.fr
2
CEA, DEN, DANS, DM2S, SEMT, LM2S F-91191 Gif sur Yvette, France
and
IMSIA, UMR CNRS-EDF-CEA-ENSTA 9219 F-91762 Palaiseau, France
ludovic.jason@cea.fr
3
LEME, Université Paris Ouest F-92410 Ville d’Avray, France
luc.davenne@u-paris10.fr
Key words: Reinforced concrete, Bond slip, Shear wall mock up, Crack opening
Abstract. This paper presents a numerical simulation of a shear-wall mock-up subjected to
monotonic loading with a new steel-concrete bond model. First, global responses (force-displacement curves) are compared to the experimental results and show a good agreement between simulation and experiment. In order to compare the local responses such as crack orientation, crack spacing and crack opening, a new post-processing method is presented. It is based on the definition of the crack path from the displacement field or the change in the sign of the bond slip. The crack opening is then obtained using the displacement in the normal direction of the crack. The method is applied on the shear wall and the results are compared to the experimental data obtained with digital image correlation. A good agreement is once again obtained.
1 INTRODUCTION
Reinforced concrete is widely used in civil engineering structures but may be concerned by cracking especially when concrete is subjected to tensile loadings. Crack initiation and propagation are related to the interface between steel and concrete which is responsible for stress transfer, especially during cracking. Taking into account the bond slip in a numerical simulation is thus a key point when cracking wants to be correctly captured. This paper briefly introduces the bond slip model developed in [1] in the first section. Then two crack opening methods [2] are briefly described. These methods are finally applied to a shear-wall
mock-up simulated with the new bond slip model. The influences of the bond effect is especially studied.
2 DESCRIPTION OF BOND SLIP MODEL
When reinforced concrete structures are considered, one of the most classical hypotheses is to model the steel reinforcement as truss elements and to consider a perfect relation between steel and concrete. This perfect relation is applied through cinematic relation between steel and concrete, using the shape function of each element. But this hypothesis may have significant consequences when the crack properties (crack spacing and opening) are studied as the steel-concrete bond directly influences their evolution [3, 4]. To take into account the interfacial behavior, the model developed in [1], based on the previous worked from [5] is used. It is a zero thickness four node element which relates each truss element with an associated superimposed segment, perfectly bonded to the surrounding concrete (Figure 1). Each node of the interface element has three degrees of freedom (nodal displacements) (Figure 2). The relation between the generalized slip {𝛿(𝑝)} in the local direct frame (Figure 3) and the nodal displacements {𝑢} is written in the following form:
{𝛿(𝑝)} = {𝛿𝑡(𝑝) 𝛿𝑛1(𝑝) 𝛿𝑛2(𝑝)} = 𝐵̿(𝑝){𝑢} (1) with 𝐵̿(𝑝) = [𝐵̿1(𝑝) 𝐵̿2(𝑝) −𝐵̿2(𝑝) −𝐵̿1(𝑝)] (2) and 𝐵̿1(𝑝) = 0.5(1 − 𝑝)𝐼̿3 𝐵̿2(𝑝) = 0.5(1 + 𝑝)𝐼̿3 (3) where 𝐼̿3= [ 1 0 0 0 1 0 0 0 1] and −1 ≤ 𝑝 ≤ 1 (Figure 3)
Figure 2: Degrees of freedom of the interface element [1]
Figure 3: Definition of the slip between steel and concrete in the interface element in the (𝑡⃗ 𝑛⃗⃗1) plane [1]
A constitutive law is defined between the bond stress {𝜎(𝑝)} = {
𝜎𝑡(𝑝)
𝜎𝑛1(𝑝)
𝜎𝑛2(𝑝)
} and the bond
slip {𝛿(𝑝)}= { 𝛿𝑡(𝑝)
𝛿𝑛1(𝑝)
𝛿𝑛2(𝑝)
}. In the tangential direction, the tangential stress 𝜎𝑡 is computed from
the tangential slip 𝛿𝑡using the recommendation from [6].
𝜎𝑡(𝑝) = 𝑓(𝛿𝑡(𝑝)) (5)
In the normal directions, for the sake of simplicity, a linear relation is supposed between the normal stresses and the corresponding normal slips:
{𝜎𝑛1(𝑝) 𝜎𝑛2(𝑝) } = 𝑘𝑛{ 𝛿𝑛1(𝑝) 𝛿𝑛2(𝑝) } (6)
The value of the normal stiffness is chosen high enough to be representative of a perfect bond. Additional information can be found in [1].
3 DESCRIPTION OF CRACK OPENING METHOD
A generic crack opening method is proposed to compute the crack properties (crack spacing and crack opening) of reinforced concrete structures in a complex crack pattern (crack oriented).
Before computing crack opening, crack path is determined. Two approaches are proposed for crack paths: discontinuity of displacement in the vicinity of the cracked zones or changes in sign of the bond slip. The first one is close to the experimental method developed for digital image correlation [7, 8] (see detail in [2]). The second method is more original and takes advantage of the developed bond slip model presented in the previous section. Crack position corresponds to the changes in sign of the bond slip (Figure 5). In this case, the bond slips are computed along the steel bars to locate the changes in sign. These points correspond to the crack position at the interface between steel and concrete. Compared to the first one, this method is of more direct application.
Figure 5: Definition of the change in the tangential slip sign
For both methods, from the crack positions, the crack path is determined by relating each point of a crack in its “influence” zone. This zone can be determined from the distribution of the mechanical damage for example (Figure 6).
Crack opening is then defined as the opening in the normal direction of the crack. At each point of the crack path, the normal and the tangential crack directions 𝑛⃗⃗𝑐 , 𝑡⃗𝑐 and the crack angle 𝜃𝑐 are computed. The normal direction is determined from the bisector of the adjacent segment of the crack path (Figure 7). The tangential direction is calculated to obtain the direct reference frame. The crack opening is then computed from the relative displacement in the normal direction at the crack position. The detail of the methodology of the crack opening can be found in [2].
Figure 7: Definition of the crack normal direction
It is to be noted that contrary to the method developed in [9, 10], the calculation of the crack opening does not imply the definition of the element length as it is directly based on the displacement and not the strain. The particularity of the method is the definition of the “post-processing line” along which the relative displacement is computed. It has to be chosen long enough to include the potential effect of regularization in the neighborhood of the crack. Hence, it becomes applicable in the case of a regularized computation ([11] for example) in which strains are not fully localized.
4 APPLICATION TO A SHEAR WALL
The new bond slip model and the new crack opening method are applied on the reinforced concrete shear-wall mock-up tested during the French national project (CEOS.FR) [12].
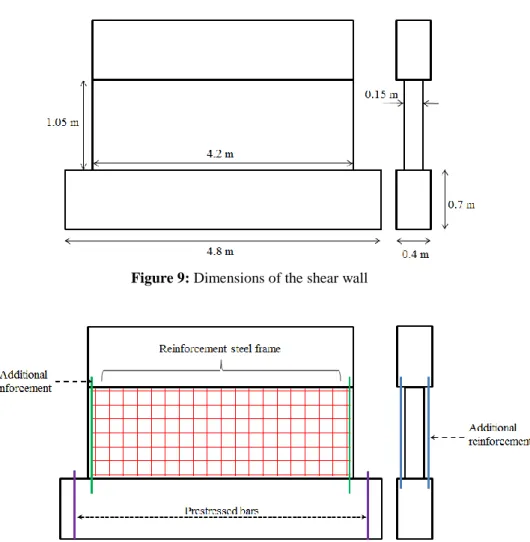
The dimensions of the current part of the wall are 4.2m x 1.05m x 0.15m (Figure 9). The reinforcement consists in a double steel frame (10 mm diameter) and 100 mm of space in both horizontal and vertical directions. To prevent crack opening due to bending, additional reinforcements are added at each extremity of the wall (25mm and 32mm bar). Two horizontal high strength concrete beams are connected to upper and bottom parts of the wall to ensure a correct distribution of the shear force [13].
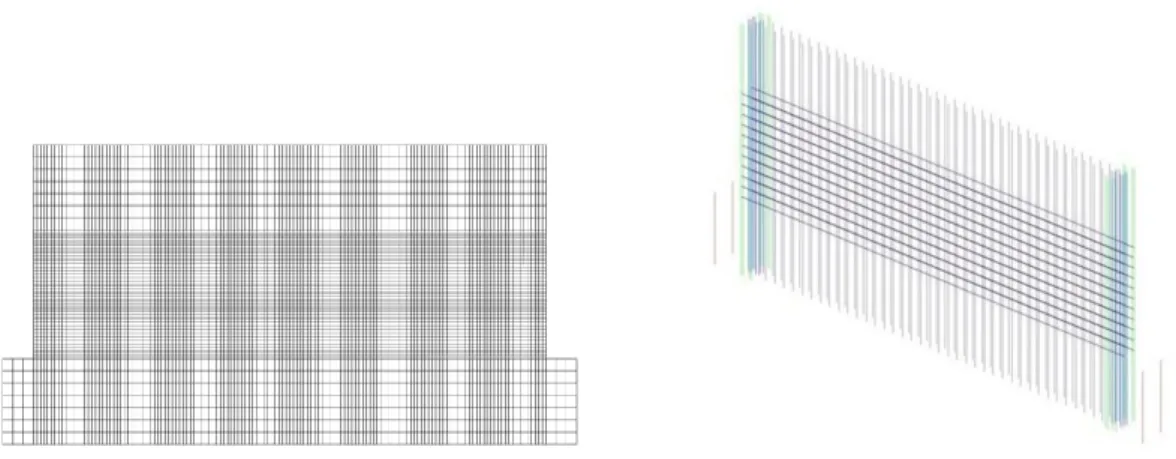
A 3D simulation is performed using the finite element code Cast3M [15] using solid elements for concrete (30mm x 30mm x 30mm mesh) and truss elements for reinforcement (Figure 11). Steel is modeled using an elastic plastic model with linear hardening. The associated parameters are listed in table 1. Concrete, in the central part of the shear wall, is represented using a damage constitutive law developed in [16].
Figure 8: Shear wall experimental setup [14]
Figure 9: Dimensions of the shear wall
Figure 11: Concrete (left) and steel (right) meshes.
Figure 12: Loading and boundary conditions
This law was chosen because it was successfully applied in previous work [4]. Material parameters are provided in table 2. Top and bottom beams are considered elastic during the simulation. For the bond slip model, the bond slip law is chosen using the recommendations from [6]. The parameters are given in Table 3 and the resulting curve in Figure 13.
An increasing horizontal displacement is applied to the wall (Figure 12). A vertical force p (520kN) is applied on each pre-stressed bar. A zero horizontal displacement is also applied on the right extremity of the bottom beam as in the experiment.
Table 1: Steel parameters
Young modulus Poisson ratio Limit of elasticity Hardening modulus Es (GPa) s se(MPa) Eh (MPa)
190 0.3 554 3245
Table 2: Concrete parameters
Young modulus Poisson ratio Tensile strength Compressive strength Ec (GPa) c ft (MPa) fc (MPa)
22 0.19 3.3 42.5
Table 3: Parameters of the bond slip – bond stress law
Bond stress (MPa) 2 10 13.2 16.3 2 2
Bond slip (mm) 0.02 0.1 0.25 0.511 1.5 1.8
Slope (Pa/m) 1012 8.1 1010 2.1 1010 1.2 1010 -109 0
5 RESULTS AND DISCUSSION 5.1 Experimental comparison
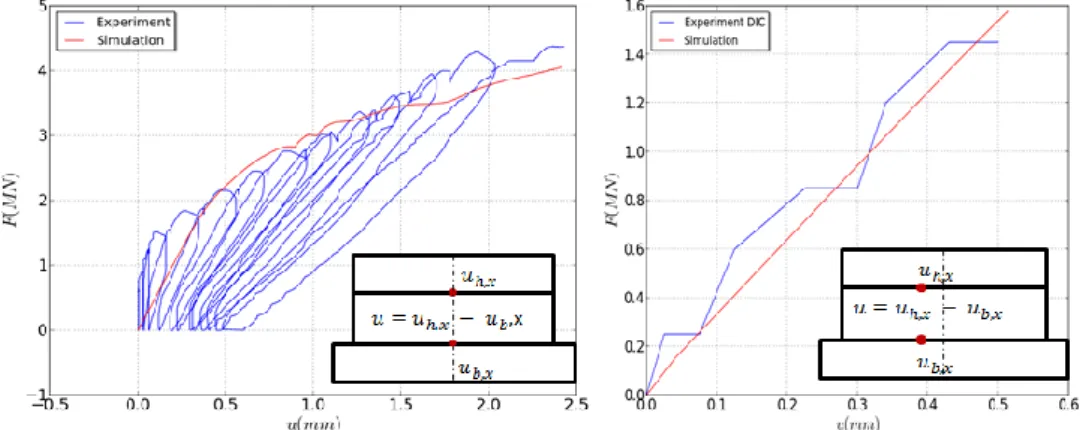
Figure 14 illustrates the applied forces as a function of the relative displacement (difference in the horizontal displacement of the top and the bottom parts of the wall).
The global behavior is well reproduced by the simulation with especially a correct value of the maximum applied force before failure. The elastic behavior given by the sensor measurement is not totally satisfactory. It was thus checked using the relative displacement provided by the digital image correlation (Figure 14 right). In this case, the elastic evolution is correct.
The crack propagation is also correctly reproduced (Figure 15): in both simulation and experiment, an initial diagonal crack is observed at a force of 900 kN. At 2100 kN, a new crack appears on the opposite side. Finally, cracks propagate again from the loaded side.
Figure 15: Order of apparition of the cracks. Experiment (top) and simulation (distribution of the norm of the
relative displacement) (bottom)
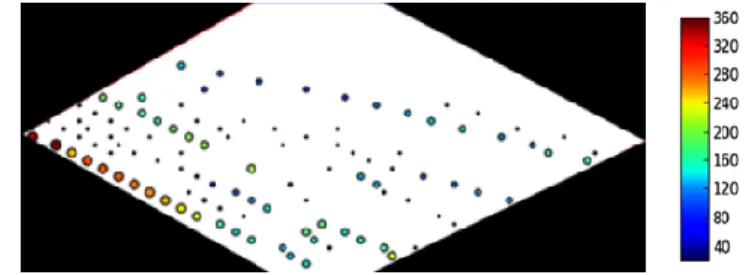
In order to calculate the crack properties using the new crack opening method, crack paths are first determined. From the crack path method with “discontinuity” of displacement, the crack paths in the interest zone are obtained. The normal crack opening can then be computed using the methodology described in the previous section. The distribution of the normal crack opening in the zone of interest is illustrated in figure 16. From this result, the crack spacing, the mean crack opening, the maximum crack opening and the crack orientation are computed. The comparison with the experiment is shown in table 4 and 5. A good agreement is once again obtained.
Table 4: Crack spacing and angle
F = 3900 kN Crack angle Mean crack spacing
c (degree) (mm)
Experiment 28.5 97.4
Simulation 25 96
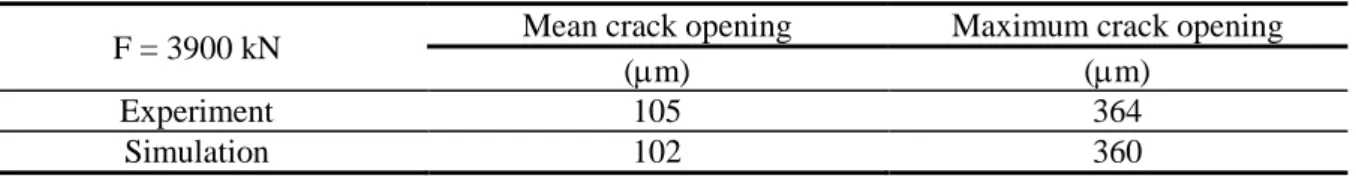
Table 5: Crack opening: Comparison between simulation and experiment
F = 3900 kN Mean crack opening Maximum crack opening
(m) (m)
Experiment 105 364
Figure 16: Distribution of the normal crack opening (F = 3900 kN)
5.2 Influences of bond effects
In this section, the influence of the bond model is investigated by comparing to a simulation using the classical perfect relation. This so called “perfect” bond is applied using additional cinematic relations which impose the same displacement between steel and concrete (no slip).
Figure 17 provides the comparison in terms of force-displacement curves. The same evolution is globally obtained and there is no significant difference. The elastic zone is the same due to the high value of the slope in the bond stress – bond slip curve.
Figure 17: Comparison between the perfect relation and the bond slip model for the force-displacement curve
Figure 18 illustrates the comparison of the crack pattern (distribution of the norm of the relative displacement) at ultimate load. The crack path is not identical (differences in positions and amplitudes). A concentration at the application of the load is more significant with the perfect bond. It was expected as the perfect relation stiffens the bond between steel and concrete and may induce heavy damage.
Finally, figure 19 illustrates the distribution of the relative displacement. It shows the number of points, in percent, whose associated relative displacement is less than the indicated value. The perfect relation leads to a higher number of small crack openings (less than 200
m) compared to the bond model. In this case, steel induces a regularization which is more significant than in the case of the bond model, especially when the damage develops. For a relative displacement equal to 900 m, the accumulated percentage for the bond model is about 100% while it is lower for the perfect bond.
Figure 18: Comparison of the crack patterns considering the perfect relation (top) and the bond slip model
(bottom) (norm of the relative displacements) at the ultimate load
It is due to the high level of degradation near the application of the load as previously reported. These differences underline the interest of taking into account the bond slip model in the simulation.
Figure 19: Evolution of the cumulative percentage of the norms of the relative displacement at the ultimate load
6 CONCLUSION
In this contribution, a shear-wall mock-up has been simulated by a new bond slip model. A comparison to the experimental results was also performed. Global responses are in good agreement. A new crack opening method was also introduced and applied to the shear-wall. A good agreement was once again achieved between experiment and simulation. Finally, the role of the steel-concrete bond has been discussed. No clear difference was observed between the simulations using the bond slip or the perfect relation. On the contrary, in terms of crack distribution, the perfect relation leads to a heavier mechanical degradation near the loading point and to a more regularized distribution in the current part, which is less in agreement with the experiment.
AKNOWLEDGEMENTS
REFERENCES
[1] Mang, C., Jason, L. and Davenne, L. A new bond slip model for reinforced concrete structures. Verification and validation on an experimental reinforced concrete tie. Submitted to Engineering Computations (2014).
[2] Mang, C., Jason, L. and Davenne, L. A new bond slip model for reinforced concrete structures. Verification and validation on an experimental reinforced concrete tie. Submitted to Engineering Computations (2014).
[3] Eurocode 2. Calcul des structures en béton, NF-EN-1992, 2007.
[4] Jason, L., Torre-Casanova, A., Davenne, L. and Pinelli, X. Cracking behavior of reinforced concrete beams. Experiment and simulations on the numerical influences of the steel concrete bond. International Journal of Fracture (2013) 180(2):243-250.
[5] Casanova, A., Jason, L. and Davenne, L. Bond slip model for the simulation of reinforced concrete structures. Engineering Structures (2012) 39:66-78.
[6] Torre-Casanova, A., Jason, Davenne, L. and Pinelli, X. Confinement effects on the steel concrete bond strength and pull-out failure. Engineering Fracture Mechanics (2013)
97:92-104.
[7] Ruocci, G., Rospars, C., Bisch, P., Erlicher, S.and Moreau, G. Crack distance width in reinforced concrete membranes: experimental results from cyclic loading histories.
Proceedings of the fifteenth WCCE conference, Lisboa, Portugual (2012).
[8] Rethoré, J., Hild, F. and Roux, S. Extended digital image correlation with crack shape optimization. International Journal for Numerical Methods in Engineering (2007) 73:248-272.
[9] Matallah, M., La Borderie, C. and Maurel, O. A practical method to estimate crack opening in concrete structure. International Journal of Numerical and Analytical Methods
in Geomechanics (2010) 34:1615-1633.
[10] Wang, T. and Hutchinson, T.C. Gas leakage rate through reinforced concrete shear wall: numerical study. Nuclear Engineering and Design (2005) 235:2246-2260.
[11] Pijaudier-Cabot, G. and Bazant, Z.P. Nonlocal damage theory. Journal of Engineering (1987) 113:1512-1533.
[12] CEOS.FR French National Project, www.ceosfr.org, 2014
[13] Ruocci, G., Chebl, D., Bisch, P. and Erlicher, S. Experimental investigation and engineering interpretation on shear cracking in RC walls due to cyclic loadings.
Proceedings of SMiRT 2013 conference (2013).
[14] Belletti B., Esposito R., Damoni C., Numerical prediction of the response of a squat shear wall subjected to monotonic loading through PARC_CL model, Proceeding of the VIII
International Conference on Fracture Mechanics of Concrete and Concrete Structures (FraMCoS-8) (2013)
[15] Cast3M, www-cast3m.cea.fr, 2014
[16] Faria, R., Oliver, J. and Cervera, M. A strain based plastic viscous damage model for massive concrete structures. International Journal of Solids and Structures (2006)
![Figure 1: Principle of the interface element between steel and concrete [1]](https://thumb-eu.123doks.com/thumbv2/123doknet/12913384.372677/3.892.102.806.454.1006/figure-principle-interface-element-steel-concrete.webp)