HAL Id: cea-01877346
https://hal-cea.archives-ouvertes.fr/cea-01877346
Submitted on 1 Feb 2021
HAL is a multi-disciplinary open access
archive for the deposit and dissemination of
sci-entific research documents, whether they are
pub-lished or not. The documents may come from
teaching and research institutions in France or
abroad, or from public or private research centers.
L’archive ouverte pluridisciplinaire HAL, est
destinée au dépôt et à la diffusion de documents
scientifiques de niveau recherche, publiés ou non,
émanant des établissements d’enseignement et de
recherche français ou étrangers, des laboratoires
publics ou privés.
Distributed under a Creative Commons Attribution| 4.0 International License
Dynamics of self-reorganization explains passivation of
silicate glasses
S. Gin, Marie Collin, Patrick Jollivet, Maxime Fournier, Yves Minet, Laurent
Dupuy, Thiruvilla Mahadevan, Sebastien Kerisit, Jincheng Du
To cite this version:
S. Gin, Marie Collin, Patrick Jollivet, Maxime Fournier, Yves Minet, et al..
Dynamics of
self-reorganization explains passivation of silicate glasses. Nature Communications, Nature Publishing
Group, 2018, 9, pp.2169. �10.1038/s41467-018-04511-2�. �cea-01877346�
Dynamics of self-reorganization explains
passivation of silicate glasses
Stéphane Gin
1, Marie Collin
1, Patrick Jollivet
1, Maxime Fournier
1, Yves Minet
1, Laurent Dupuy
2,
Thiruvilla Mahadevan
3, Sebastien Kerisit
4& Jincheng Du
3Understanding the dissolution of silicate glasses and minerals from atomic to macroscopic levels is a challenge with major implications in geoscience and industry. One of the main uncertainties limiting the development of predictive models lies in the formation of an amorphous surface layer––called gel––that can in some circumstances control the reactivity of the buried interface. Here, we report experimental and simulation results deciphering the mechanisms by which the gel becomes passivating. The study conducted on a six-oxide borosilicate glass shows that gel reorganization involving high exchange rate of oxygen and low exchange rate of silicon is the key mechanism accounting for extremely low apparent water diffusivity (∼10−21m2s−1), which could be rate-limiting for the overall reaction. These findings could be used to improve kinetic models, and inspire the development of new molecular sieve materials with tailored properties as well as highly durable glass for appli-cation in extreme environments.
DOI: 10.1038/s41467-018-04511-2 OPEN
1CEA, DEN, DE2D, SEVT, 30207 Bagnols sur Cèze, France.2Tescan Analytics, ZAC St Charles, 13710 Fuveau, France.3Department of Materials Science and
Engineering, University of North Texas, Denton, TX 76203, USA.4Pacific Northwest National Laboratory, Physical & Computational Sciences Directorate,
Richland, WA 99352, USA. Correspondence and requests for materials should be addressed to S.G. (email:stephane.gin@cea.fr)
123456789
I
n nature, silicate glasses and minerals dissolve incongruently by various interrelated processes such as water diffusion in the solid, ion exchange, hydrolysis, condensation, and precipita-tion of secondary phases1–6. The global dissolution kinetics of the primary solid depends on its composition, its structure, and also on thefluid properties (e.g., pH, composition, and flow rate)7. As a result, the less-soluble elements will form new phases on the reacting surface, either by dissolution–reprecipitation3,4,6 or by local rearrangement8,9. These phases can be amorphous or crystalline, dense, or porous10. These products change the solu-tion composisolu-tion; this can affect both the driving force for further dissolution and the mass transfer between the bulk solution and the reactive surface1,6. To date, the role of surface layers remains insufficiently understood to derive rate laws that can accurately predict the fate of silicate phases in various natural or engineered environments10,11. This is, however, an important need in many fields: in geochemistry to calculate the budget of some elements in the rivers and in the oceans, for the geological sequestration of CO2, for the safety assessment of geological disposal of nuclearwaste, etc. In the case of borosilicate glass used to confine nuclear wastes, several hypotheses are still under debate to account for the 3–5 orders-of-magnitude decrease of the dissolution rate mea-sured in confined environments: (i) saturation of the solution in silica thereby decreasing the chemical driving force for the dis-solution reaction12, (ii) pore closure within the gel layer limiting the transport of aqueous species9, (iii) water diffusion in the pristine solid13, (iv) diffusion of dissolved silica through the gel layer leading to higher concentrations at the reaction front2, and more recently (v) slow mobility of water molecules in the gel due to their confinement in constricted micropores14,15. The reasons why so many hypotheses are still under consideration are that high-resolution and high-sensitivity analytical tools available to investigate reacting buried interfaces are limited, and the com-position and properties of alteration layers depend on many
intrinsic and environmental parameters, complicating any attempt of a general theory5,16.
Here, we propose an approach based on three experiments with isotopically tagged water molecules to study their mobility and their reactivity in a passivating gel formed on International Simple Glass (ISG), a six-oxide borosilicate reference glass17, as well as molecular dynamics (MD) simulations and continuum-scale modeling to support experimental findings. Although iso-topes have been used previously to investigate glass or mineral alteration mechanisms6,18–21, another approach relying on the quantification of the passivating properties of the alteration layer is proposed here. The first experiment studies the dynamics of water in a gel formed during a 1-year-long alteration of ISG glass monoliths, and the second and the third experiments explore the dynamics of self-reorganization of a young and a mature gel, respectively. All the gels have been obtained by alteration of ISG at 90 °C, pH 7 in a solution initially saturated with respect to amorphous silica and containing K (called reference conditions in the following). It was demonstrated in a previous study that these conditions lead to the formation of a micrometer thick, uniform, and chemically homogeneous, passivating gel layer free of sec-ondary phases14. Monoliths tested in experiments 1 and 3 come from the experiment described in Gin et al.14, whereas experi-ment 2 is a short-term experiexperi-ment conducted in similar condi-tions. From this study, we infer that hydrolysis–condensation reactions within the gel strongly affect the transport of water molecules and thereby limit glass dissolution.
Results
Water dynamics in a mature gel. For thefirst experiment, we have selected a passivating gel formed by ISG glass alteration in the reference conditions. In this medium, after 1 year, the glass dissolution rate dropped by a factor∼1000 relative to the initial dissolution rate and a 1.5-µm-thick gel-like material formed on
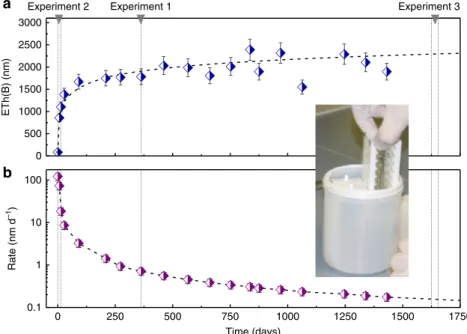
0 500 1000 1500 2000 2500 3000 ETh(B) (nm) 0 250 500 750 1000 1250 1500 1750 0.1 1 10 100 Rate (nm d –1) Time (days)
Experiment 2 Experiment 1 Experiment 3
a
b
Fig. 1 Experiment from which pieces studied in experiment 1 and 3 were taken. This initial experiment was conducted in the so-called“reference conditions” (90 °C, pH90 °C7, 160 mg L−1of Si and 6 g L−1of K). The image displays the reactor, the sample holders, and a few glass pieces. More details are provided
in Gin et al.14. Experiment 2, although conducted on new fresh glass pieces corresponds to the early stages of the initial experiment.a Time evolution of the equivalent thickness of altered glass calculated from B concentration in solution. A few data points deviate from the overall trend because of the low concentration of B and the high dilution factor (∼11) prior to ICP-OES analyses. b Glass dissolution rate derived from the correlation displayed in a. Error bars represent s.d.
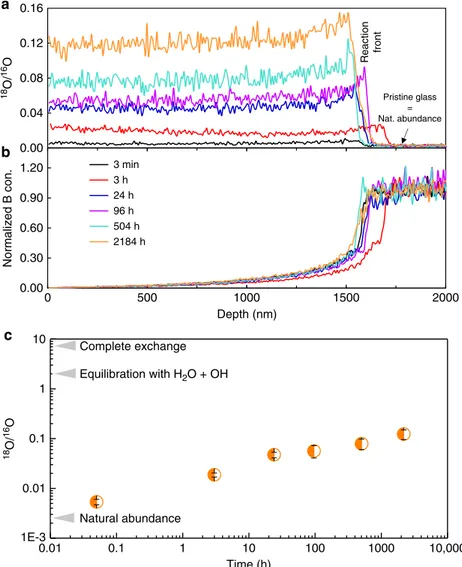
the glass surface (Fig. 1). Note that this value is more accurate than that estimated in a previous study14due to a larger number of data points giving a long-term trend. This film was partly characterized in a previous study22and its characterization was completed by the assessment of water content, speciation, and mean pore size22,23 (Table 1 and Supplementary Note 1). This experiment therefore probes a uniform, 1.5-µm-thick amorphous gel formed by reorganization of the Al–Zr–silicate glassy network following the release of B, Na, and Ca and the incorporation of some K supplied by the leachate14. In this material, pore size is of the order of 1 nm. Six pieces of this altered glass were subse-quently immersed at 25 °C in H218O (18O/16O ~ 7) for various
durations up to 3 months and the oxygen isotopic profiles were recorded by time-of-flight secondary ion mass spectrometry (ToF-SIMS). Complementary analyses were carried out to vali-date the analytical protocol and verify the accuracy of the 18O/
16O measurements (Supplementary Note2).
Figure 2a shows that, for all contacting durations, 18O exchanged with16O in the gel and penetrated up to the reactive interface, which was well defined by a sharp change in the B concentration (Fig.2b). Moreover, the measurable increase of18O in the gel is observed even at the shortest contacting time (3 min) and its concentration significantly increases with time. We also note that all 18O/16O profiles are mostly flat with a slight but significant increase in the 200 nm near the reactive interface, likely due to the greater number of exchangeable O atoms in this less-mature area. According to the mean value of the O isotopic ratio measured in the gel, the time evolution of the percentage of exchanged O atoms was calculated assuming that only O from molecular water and silanols could exchange (Fig.2c). It is found that only ~0.2% of these supposedly mobile O atoms had exchanged quickly (≤3 min). This fraction increases with time but remains below 6% even after 3 months (Table 2).
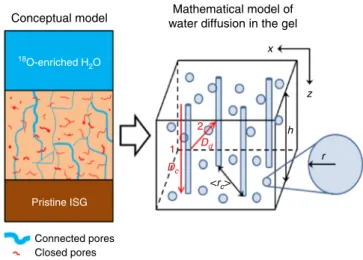
A model for water diffusion in passivating gel. The results from experiment 1 are consistent with a pore network made of a few deeply penetrating open channels and a large amount of dead-end or closed pores in which water molecules and silanols cannot exchange easily (Fig. 3). The basic assumption is that water molecules randomly explore the open porosity, and react with (Si, Al, and Zr)–O–Si bonds to open (by hydrolysis reactions) and close (by condensation reactions) pores within the gel. A model
was developed according to these hypotheses (Supplementary Note3). In this approach, the gel is assumed to contain spherical pores with a single mean pore radius. Some fraction of the pores are connected in aggregates that run from the solution/gel interface to the gel/pristine glass interface and are thus treated as cylinders for simplicity. The diffusion coefficient of water in connected pores (exchange mode 1), Dc, is derived from afit to
the O isotopic profile recorded at 3-min contacting time using the Crank solution of Fick’s second law for a one-dimensional Car-tesian case (Supplementary Fig. 4). Although the exact value cannot be determined, a value ≥10−11m2s−1 is expected to account for the flat experimental profile. Owing to the fast diffusion in connected pores, these pores rapidly equilibrate with the 18O-enriched solution and can serve as a continuous source of 18O that diffuses through the gel, via gel reorgani-zation, to reach closed pores. The diffusion coefficient for water diffusion out of the connected pores and into the gel (exchange mode 2), Dd, was calculated using an approximation to the
Crank solution of Fick’s second law in cylindrical geometry (see full derivation in Supplementary Information 3). This analysis led to values of Ddthat decreased with time following a power
law (Supplementary Fig. 5), which could be indicative of a decrease in water diffusivity through the gel due to self-reorganization. Dddecreased to ~10−21m2s−1within 24 h and
reached 6 × 10⁻²³m2s−1 after 3 months. Because isotopic equilibration was not achieved even after 3 months, it is likely that water diffusion could slow down further with time.
To summarize, the gel behaves as a molecular sieve for water molecules with a few open pathways allowing rapid diffusion and many closed pores that reduce water diffusivity by at least eight orders of magnitude. This raises two questions: (i) do simulations at the pore scale support the idea that water diffusivity can be≥10
−11m2s−1 in open but narrow channels of the order of 1-nm
width, and (ii) is there any experimental evidence that the gel undergoes hydrolysis and condensation reactions once it is formed, as was indirectly seen in mesoporous silica?24
In order to address the first question, water diffusion coefficients D in amorphous silica micropores of diameter ranging from 0.5 to ~4 nm were evaluated by MD simulations with reactive potentials25,26(Supplementary Note 4). Pure silica was selected as reliable potentials have been developed for the silica-water system and as the actual gels are made of more than
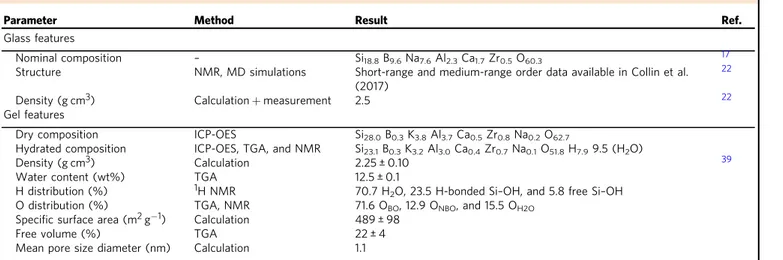
Table 1 Main features of the pristine and altered glass
Parameter Method Result Ref.
Glass features
Nominal composition – Si18.8B9.6Na7.6Al2.3Ca1.7Zr0.5O60.3 17
Structure NMR, MD simulations Short-range and medium-range order data available in Collin et al.
(2017)
22
Density (g cm3) Calculation+ measurement 2.5 22
Gel features
Dry composition ICP-OES Si28.0B0.3K3.8Al3.7Ca0.5Zr0.8Na0.2O62.7
Hydrated composition ICP-OES, TGA, and NMR Si23.1B0.3K3.2Al3.0Ca0.4Zr0.7Na0.1O51.8H7.99.5 (H2O)
Density (g cm3) Calculation 2.25 ± 0.10 39
Water content (wt%) TGA 12.5 ± 0.1
H distribution (%) 1H NMR 70.7 H2O, 23.5 H-bonded Si–OH, and 5.8 free Si–OH
O distribution (%) TGA, NMR 71.6 OBO, 12.9 ONBO, and 15.5 OH2O
Specific surface area (m2g−1) Calculation 489 ± 98
Free volume (%) TGA 22 ± 4
Mean pore size diameter (nm) Calculation 1.1
Details about the determination of H and O atoms distribution, specific surface area, free volume, and mean pore size are given in Supplementary Note1. Pore size is too small to be experimentally determined. The value of∼1 nm is in good agreement with diffusion experiments with dyes14
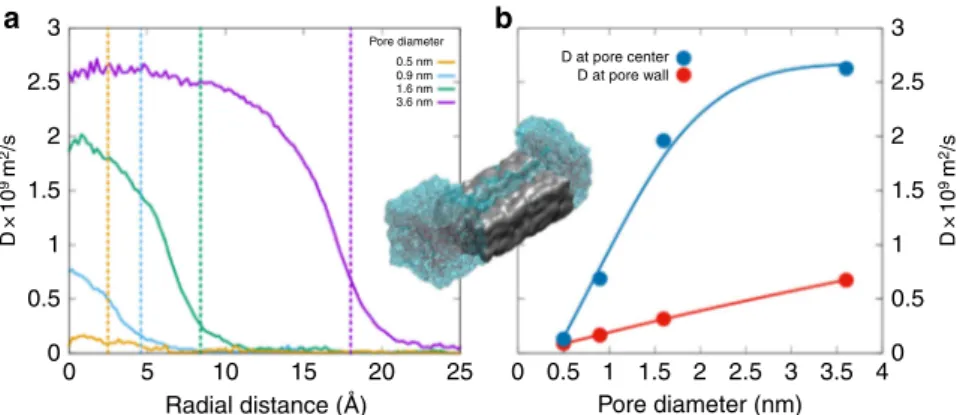
90% of SiO2(Table 1). D values are plotted as a function of the
radial distance from the center of the cylindrical pores (Fig. 4a). An unconstrained bulk diffusivity of ~2.5 × 10⁻⁹m2s−1 27,28 is attained only at the center of the largest pore. While similar
results have been obtained with non-reactive potentials29 with controlled addition of silanols, the use of reactive potentials in this work allows for dissociation of water, proton exchange, and formation of surface silanols. Close to the wall, water molecules form hydrogen bonds with oxygen in the silanols and other oxygen from the glass (Fig. 4a, b). The formation of hydrogen bonds of water with relatively immobile species in the glass leads to lowering of water diffusivity by an order of magnitude for water molecules that are closer to the pore wall. These slow water layers induce a drag on other water molecules and reduce diffusivity in the center, especially in smaller pores. If the pore diameter is large enough, water molecules at the center of the pore are hydrogen bonded only to the nearby mobile ones and hence have a diffusivity closer to that of water in bulk. These results show that, as long as the pores remain open and larger than 0.5 nm in diameter, water diffusion is not dramatically affected by interactions with pore walls. This important result Table 2 Fraction of exchanged mobile O
Contacting time (h) Fraction of OH2O+ –OHexchanged
0.05 0.002 3 0.009 24 0.023 96 0.027 504 0.038 2184 0.059
This fraction is based on the O speciation given in Table1. The dilution of the isotopic ratio of the tracing solution by the pore water is negligible. Uncertainties are+/- 50%
0.00 0.30 0.60 0.90 1.20 0 500 1000 1500 2000 Normalized B con. Depth (nm) 3 min 3 h 24 h 96 h 504 h 2184 h b 0.01 0.1 1 10 100 1000 10,000 1E-3 0.1 0.01 1 10 c 18 O/ 16 O Time (h) Complete exchange Equilibration with H2O + OH Natural abundance 0.00 0.04 0.08 0.12 0.16 18 O/ 16 O a Pristine glass = Nat. abundance Reaction front
Fig. 2 Water mobility in the gel. Water mobility is recorded by time-dependent isotopic and elemental ToF-SIMS profiles (experiment 1). For a and b, only lines are displayed for a better readability, and the analytical step is 7 nm.a Quantitative18O/16O profiles in the gel for the different contacting durations.
The mean value of the O isotopic ratio in the pristine glass (2.2 × 10⁻³) is within uncertainty of the natural abundance (2.05 × 10⁻³).b Normalized boron profiles for the same durations. The alteration front, given by the normalized concentration of 0.5 is located at 1574 ± 20 nm. The shifts between the different profiles give the analytical error of the technique, which is small. For a given contacting time, the B profile is well anti-correlated with the18O/16O profile, indicating that some tagged water molecules reached the glass dissolution front at all tested durations. Some B is retained in the gel as evidenced by the B concentration on the gel side of the gel/pristine glass interface, which does not fall to zero. This likely corresponds to undissolved glass clusters15. c Evolution of the mean value of the oxygen isotopic ratio within the gel as a function of contacting time with the H218O solution. Error bars are calculated
from uncertainites on natural abundance in the pristine glass
supports the idea that the value of Dcderived from the modeling
of the isotopic tracing experiments corresponds to water diffusion in open but constricted micropores, whereas Dd is tied to
diffusion between closed pores limited by bond breaking. Furthermore, MD simulations were performed to obtain ISG glass and gel structures and analyzed the bottleneck and interstitial site density to understand available sites for water diffusion (Fig.5and Supplementary Note4). Two gel structures were simulated from the glass. The first type of gel structure, called “Na-removed” in the following was obtained by removing Na atoms only from the ISG structure. The second type, chemically closer to the actual gel, and called “gel” in the following was prepared by removing all Na and B, 30% of Ca, and the free oxygen ions, i.e., oxygen ions that are not bonded to any other atom within a distance of 2.5 Å. The structures were generated using classical MD simulations with recently developed partial charge composition dependent potentials. A zoomed-in region of the 24,000 atoms simulation cell is shown in Fig.5b. A Voronoi–Delaunay tetrahedron analysis30,31 was performed to find the bottleneck size and interstitial site and density distributions. The results, which represent the available bottle-necks for water molecule diffusion, are shown in Fig.5a. In the bulk glass structure, the density of bottlenecks with size larger than the size of a water molecule is relatively small. The density increases in the Na-removed structure. In the gel structure, the density of bottlenecks and bottlenecks with larger sizes are much higher, and both contribute to provide channels for water diffusion. The density of bottleneck size with 1.28-Å radius (about the size of a water molecule) is 1.2, 2.2, and 2.8/nm3for ISG, Na-removed, and gel, respectively. These results are consistent with a recent MD study showing that a silica gel structure has randomly connected pores with certain pore size distributions that form channels for water diffusion32. Overall, this study at the nanometer scale suggests that the release of mobile species during glass alteration creates narrow channels in which water diffuses slightly slower than in the bulk, but not slow enough to account for the extremely low values derived from the
18O-tracing experiments (<10−21m2s−1). Moreover, the release
of mobile species leads to a reorganization of the silicate network which might affect the diffusion pathways.
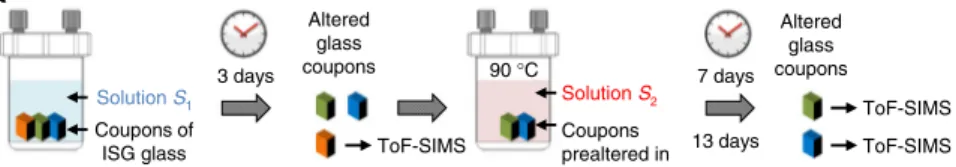
Role of gel restructuring on passivation. To address the second question, i.e., whether the gel undergoes hydrolysis and con-densation reactions once it is formed, two experiments were conducted in the reference conditions, one focused on the early stages of gel formation (experiment 2), and the other focused on a mature gel (experiment 3). For experiment 2, two solutions were prepared: solution S1 with natural water (18O/16O= 2 × 10⁻³)
and solution S2with18O-enriched water so that18O/16O= 0.24.
Three polished pieces of unaltered ISG were first altered in solution S1for 3 days, after which one piece was withdrawn for
ToF-SIMS depth-profiling analysis, while the other two were transferred to solution S2 for an additional 4 or 10 days of
alteration. Overall, O isotopic ratios were recorded in gels formed after 3, 7, and 13 days of alteration (Fig. 6). The gel thickness obtained from the B profiles was 500, 600, and 740 nm at day 3, 7, and 13, respectively (Fig.6a). As expected, the gel analyzed after 3 days had the O isotopic signature of natural water. Importantly, no enrichment of 29Si was noticed in the gel (Fig. 6b, inset), confirming previous results indicating that, in silica-saturated and near-neutral pH conditions, Si from the glass does not dissolve, diffuse, and redeposit14.
When in contact with solution S2, the glass continued to alter
but the isotopic signature of the gel originally formed in solution S1increased to a mean value of 0.15, which is very close to that
recorded in the 100 nm of a new gel formed between days 3 and 7. From 7 to 13 days, the18O/16O ratio increased further in the part of the gel formed in natural water by an amount that is beyond the noise of the signal (0.15→ 0.17) as well as in the gel formed between day 3 and 7 (0.13→ 0.18). According to the O speciation in the gel (Table 1), and assuming that water molecules and silanols exchangefirst, a mass balance analysis indicates that 62% of the bridging O of the gel network was hydrolyzed and exchanged between days 3 and 7 and thisfigure increased to 70% at day 13. This is direct evidence that the young gel undergoes hydrolysis and condensation reactions that allow for isotopic exchange. Because Si atoms of the gel do not exchange with Si species in solution, it must be concluded that all the Si−O bonds of a given Si atom in the gel are not broken simultaneously. An alternative explanation, whereby all Si−O bonds are hydrolyzed, H4SiO4(aq) is released in pore water, and then quickly condenses
has been ruled out in a previous study14.
Experiment 3 explored the behavior of a mature gel. This gel resulted from the alteration of ISG that altered 1625 days in the reference conditions (Fig.1). A piece of 1625 d was immersed for 1 month in a solution at 90 °C, pH 7, saturated with respect to amorphous silica, and spiked with 18O, so that 18O/16O= 0.24. The O isotopic ratio was then recorded by ToF-SIMS depth profiling (Fig.7). The shape of the O profile in the gel is similar to that obtained in tracing experiment 1 conducted at room temperature (Fig. 2a) but the 18O enrichment is much higher due to a greater reactivity at 90 °C than at room temperature20. In experiment 3, 21.1% of all O atoms available in the gel have been exchanged after 1 month. This value is close to the fraction of mobile O calculated from the budget of water molecules and silanols (28.4%, Table 1). However, experiment 1 demonstrated that a large faction of mobile O atoms are not easily accessible. To exchange these atoms between close and dead-end pores, network reorganization is necessary. This means that a total exchange of mobile O would necessarily be associated to some exchange of the O from the network, resulting in a higher18O/16O ratio than that at equilibration. As a consequence, the mean 18O/16O obtained
Conceptual model 18 O-enriched H2O Pristine ISG Connected pores <rc> x 1 2 z Dd Dc h r Closed pores Mathematical model of water diffusion in the gel
Fig. 3 A model for water diffusion in passivating gels. Conceptual model for interpreting water diffusion in passivating gel (left) and the corresponding mathematical model used to determine the water diffusion coefficients (right). The gel is assumed to contain spherical pores with mean pore radius,r, and a fraction of the pores are connected in aggregates that run from the solution/gel interface to the gel/pristine glass interface and are thus treated as cylinders with mean separation distance, <rc>. Exchange
modes 1 and 2 with diffusion coefficients DcandDd, respectively, are
here (5.3 × 10⁻²) suggests that a fraction of mobile O and bridging O of the gel network were exchanged, although the exact amounts are unknown.
According to experiments 2 and 3, it is shown that both an early-formed and a mature gel could undergo hydrolysis and condensation reactions, suggesting that the gel reorganization is a continuous process affecting the pore connectivity and thus the mobility of water molecules. Although more research is needed to determine the kinetic constant and the activation energy of each type of reaction involving O, our results show that the consumption of water molecules in the exchange with silanols and bridging oxygens affects theflux of water molecules reaching the pristine glass surface. Indeed, a simple calculation based on the results of experiment 1 estimates that the flux of water molecules through the 1-year-old passivating gel is decreased by approximately four orders of magnitude compared to a non-passivating gel formed in a Si-free solution (Supplementary
Note4). Previous studies proposed that hydrolysis, diffusion, and redeposition of Si were the key processes leading to the densification of the outer part of the gel, thereby closing open pores formed by the release of mobile species and eventually stopping further glass corrosion simply by preventing water molecules from reaching the pristine glass surface9,33,34. This paradigm must be revised as the present work shows that gel reorganization could be a continuous phenomenon involving a high reactivity of O and low mobility of Si. The simplistic idea that the gel is a rigid, strain-relaxed, and porous structure once formed, either totally inherited from the glassy network or re-precipitated, must also be revised, as its passivating properties mostly depend on reactions between water molecules and (Si, Al, and Zr)−O−Si bonds with bonding oxygen of the network. It is also expected that both the topology of the pore network and its dynamics of maturation depend on parameters such as glass composition, solution composition and pH, and temperature.
3
a
b
2 1 0 1.4 Bottlenec k (#/nm 3) 1.6 1.8 2.0 r (Angstrom) Bulk ISG ISG no Na GelFig. 5 Bottleneck distribution in International Simple Glass and gel. a Bottleneck density distribution with bottlenecks larger than 1.28-Å radius for bulk ISG, Na-depleted ISG, and ISG gel structures. The inset shows a tetrahedron with a water molecule in the bottleneck (side face) and interstitial (center of the tetrahedron) sites.b Snapshot of a zoomed-in region of an ISG glass structure from MD simulations showing glass-forming network made up of [SiO4]
(yellow), [AlO4] (blue), [BO4] and [BO3] (brown), and [ZrO6] (green) and charge compensator or network modifier elements, Na (pink) and Ca (golden).
Oxygen atoms are displayed in red (see also Supplementary Fig.6) 3 a b 2.5 2 1.5 1 0.5 D×1 0 9 m 2/s D×1 0 9 m 2/s 0 3 2.5 2 1.5 1 0.5 0 0 5 10 0 0.5 1 1.5 2 2.5 3 3.5 4
Radial distance (Å) Pore diameter (nm)
Pore diameter D at pore center D at pore wall 0.5 nm 0.9 nm 1.6 nm 3.6 nm 15 20 25
Fig. 4 Water diffusivity in amorphous silica micropores. a Self-diffusion coefficient of water as a function of distance from the center of the pore in cylinder pores of amorphous silica with diameters of 0.5, 0.9, 1.6, and 3.6 nm from reactive forcefield-based molecular dynamics simulations. At the center of the pore, diffusing water molecules do not see the reactive sites in the wall and are relatively less constrained. The inner walls of the pore are oxygen terminated with atomic-scale roughness and reaction with water results in changes in the surface structure. Water molecules have been observed to diffuse up to a nanometer into the silica structure beyond the surface and further change the surface structure. The dashed lines corresponding to the color of the curves represent the approximate location of the pore wall.b Mean water diffusion coefficients at the pore wall and at the center of the pore for various pore sizes. In-betweenfigures a and b, a snapshot of the 0.9-nm pore system with a section of the silica structure removed to show water in the pore. The silica structure is shown as the gray block and water on either side is shown as molecules inside the transparent blob
Adjustment of these parameters––especially the relative proportion of low-strength bonds (e.g., Si−O−B) that might lead to rapid reorganization but also to extensive dissolution and high-strength bonds (e.g., Si−O−Zr)––could lead to the development of new materials, for instance, for controlled drug release or the fabrication of glasses resistant to extreme conditions. For nuclear glass, the design of a smart engineered barrier supplying the glass surface with elements rending the gel dense and chemically-and-radiation-resistant might contribute to improving the safety demonstration of geological repositories and eventually public acceptance.
Methods
Glass and experimental design. ISG glass was prepared by MoSci Corporation (Rolla, MO, USA)17. Pieces were cut and polished to optical grade. The alteration experiment dedicated to the formation of the passivating gels studied in experiment 1 and 3 of the present work was conducted with 16 pieces placed in per-fluoroalkoxy (PFA) vessel, in controlled conditions: (90 ± 1) °C, pH90 °C7 ± 0.2, 6 g
L−1K, and 160 ± 10 mg L−1of29Si corresponding to the saturation of amorphous
silica. The reader is referred to Gin et al.35for more details about this experiment.
In this initial experiment, glass alteration was monitored by solution sampling.
Solution S1 Coupons of ISG glass 3 days Altered glass coupons ToF-SIMS Altered glass coupons ToF-SIMS ToF-SIMS
Solution S1: H216O saturatedin amorphous 29SiO
2, pH 7
Solution S2: H218O saturated in amorphous 29SiO2, pH 7
Solution S2 Coupons prealtered in solution S1 90 °C 7 days 13 days 0.0 0.2 0.4 0.6 0.8 1.0 1.2 1.4 Normalized B b
Gel layer Pristine glass
–0.01 0.03 0.07 0.11 0.15 0.19 0.23 0 200 400 600 800 1000 1200 1400 18 O/ 16 O Depth (nm) Coupon 1: 3 days Coupon 2: 7 days Coupon 3: 13 days Solution abundance Natural abundance c a 500 nm 600 nm 740 nm 0.0 0.1 0.2 0.3 0 200 400 600 800 29Si/ 28 Si Depth (nm) Natural abundance 3 days
Fig. 6 Dynamics of self-reorganization of a young gel. Dynamics is monitored by ToF-SIMS depth profiling (experiment 2). a Experimental protocol: piece 1 (orange) was altered for 3 days in solutionS1only, piece 2 (green) was altered 3 days in solutionS1followed by 4 days in solutionS2, and piece 3 (blue) is
similar to piece 2 but the alteration duration in solutionS2was 10 days.b Normalized B profiles showing the position of the alteration front at the three
considered durations. The inset displays the29Si/28Si ratio in the gel of piece 1. Although the glass is altered in a solution highly enriched in29Si, the gel
keeps the isotopic signature of the glass.c Oxygen isotopic profiles in the three gels. Contrary to Si, O in the gel displays an isotopic signature close to that of the solution. For ToF-SIMS profiles, only lines are displayed for a better readability, and the analytical step is 7 nm
0 500 1000 1500 2000 0.00 0.05 0.10 0.15 0.20 Natural abundance Equilibration with H2O + OH Depth (nm) 18O/16O 18O/ 16 O B Solution abundance 0.0 0.2 0.4 0.6 0.8 1.0 1.2 Normalized B conc.
Fig. 7 Dynamics of reorganization of a mature gel. Oxygen isotopic ratio and B profiles recorded by ToF-SIMS depth profiling on a piece altered 1625 days (experiment 3) in the initial experiment and then placed 1 month in similar conditions (90 °C, pH90 °C7, silica-saturated solution) with water
spiked with18O (18O/16O= 0.24). During this 1-month experiment, the oxygen isotopic signature of the gel raised from natural abundance to 0.125 on average, leading to a fraction of exchanged O of 21.1%
Samples were diluted and analyzed by inductively coupled plasma-optical emission spectroscopy (ICP-OES, Thermo Scientific ICAP 6300 DUO). Several pieces were withdrawn during the course of the initial experiment: one after 363 days for running experiment 1 of the present study and another after 1625 days for experiment 3.
For experiment 1, the 363-day piece withdrawn in the initial experiment was dried, broken into six pieces, and then placed at (25 ± 2) °C in a solution spiked with H218O, so that18O/16O= 7 ± 3. These pieces of altered glass were sampled
after various durations and analyzed by ToF-SIMS.
Experiment 2 devoted to study the dynamics of the early stages of gel reorganization was performed with fresh ISG pieces at (90 ± 1) °C, pH90 °C7 ± 0.2,
3 g L−1K using isotopically natural water in thefirst 3 days, and in18O-enriched water between day 3 and 13, so that18O/16O= 0.24 ± 0.05.
ToF-SIMS analyses were performed by Tescan Analytics, Fuveau, France using a ToF-SIMS5 spectrometer (IonTof––Münster, Germany). The analytical procedure was optimized to minimize exchange between pore water and air humidity and quantify oxygen isotopic ratio in the gel. Details are provided in Supplementary Note2. A pulsed 25 keV∼0.1-pA Bi3++primary ion source was
employed over a rastered area of 50μm × 50 μm (beam size ≤ 3 μm). Depth profiling was performed using a 2-keV Cs+sputter beam with a 45° incidence to
the glass surface, giving a 195-nA target current over a 200-μm x 200-μm area. A flood gun was used to compensate the charging effect on the surface. Negative ion depth profiles were recorded. These conditions provide a step of 7 nm, similar in the gel and in the glass. Data acquisition and post-processing analyses were performed using the SurfaceLab 6 software. A profilometer was used to measure the crater depth at the end of the analysis. Data are displayed as a function of depth considering the same sputtering rate in the alteration layer and pristine glass. Molecular dynamics. Molecular dynamics (MD) simulations of water diffusion in amorphous silica micropores were performed with reactive dissociable water potentials25,26and the LAMMPS package36. Reactive forcefield-based MD simu-lations were used previously to study the gel and gel/water interfaces32,37. The Hole
program38was used to determine the location and smoothness of the pore walls.
NVT simulations at 298 K were performed for all the systems: 8 ns for the 0.5 and 1-nm pore systems, 4 ns for the 2-nm pore system, and 2 ns for the 4-nm pore system. The diffusion coefficients were calculated as the average of the diffusion coefficient in the radial direction over the length of the pore. See Supplementary Note4for more details.
Data availability. The data that support thefindings of this study are available from the corresponding author upon request.
Received: 29 December 2017 Accepted: 10 April 2018
References
1. Frugier, P. et al. SON68 nuclear glass dissolution kinetics: current state of knowledge and basis of the new GRAAL model. J. Nucl. Mater. 380, 8–21 (2008).
2. Grambow, B. & Muller, R. First-order dissolution rate law and the role of surface layers in glass performance assessment. J. Nucl. Mater. 298, 112–124 (2001).
3. Hellmann, R. et al. Nanometre-scale evidence for interfacial dissolution-reprecipitation control of silicate glass corrosion. Nat. Mater. 14, 307–311 (2015).
4. Putnis, A. Mineral replacement reactions: from macroscopic observations to microscopic mechanisms. Mineral. Mag. 66, 689–708 (2002).
5. Ruiz-Agudo, E. et al. Control of silicate weathering by interface-coupled dissolution-precipitation processes at the mineral-solution interface. Geology 44, 567–570 (2016).
6. Geisler, T. et al. The mechanism of borosilicate glass corrosion revisited. Geochim. Cosmochim. Acta 158, 112–129 (2015).
7. Vienna, J. D., Ryan, J. V., Gin, S. & Inagaki, Y. Current understanding and remaining challenges in modeling long-term degradation of borosilicate nuclear waste glasses. Int. J. Appl. Glass Sci. 4, 283–294 (2013).
8. Casey, W. H., Westrich, H. R., Banfield, J. F., Ferruzzi, G. & Arnold, G. W. Leaching and reconstruction at the surfaces of dissolving chain-silicate minerals. Nature 366, 253–256 (1993).
9. Cailleteau, C. et al. Insight into silicate-glass corrosion mechanisms. Nat. Mater. 7, 978–983 (2008).
10. Daval, D. et al. Dynamics of altered surface layer formation on dissolving silicates. Geochim. Cosmochim. Acta 209, 51–69 (2017).
11. White, A. F. & Brantley, S. L. The effect of time on the weathering of silicate minerals: why do weathering rates differ in the laboratory andfield? Chem. Geol. 202, 479–506 (2003).
12. Neeway, J., Abdelouas, A., Grambow, B. & Schumacher, S. Dissolution mechanism of the SON68 reference nuclear waste glass: New data in dynamic system in silica saturation conditions. J. Nucl. Mater. 415, 31–37 (2011). 13. Ferrand, K., Abdelouas, A. & Grambow, B. Water diffusion in the simulated
French nuclear waste glass SON 68 contacting silica rich solutions: experimental and modeling. J. Nucl. Mater. 355, 54–67 (2006).
14. Gin, S. et al. Origin and consequences of silicate glass passivation by surface layers. Nat. Commun. 6 (2015).https://doi.org/10.1038/ncomms7360. 15. Gin, S. et al. Atom-probe tomography, TEM and ToF-SIMS study of
borosilicate glass alteration rim: a multiscale approach to investigating rate-limiting mechanisms. Geochim. Cosmochim. Acta 202, 57–76 (2017). 16. Gin, S. et al. The controversial role of inter-diffusion in glass alteration. Chem.
Geol. 440, 115–123 (2016).
17. Gin, S. et al. An international initiative on long-term behavior of high-level nuclear waste glass. Mater. Today 16, 243–248 (2013).
18. Valle, N. et al. Elemental and isotopic (29Si and18O) tracing of glass alteration
mechanisms. Geochim. Cosmochim. Acta 74, 3412–3431 (2010). 19. McGrail, B. P. et al. The structure of Na2O-Al2O3-SiO2glass: impact on
sodium ion exchange in H2O and D2O. J. Non-Cryst. Solids 296, 10–26 (2001).
20. Doremus, R. H. Diffusion of water in silica glass. J. Mater. Res. 10, 2379–2389 (1995).
21. Neeway, J. J. et al. Ion-exchange interdiffusion model with potential application to long-term nuclear waste glass performance. J. Phys. Chem. C 120, 9374–9384 (2016).
22. Collin, M. et al. Structure of international simple glass and properties of passivating layer formed in circumneutral pH conditions. npj Mater. Degrad. 2(2018).
23. Collin, M., Fournier, M., Charpentier, T., Moskura, M. & Gin, S. Do alkalis affect the passivation of silicate glass? npj Mater. Degrad. In Press (2018).
https://doi.org/10.1038/s41529-018-0036-3.
24. Gouze, B., Cambedouzou, J., Parres-Maynadie, S. & Rebiscoul, D. How hexagonal mesoporous silica evolves in water on short and long term: Role of pore size and silica wall porosity. Microporous Mesoporous Mater 183, 168–176 (2014).
25. Mahadevan, T. S. & Garofalini, S. H. Dissociative water potential for molecular dynamics simulations. J. Phys. Chem. B 111, 8919–8927 (2007). 26. Mahadevan, T. S. & Garofalini, S. H. Dissociative chemisorption of water onto
silica surfaces and formation of hydronium ions. J. Phys. Chem. C 112, 5694–5694 (2008).
27. Holz, M., Heil, S. R. & Sacco, A. Temperature-dependent self-diffusion coefficients of water and six selected molecular liquids for calibration in accurate1H NMR PFG measurements. Phys. Chem. Chem. Phys. 2, 4740–4742
(2000).
28. Wang, J. H. Self-diffusion coefficients of water. J. Phys. Chem. 69, 4412–441 (1965).
29. Bourg, I. C. & Steefel, C. I. Molecular dynamics simulations of water structure and diffusion in silica nanopores. J. Phys. Chem. C 116, 11556–11564 (2012). 30. Malavasi, G., Menziani, M. C., Pedone, A. & Segre, U. Void size distribution in MD-modelled silica glass structures. J. Non-Cryst. Solids 352, 285–296 (2006). 31. Mansas, C. et al. Drivers of water transport in glass: chemical or topological
effect of the glass network? J. Phys. Chem. C 121, 16201–16215 (2017). 32. Rimsza, J. M. & Du, J. C. Interfacial structure and evolution of the water-silica
gel system by reactive force-field-based molecular dynamics simulations. J. Phys. Chem. C 121, 11534–11543 (2017).
33. Cailleteau, C., Devreux, F., Spalla, O., Angeli, F. & Gin, S. Why do certain glasses with a high dissolution rate undergo a low degree of corrosion? J. Phys. Chem. C 115, 5846–5855 (2011).
34. Jollivet, P. et al. Investigation of gel porosity clogging during glass leaching. J. Non-Cryst. Solids 354, 4952–4958 (2008).
35. Gin, S. et al. The fate of silicon during glass corrosion under alkaline conditions: a mechanistic and kinetic study with the International Simple Glass. Geochim. Cosmochim. Acta 151, 68–85 (2015).
36. Plimpton, S. LAMMPS website.http://lammps.sandia.gov/(2003).
37. Rimsza, J. M., Yeon, J., van Duin, A. C. T. & Du, J. C. Water interactions with nanoporous silica: comparison of ReaxFF and ab initio based molecular dynamics simulations. J. Phys. Chem. C 120, 24803–24816 (2016). 38. Smart, O. S., Goodfellow, J. M. & Wallace, B. A. The pore dimensions of
gramicidin-A. Biophys. J. 65, 2455–2460 (1993).
39. Iacovino, K. Glass density Calc. v3.2. www.kaylaiacovino.com/tools-for-petrologists(2017).
Acknowledgements
This work was supported as part of the Center for Performance and Design of Nuclear Waste Forms and Containers, an Energy Frontier Research Center funded by the U.S. Department of Energy, Office of Science, and Basic Energy Sciences under Award # DE-SC0016584. The authors are grateful to Géraldine Parisot for technical support.
Author contributions
S.G. led the study and wrote the paper, M.C., P.J., and M.F. ran the experiments, L.D. conducted the ToF-SIMS analyses, T.M. and J.D. performed the MD simulations, and S. K. and Y.M. developed the diffusion model.
Additional information
Supplementary Informationaccompanies this paper at https://doi.org/10.1038/s41467-018-04511-2.
Competing interests:The authors declare that they have no competing interests. Reprints and permissioninformation is available online athttp://npg.nature.com/ reprintsandpermissions/
Publisher's note:Springer Nature remains neutral with regard to jurisdictional claims in published maps and institutional affiliations.
Open Access This article is licensed under a Creative Commons Attribution 4.0 International License, which permits use, sharing, adaptation, distribution and reproduction in any medium or format, as long as you give appropriate credit to the original author(s) and the source, provide a link to the Creative Commons license, and indicate if changes were made. The images or other third party material in this article are included in the article’s Creative Commons license, unless indicated otherwise in a credit line to the material. If material is not included in the article’s Creative Commons license and your intended use is not permitted by statutory regulation or exceeds the permitted use, you will need to obtain permission directly from the copyright holder. To view a copy of this license, visithttp://creativecommons.org/ licenses/by/4.0/.