HAL Id: cea-02339257
https://hal-cea.archives-ouvertes.fr/cea-02339257
Submitted on 14 Dec 2019
HAL is a multi-disciplinary open access
archive for the deposit and dissemination of
sci-entific research documents, whether they are
pub-lished or not. The documents may come from
teaching and research institutions in France or
abroad, or from public or private research centers.
L’archive ouverte pluridisciplinaire HAL, est
destinée au dépôt et à la diffusion de documents
scientifiques de niveau recherche, publiés ou non,
émanant des établissements d’enseignement et de
recherche français ou étrangers, des laboratoires
publics ou privés.
Analysis of hafnium configuration of FLUOLE-2 program
S. Bourganel, N. Thiollay, P. Mosca
To cite this version:
S. Bourganel, N. Thiollay, P. Mosca. Analysis of hafnium configuration of FLUOLE-2 program. 20th
Topical Meeting of the Radiation Protection and Shielding Division (RPSD) of the American Nuclear
Society (ANS) - 2018, Aug 2018, Santa Fe, United States. �cea-02339257�
ANS RPSD 2018 - 20th Topical Meeting of the Radiation Protection & Shielding Division of ANS
Santa Fe, NM, August 26 – 31, 2018, on CD-ROM, American Nuclear Society, LaGrange Park, IL (2018)
ANALYSIS OF HAFNIUM CONFIGURATION OF FLUOLE-2 PROGRAM Stéphane BOURGANEL1, Nicolas THIOLLAY2, and Pietro MOSCA3
1
CEA Saclay, DM2S/SERMA/LPEC, Gif sur Yvette Cedex, F-91191, +33169085569, [email protected]
2CEA Cadarache, DER/SPESI/LDCI, Saint Paul lez Durance Cedex, F-13108, +33442257264, [email protected] 3CEA Saclay, DM2S/SERMA/LLPR, Gif sur Yvette Cedex, F-91191, +33169082260, [email protected]
The purpose of this paper is to present an analysis of the hafnium configuration of FLUOLE-2 program. FLUOLE-2 is a set of benchmark-type experiments dedicated to neutron attenuation analysis with the aim of improving the TRIPOLI-4® Monte Carlo code validation and industrial neutron physics scheme. The CEA developed this program, with the support of EDF, in order to be representative of 900 and 1450 MWe Pressurized Water Reactors operated in France. For that purpose, different stainless steel structures have been designed and appropriately positioned inside the EOLE facility located at Cadarache CEA center. EOLE is a pool type zero power reactor, composed of a cylindrical aluminum vessel with an overstructure of stainless steel, that is able to contain various types of core and related structures. The FLUOLE-2 core has been designed as a 29×29 pins square lattice of fuel rods. Different kinds of dosimeters (cobalt, gold, tin, rhodium, indium, iron, nickel, titanium, aluminum, and vanadium) were irradiated inside and outside the core.
I. INTRODUCTION
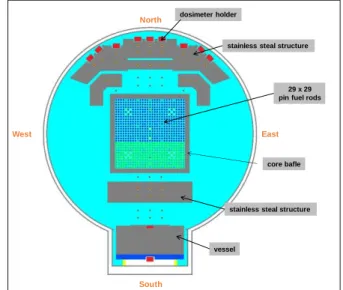
The FLUOLE-2 program1 is a benchmark-type experiment designed, developed, and performed by the CEA (Commissariat à l’Energie Atomique et aux Energies Alternatives), .and supported by EDF (Électricité De France). It is devoted to improve the TRIPOLI-4® (Ref. 2) Monte Carlo code validation by analyzing neutron attenuation using activation dosimeters. This program is representative of both French 900 and 1450 MWe Pressurized Water Reactors. To achieve this goal, different stainless steel structures have been designed and appropriately positioned inside the EOLE3 facility, as shown in Figure 1. In the North, structures are designed to reproduce neutron paths between the core and surveillance capsules inside a PWR while in the opposite side in the South, structures reproduce neutron paths between the core and the vessel of a PWR. This program was carried out in several steps: dosimeters were irradiated and their activity was measured, both carried out at CEA/Cadarache. Then, an analysis of experimental results was conducted at CEA/Saclay using a calculation scheme presented in section II.
dosimeter holder
stainless steal structure
29 x 29 pin fuel rods
stainless steal structure
vessel North South East West core bafle
Fig. 1. FLUOLE-2 device.
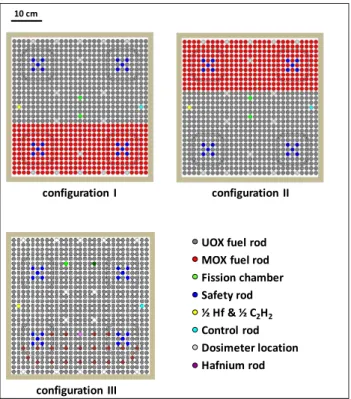
EOLE critical mock-up is a pool type zero power reactor, composed of a cylindrical aluminum vessel with an overstructure of stainless steel, that can contain various types of core and related structures. To perform the FLUOLE-2 experiment, the core has been designed as a 29×29 pins square lattice. Three core loading configurations were developed and analyzed as illustrated in Figure 2.
Configuration #1: 29×18 UOX fuel rods in the North, and 29×11 MOX fuel rods in the South. This configuration represents the first stage of the FLUOLE-2 program.
Configuration #2: UOX and MOX fuel rods were switched so that UOX fuel rods were in the South, and MOX fuel rods in the North.
Configuration #3: 29×29 UOX fuel rods including twenty-two hafnium rods in the South.
Using core configurations #1 and #2, North and South structures were irradiated by neutrons from both UOX and then MOX fuel. During these two stages, the same kind of dosimeters were irradiated in the same location (North and South). The aim was to check the effect of fission spectra on neutron transport.
2 In configuration #3, the core power in the South is severely reduced. This is due to a strong absorption of neutrons, close to hafnium rods. The aim of this configuration is to validate neutron attenuation in front of hafnium rods, at the South side of the FLUOLE-2 device.
configuration I configuration II
10 cm
UOX fuel rod MOX fuel rod Fission chamber Safety rod ½ Hf & ½ C2H2 Control rod Dosimeter location Hafnium rod configuration III
Fig. 2. FLUOLE-2 core loadings.
This article is focused on results associated to the hafnium configuration (#3). Results obtained with configurations #1 and #2 are given without specifying details since they have already been presented in another paper4.
II. CALCULATION SCHEME
The calculation scheme used to analyze the FLUOLE-2 program is based on the TRIPOLI-4® Monte Carlo code, and the DARWIN/PEPIN2 depletion code.
TRIPOLI-4® (Ref. 2) is a three-dimensional transport code using full pointwise cross-section data. It is dedicated to radiation protection and shielding, nuclear criticality safety, fission and fusion reactor design, and nuclear instrumentation. It is used as a reference tool by the CEA, EDF, and several other industrial or institutional partners. In this study, TRIPOLI-4® is used to calculate the neutron source distribution in the core, the neutron propagation through the different structures, the reaction rate values in dosimeters, and the fission rate values inside fission chambers used to normalize calculations.
DARWIN/PEPIN2 (Ref. 5) solves Bateman’s generalized differential equations governing the time
dependence of isotope concentrations. This code may be coupled with TRIPOLI-4® code. In this analysis, the DARWIN/PEPIN2 code is dedicated to dosimeter activation calculations.
All simulation tools used to carry out the FLUOLE-2 analysis are developed by the CEA, with the financial support of EDF and FRAMATOME. These codes use common nuclear data which have an international reputation: they are based upon the Joint Evaluated Fission and Fusion JEFF3.1.1 (Ref. 6) and the International Reactor Dosimetry File IRDF2002 (Ref. 7) cross-section libraries to provide a uniform and consistent set of nuclear data.
Normalization of the EOLE core is ensured using two 235U fission chambers. They are located close to the center of the core (see Figure 2). The total neutron source in the core is calculated using a very precise modeling of fission chambers with TRIPOLI-4®, as well as results of a prior calibration of these detectors.
Finally, it is reminded that no adjustment of calculated spectrum or activity results were made in this study.
III. CALCULATION OF NEUTRON SOURCE DISTRIBUTION IN THE CORE
Before analyzing dosimeter activation, the spatial distribution of the neutron source in the EOLE core must be calculated. This is achieved by using a TRIPOLI-4® simulation: neutron production is calculated axially and radially for each fuel rod, and for each fissile isotope. Various parameters are taken into account such as the boron concentration in water, the MOX composition (configurations #1 and #2 only; varying over time), and the control rod position. This result is then converted into neutron sources to be propagated in the whole FLUOLE-2 device.
Validation of the calculated spatial distribution of neutron sources is based on a comparison with experimental measurements. For that purpose, gamma-scanning measurements were carried out for several fuel rods: 136 fuel rods for configuration III. Result analyses show that discrepancy between calculated and measured (C/M) values are close to the total uncertainty (calculations and measurements, around 1%). Low deviations, from 2 to 4%, are observed at the edge of the core. C/M results for configuration #3 are presented in Figure 3.
These good results are strengthened by additional analyses, such as sensibility studies on parameters taken into account in calculations (boron concentration in water, MOX composition, and control rod position). It appears that calculated neutron sources in the EOLE core depend very little on these parameters over reasonable ranges.
C/M 1 2 3 4 5 6 7 8 9 10 11 12 13 14 15 16 17 18 19 20 21 22 23 24 25 26 27 28 29 11,03 1,04 1,02 1,01 1,01 1,01 1,00 1,01 0,99 1,00 1,00 1,00 2 1,02 1,01 0,99 31,01 1,01 0,98 4 1,00 5 1,00 6 0,99 7 0,99 8 0,99 9 0,99 10 0,98 11 0,99 12 1,00 13 0,99 1,00 1,00 14 0,99 15 1,00 1,00 0,99 16 1,01 17 1,01 1,00 1,00 18 0,99 19 0,99 20 1,00 0,99 0,99 0,99 0,98 21 22 1,00 1,01 0,99 0,99 1,00 23 1,00 1,01 1,00 0,99 0,99 1,00 0,99 24 1,00 1,01 0,99 0,99 25 1,01 1,00 0,98 1,01 1,01 1,00 0,98 0,99 1,00 26 1,01 1,02 1,01 0,99 0,99 0,98 1,00 1,00 1,00 1,00 1,00 0,99 1,00 1,00 1,00 0,99 0,99 271,01 1,01 1,00 1,00 1,00 0,98 1,00 0,99 1,00 1,00 0,99 0,99 1,00 1,01 0,98 1,00 0,99 0,99 0,98 0,98 28 1,02 1,00 1,00 1,00 0,98 0,99 1,00 1,00 0,98 0,99 0,99 0,98 0,99 0,99 1,00 0,99 0,99 290,99 1,00 1,00 0,98 0,98 1,00 0,99 0,98 0,98 0,99 0,98 0,98 0 < |C/M| < 2% 2% < |C/M| < 4%
Fig. 3. C/M gamma-scanning results (configuration #3). IV. DOSIMETRY ANALYSIS for configuration #3
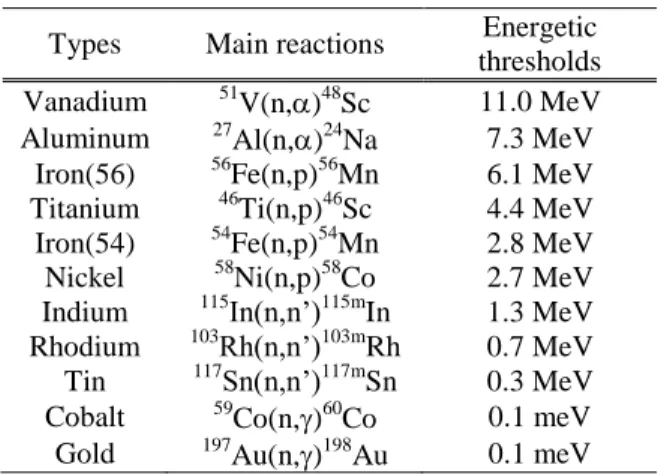
Dosimeters were irradiated in three separated irradiations: two irradiations dedicated to in-core dosimeters, and one irradiation for ex-core dosimeters. Results associated to these two locations are presented and discussed separately. The different kinds of dosimeters irradiated in the FLUOLE-2 device, and their associated reaction are specified in Table I. Dosimeters are listed in descending order of energetic threshold.
TABLE I. Type of dosimeters used.
Types Main reactions Energetic
thresholds Vanadium 51V(n,)48Sc 11.0 MeV Aluminum 27Al(n,)24Na 7.3 MeV
Iron(56) 56Fe(n,p)56Mn 6.1 MeV Titanium 46Ti(n,p)46Sc 4.4 MeV Iron(54) 54Fe(n,p)54Mn 2.8 MeV Nickel 58Ni(n,p)58Co 2.7 MeV Indium 115In(n,n’)115mIn 1.3 MeV Rhodium 103Rh(n,n’)103mRh 0.7 MeV Tin 117Sn(n,n’)117mSn 0.3 MeV Cobalt 59Co(n,)60Co 0.1 meV Gold 197Au(n,)198Au 0.1 meV
Note that iron dosimeters have two main reactions. IV.A. Results for in-core dosimeters
Eighty-six dosimeters were irradiated in the core, mainly in the South side, close to hafnium rods as shown in Figure 4 (dosimeters located at the nine black squares). Several dosimeters were irradiated at the same location, and at the same time.
Two sets of dosimeters were irradiated in-core, in different experimental conditions: during the first irradiation, the core power was about 80 Watt for one hour. For the second irradiation, the power was close to 200 Watt for five hours. This second irradiation went for
several hours to ensure the measurability of dosimeters having very low activity.
Fig. 4. In-core dosimeters (configuration #3).
IV.A.1. Results for in-core dosimeters (irradiation #1)
C/M results for dosimeters irradiated in-core during irradiation #1 (80 Watt; one hour) are presented in Table II.
TABLE II. C/M results for in-core dosimeters (irradiation #1). Types Number of measures Mean C/M Statistical dispersion Vanadium 0 - - Aluminum 1 1.01 - Iron(56) 1 0.97 - Titanium 0 - - Iron(54) 1 1.02 - Nickel 3 0.98 0.01 Indium 0 - - Rhodium 0 - - Tin 0 - - Cobalt 2 1.01 0.00 Gold 3 1.01 0.01
Only ten dosimeters were irradiated in-core during the first irradiation (eleven measures). Results will be discussed in section IV.A.3.
IV.A.2. Results for in-core dosimeters (irradiation #2)
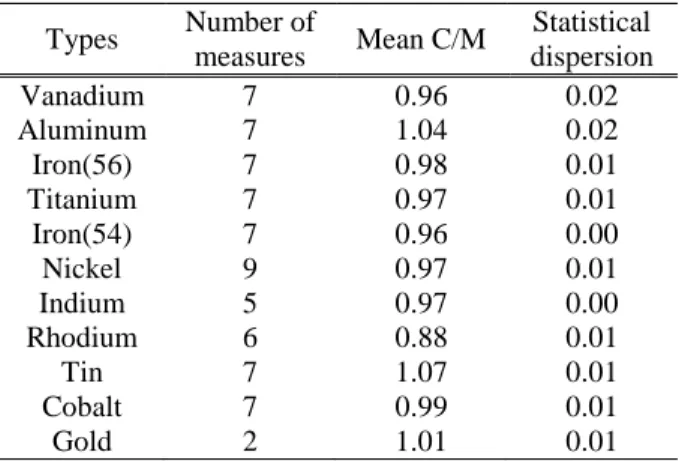
C/M results for dosimeters irradiated in-core during irradiation #2 (200 Watt; five hours) are presented in Table III.
4 TABLE III. C/M results for in-core dosimeters
(irradiation #2). Types Number of measures Mean C/M Statistical dispersion Vanadium 7 0.96 0.02 Aluminum 7 1.04 0.02 Iron(56) 7 0.98 0.01 Titanium 7 0.97 0.01 Iron(54) 7 0.96 0.00 Nickel 9 0.97 0.01 Indium 5 0.97 0.00 Rhodium 6 0.88 0.01 Tin 7 1.07 0.01 Cobalt 7 0.99 0.01 Gold 2 1.01 0.01
Results will be discussed in section IV.A.3.
IV.A.3. Global results for in-core dosimeters and discussion
Both irradiations #1 and #2 present similar results. Global C/M results for dosimeters irradiated in-core are gathered in Table IV. They are also illustrated in Figure 5. TABLE IV. Global C/M results for in-core dosimeters.
types Number of measures Mean C/M Statistical dispersion Vanadium 7 0.96 0.02 Aluminum 8 1.04 0.02 Iron(56) 10 0.98 0.01 Titanium 7 0.97 0.01 Iron(54) 10 0.97 0.02 Nickel 16 0.98 0.01 Indium 7 0.97 0.01 Rhodium 7 0.88 0.01 Tin 7 1.07 0.01 Cobalt 10 1.00 0.01 Gold 7 1.01 0.01 0,85 0,90 0,95 1,00 1,05 1,10 C /M Dosimeters
Fig. 5. Global C/M results for in-core dosimeters.
Most of the C/M results are close to 1.00. This confirms the accuracy of the neutron source distribution in fuel rods, as well as of the neutron transport simulation inside the core. Two kinds of dosimeter do not match this trend: rhodium and tin dosimeters.
Measured activities for rhodium dosimeters (Rh) are subject to some uncertainties: X-rays (around 20 keV) emitted by 103mRh are largely absorbed by the dosimeter itself though it is very thin (50 µm). This involves significant corrective factors. Furthermore, the X-rays emission probabilities are known with an uncertainty of 7%. The difference between measurement and calculation for rhodium dosimeters is mostly explained by these two reasons. However, some works8 are being done at CEA Saclay (LNHB) to enhance rhodium dosimeter measurements. They show that rhodium dosimeter results will be improved significantly. This point is discussed in section V.C.
With regard to tin dosimeters, the activity measurement does not have a particular technical difficulty. But the inelastic scattering cross-section for 117
Sn is probably not well known. These data are not available in either IRDF2002 or in the new Dosimetry library IRDFF1.05 (Ref. 9) because the use of tin dosimeters is fairly new. For the FLUOLE-2 analysis, the inelastic scattering cross-section data for 117Sn come from the Japanese Evaluated Nuclear Data Library JENDL/A-96 nuclear library, which provides better results than other libraries (EAF, JEFF). Additional information is given in section V.D.
IV.B. Results for ex-core dosimeters
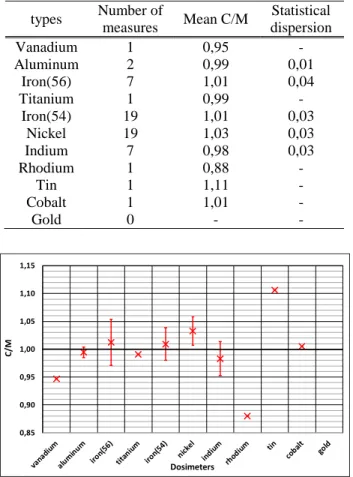
Fifty-two dosimeters were irradiated outside the core at the South side. Positions of irradiation are indicated by red dots in Figure 1. Fifty-nine measures of activity were carried out (seven dosimeters made of iron have two measured values). Mean C/M ratios sorted by kind of dosimeter are detailed in Table V. These results are also illustrated in Figure 6.
For ex-core dosimeters, C/M results are similar to those obtained with in-core dosimeters even if they seem to be slightly higher. However, this gap is not significant according to statistical uncertainties associated to C/M values. All C/M ratios are close to 1, excepted for rhodium and tin dosimeters. The reasons why these two kinds of dosimeters give such results are explained in section IV.A.3.
TABLE V. Global C/M results for ex-core dosimeters. types Number of measures Mean C/M Statistical dispersion Vanadium 1 0,95 - Aluminum 2 0,99 0,01 Iron(56) 7 1,01 0,04 Titanium 1 0,99 - Iron(54) 19 1,01 0,03 Nickel 19 1,03 0,03 Indium 7 0,98 0,03 Rhodium 1 0,88 - Tin 1 1,11 - Cobalt 1 1,01 - Gold 0 - - 0,85 0,90 0,95 1,00 1,05 1,10 1,15 C /M Dosimeters
Fig. 6. Global C/M results for ex-core dosimeters. V. GENERAL DISCUSSION
This section is dedicated to a comparison of results obtained for the three configurations of the FLUOLE-2 program. Additional discussions are also presented. V.A. Comparison of the FLUOLE-2 program results
In this section, C/M results associated to the three configurations of the FLUOLE-2 program are compared. This work is done separately for in-core (Figure 7) and ex-core dosimeters (Figure 8; South side).
0,85 0,90 0,95 1,00 1,05 1,10 configuration #3 configurations #1 and #2 C /M Dosimeters
Fig. 7. Comparison of C/M results for in-core dosimeters.
0,85 0,90 0,95 1,00 1,05 1,10 1,15 configuration #3 configurations #1 and #2 C /M Dosimeters
Fig. 8. Comparison of C/M results for ex-core dosimeters. As has been discussed previously, C/M ratio values are similar for each kind of dosimeters. The deviation between calculated and measured activity values ranges from 0.95 to 1.05 in average, excepted for rhodium and tin dosimeters. The ability of TRIPOLI-4® Monte Carlo code to make a correct calculation of neutron attenuation through the core as well as outside the core is confirmed.
C/M results at the North side of the core are not discussed in this article because no dosimeters were irradiated at this location during configuration #3. However, similar good results were obtained with configurations #1 and #2 (Ref. 4).
V.B. Additional analysis: IRDFF1.05 library
In the analysis presented in this paper, activity values were calculated using IRDF2002 cross-section library. An updated library dedicated to dosimeter calculation is now available: IRDFF1.05. In the FLUOLE-2 program, only aluminum, indium, and gold dosimeters are affected by this new library. Cross-section data remain unchanged for all other dosimeters. New calculations were carried out using this new library. The difference between new results and reference results (presented in this paper) is lower than 2%. Using IRDFF1.05 cross-section library
6 does not change the conclusion of the analysis of the FLUOLE-2 program.
V.C. Expected improvement for rhodium dosimeters As mentioned in previous sections in this paper, C/M results for rhodium dosimeters are not fully satisfactory (about 0.88 in average). Activity measurement is based, among other things, on nuclear data as fluorescence yields that are rather poor and based on old measurements. This implies an important bias on measured absolute activity values for this kind of dosimeter. Significant improvements have been made in nuclear data used to determine activity from peak measurements8. New calculations using updated nuclear data show that C/M ratios for rhodium dosimeters become close to 1, as is the case for the other kinds of dosimeters. However, we remain cautious about this new result since the international scientific community has not yet validated these new data used for rhodium activity measurement. However, the problem of rhodium dosimeters seems to be understood and resolved.
V.D. Expected improvement for tin dosimeters
In the FLUOLE-2 program, tin dosimeters are enriched with 117Sn. The main reaction associated to this kind of dosimeter is the inelastic scattering on 117Sn: 117Sn(n,n’)117mSn.
C/M results for these dosimeters are not satisfactory: about 1.07 in average. Measurement is not a problem: high-energy photons are measured without any experimental difficulties. By contrast, inelastic scattering cross-section data for 117Sn used to calculate activity seem to be inconsistent: they differ widely from one nuclear data library to another. For instance, using JEFF3.1.1 library, calculated activity is twice the measured activity. Using EAF nuclear library, C/M ratios are about 0.80. Finally, JENDL/A-96 library gives the best results, that is why it was selected to analyze the FLUOLE-2 program (C/M equals to 1.07 in average).
C/M ratio values could be enhanced by improving cross-section data for 117Sn inelastic scattering.
II. CONCLUSIONS
The FLUOLE-2 program was successfully carried out: a large number of dosimeters was irradiated inside and outside a core designed through several configurations. Two configurations were used to analyze neutron attenuation from uranium oxide (UOX) and mixed oxide (MOX) fuel rods in different locations. Results have been published in another article4. A third configuration, containing hafnium rods is analyzed in this paper. All results show a good agreement between measured and calculated activity values excepted for two kinds dosimeters for which nuclear data need to be improved. This work shows the ability of the
TRIPOLI-4® Monte Carlo code and the DARWIN/PEPIN2 depletion code to precisely model neutron transport and dosimeter activation in a configuration similar to a PWR. These results were partially obtained thanks to a precise knowledge of parameters involved in the modeling, in particular dimension of structures, and isotopic compositions.
ACKNOWLEDGMENTS
The authors acknowledge EDF for support of this work, as well as the team in charge of operation and experimentation at the EOLE facility at CEA/Cadarache.
REFERENCES
1. N. THIOLLAY ET AL, “FLUOLE-2: an Experiment for PWR Pressure Vessel Surveillance”, Fifteenth International Symposium on Reactor Dosimetry (ISRD 15), Aix-en-Provence, France, May 18-23, 2014.
2. “TRIPOLI-4® version 8.1, 3D general purpose continuous energy Monte Carlo Transport code”,
NEA-1716 TRIPOLI-4 VERS. 8.1,
https://www.oecd-nea.org/tools/abstract/detail/nea-1716
3. J.C. BOSQ et al., “The use of EOLE and MINERVE critical facilities for the Generation 3 light water reactors studies”, Proc. Of ICAPP 2011, Nice, France, May 2-5, 2011.
4. S. BOURGANEL, “Analysis of the FLUOLE-2 program: UOX/MOX core loading configurations”, Sixteenth International Symposium on Reactor Dosimetry (ISRD 16), Santa Fe, NM, USA, May 7-12, 2017, to be published.
5. A. TSILANIZARA et al, “Experimental validation of the DARWIN2.3 package for fuel cycle applications”, PHYSOR 2012, Knoxville, Tennessee, USA, April 15-20, 2012.
6. A. SANTAMARINA, D. BERNARD, Y. RUGAMA, “The JEFF-3.1.1 nuclear data library”, JEFF Report 22 OECD/NEA.
7. “International reactor Dosimetry File 2002 (IRDF2002)”, Technical reports series No. 452, IAEA.
8. J. RIFFAUD et Al, “Measurement of Absolute K X-Rays Emission Intensities in the Decay of 103mRh”, Applied Radiation and Isotopes, Volume 134, April 2018, Pages 399-405
9. “International Reactor Dosimetry and Fusion File IRDFF v.1.05”, https://www nds.iaea.org/IRDFF
![[PDF] Document de cours pour apprendre a trader avec ichimoku | Cours Forex](data:image/gif;base64,R0lGODlhAQABAIAAAP///wAAACH5BAEAAAAALAAAAAABAAEAAAICRAEAOw==)