HAL Id: hal-02377280
https://hal.archives-ouvertes.fr/hal-02377280
Submitted on 26 May 2020HAL is a multi-disciplinary open access
archive for the deposit and dissemination of sci-entific research documents, whether they are pub-lished or not. The documents may come from teaching and research institutions in France or abroad, or from public or private research centers.
L’archive ouverte pluridisciplinaire HAL, est destinée au dépôt et à la diffusion de documents scientifiques de niveau recherche, publiés ou non, émanant des établissements d’enseignement et de recherche français ou étrangers, des laboratoires publics ou privés.
Anthony Foucher, O. Evrard, Olivier Cerdan, Clément Chabert, François
Lecompte, Irène Lefèvre, Rosalie Vandromme, Sebastien Salvador-Blanes
To cite this version:
Anthony Foucher, O. Evrard, Olivier Cerdan, Clément Chabert, François Lecompte, et al.. A quick and low-cost technique to identify layers associated with heavy rainfall in sediment archives during the Anthropocene. Sedimentology, Blackwell Publishing, 2019, 67 (1), pp.sed.12650. �10.1111/sed.12650�. �hal-02377280�
A quick and low-cost technique to identify layers associated with heavy rainfall in sediment archives during the
Anthropocene Journal: Sedimentology
Manuscript ID SED-2019-OM-089 Manuscript Type: Original Manuscript Date Submitted by the
Author: 29-Apr-2019
Complete List of Authors: Foucher, Anthony; Laboratoire des sciences du climat et de
l'environnement, UMR 1572 (CEA/CNRS/UVSQ) ; Université Francois-Rabelais de Tours, Laboratoire GéoHydrosystèmes Continentaux (GéHCO), E.A 6293, , Faculté des Sciences et Techniques Evrard, Olivier; Laboratoire des sciences du climat et de l'environnement, UMR 1572 (CEA/CNRS/UVSQ)
Cerdan, Olivier; Bureau de Recherches Geologiques et Minieres, Département Risques et Prévention
Chabert, Clément; Bureau de Recherches Geologiques et Minieres, Département Risques et Prévention; Laboratoire des sciences du climat et de l'environnement, UMR 1572 (CEA/CNRS/UVSQ)
Lecompte, François; Institut National de la Recherche Agronomique, Plateforme CIRE, Service d’imagerie, UMR PRC
Lefèvre, Irène; Laboratoire des sciences du climat et de l'environnement, UMR 1572 (CEA/CNRS/UVSQ)
Vandromme, Rosalie; Bureau de Recherches Geologiques et Minieres, Département Risques et Prévention
Salvador-Blanes, Sébastien; Université Francois-Rabelais de Tours, Laboratoire GéoHydrosystèmes Continentaux (GéHCO), E.A 6293, , Faculté des Sciences et Techniques
A quick and low-cost technique to identify layers associated with heavy rainfall in sediment archives during the Anthropocene
Anthony Foucher (1,2) *, Olivier Evrard (1), Olivier Cerdan (3), Clément Chabert (1,3), François Lecompte (4), Irène Lefèvre (1), Rosalie Vandromme (3), Sébastien Salvador-Blanes (2)
(1) Laboratoire des Sciences du Climat et de l’Environnement, (LSCE), UMR 1572 (CEA/CNRS/UVSQ) –Orme des Merisiers, 91191,
Gif-sur-Yvette Cedex, France
(2) Laboratoire GéoHydrosystèmes Continentaux (GéHCO), E.A 6293, Université F. Rabelais de Tours, Faculté des Sciences et Techniques, Parc
de Grandmont, 37200 Tours, France
(3) Département Risques et Prévention, Bureau de Recherches Géologiques et Minières (BRGM), 3 avenue Claude Guillemin, 45060 Orléans,
France
(4) Plateforme CIRE, Service d’imagerie, UMR PRC, Centre INRA Val de Loire, France
Corresponding author *: anthony.foucher@outlook.com
Abstract
Long term records are needed to investigate the impact of extreme events in the current framework of global change. Sedimentary reconstruction with a high resolution remains difficult without conducting expensive, destructive and/or time-consuming analyses. In this study, ultra-high resolution CT-scan profiles (0.6 mm resolution) were used for investigating their potential for detecting flood deposits induced by heavy rainfall events. This method was applied to a sediment core – covering a 120-yr period – collected in a pond draining a small forested catchment (French Massif Central – Central France). Between 1960 and 2017, 28 layers were deposited. Seventy-fixe percent of these deposits were correlated to the occurrence of heavy rainfall (>50 mm) recorded during 1 or 2 consecutive days. The remainder of the deposits detected with the CT-scan (n=5) were not correlated to weather events. They mainly occurred in response to landscape management operations (e.g. afforestation works posterior to the major 1999 storm). This period was indeed characterized by an increase in the delivery of 137Cs-enriched sediment, demonstrating a greater topsoil contribution to sediment during major forest management operations. The intensity of detritical layers has significantly decreased throughout time after a major land use change that took place in 1948 and land abandonment. The frequency of heavy rainfall and associated detritical deposits has nevertheless increased by 60 and 75% respectively between the 1960-2017 period. These results outline the potential of CT-scan for reconstructing long-term flood deposits associated with heavy precipitation. Keyword: high resolution density, historical rainfall records, historical floods, climate change, sediment core, CT-Scan
1. Introduction
Identification of heavy precipitation and floods frequency/intensity represents a major challenge for planning adaptation strategies in response to the increase in the frequency of extreme weather conditions expected for the next several decades (Hirabayashi et al., 2013). Classically, historical precipitation records are required to quantify the potential impact of global change on the occurrence of heavy rainfall and flooding events. Despite the significance of precipitation for supplying the water resources required by natural ecosystems, agricultural production or to anticipate disaster risks, the reconstruction of past precipitation has been rarely investigated compared to other climatic parameters such as the temperature (Shabalova et al., 1999; Van Boxel et al., 2014). Improving our knowledge of historical precipitation is particularly timely as a growing number of studies demonstrated the occurrence of significant positive trends in extreme rainfall in Europe (Zolina et al., 2009) and the associated increased flood risk during the 21st century (Christensen & Christensen, 2003).
Heavy rainfall reconstructions can be obtained at variable temporal scales, from individual years to several decades, based on meteorological measurements (New et al., 2001), historical data (e.g. Macdonald and Black, 2010) or with indirect methods such as river monitoring records (e.g. Evrard et al., 2011; Grangeon et al., 2017). Longer reconstructions (e.g. century/millennium) are more difficult to obtain (e.g. Sakaguchi et al., 2006). In the absence of long-term records of meteorological data or river monitoring, sediment deposition in lakes may provide powerful archives for reconstructing the sequence of significant detrital deposits generated in response to heavy storms (Støren et al., 2016; Wirth et al., 2013). So far, the majority of studies reconstructing precipitation based on sedimentary sequences were conducted on very long time periods (Holocene to millennial scales), and they were generally carried out in mountainous environments (Navratil et al., 2012; Vannière et al., 2013; Wilhelm
et al., 2013).
To reach this goal, various proxies were quantified in sedimentary archives to identify and characterize individual detrital deposits (see the review of Schillereff et al., 2014). With most of these methods, it remains difficult to have access to high resolution information without conducting expensive, destructive and/or time-consuming analyses. After the visual description of the sequences (Soutar & Crill, 1977), these classical measurements include particle size (Arnaud et al., 2002), magnetic susceptibility (Osleger et al., 2009; Støren et al., 2016),
geochemistry (Hodell et al., 2010), organic matter content (Simonneau et al., 2013; Ishii et al., 2017), colour (Debret et al., 2010) or density (Wheatcroft et al., 2006; St-Onge et al., 2012). These latter density measurements are often used for characterizing sediment cores (St-Onge et
al., 2007). Various destructive and non-destructive methods may be used for quantifying this
parameter at different spatial resolutions (e.g. dry bulk density, XRF coherence/incoherence ratio, multi-sensor core logger, computer tomography scanner). According to the comparison of methods carried out by Fortin et al. (2013), computer tomography may provide a precise, quick and cost-efficient technique for detecting variations of density in sediment sequences.
The Computer tomography scanner (CT-scan) was increasingly used during recent years in sedimentogical studies (Cnudde & Boone, 2013). This non-destructive technique may provide high-resolution information on sediment density at a sub-millimeter resolution (Ashi, 1997). In previous studies, this method was successfully used for obtaining high-resolution sediment core imagery (Mena et al., 2015), for determining sediment properties (Tanaka et al., 2011; St-Onge et al., 2012), or for reconstructing sediment cores in 2D/3D (Nakashima and Komatsubara, 2016). CT-Scan presents a clear advantage for detecting and describing high resolution sedimentary facies and structures within sedimentary records (Fortin et al., 2013; Foucher et al., 2014). This technique was already shown to be useful for detecting high-resolution cyclicity in sediment cores (e.g paleoclimate oscillation: St-Onge and Long, 2009), instantaneous deposits (Fouinat et al., 2017; Richardson et al., 2018), correlation with changes in particle size (Boespflug et al., 1995), the quantification of biogenic structures (Rosenberg et al., 2007) or again to track flood deposits using a multiproxy approach (Støren et al., 2016).
In the current research, we tested the potential of CT-Scan profiles for detecting at a ultra-high resolution, the frequency of detrital layers deposited in response to heavy rainfall events over the last 120 years. The specific objectives of this article are therefore: (1) to determine the potential of CT-scan to detect the sequence of individual detrital deposits; (2) to correlate these layers with the occurrence of heavy rainfall events during the last 60 years; (3) to estimate the frequency and the intensity of these events during the last century and finally, to identify trends in precipitation.
2. Site and methods
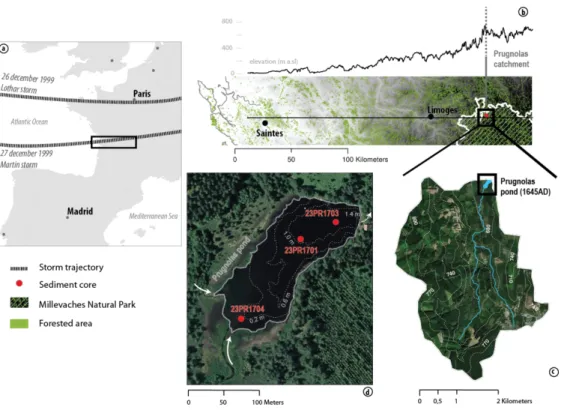
The Prugnolas pond catchment (45°51'52.5"N 1°54'04.0"E) is a small headwater catchment (7.8 km²) located in the northwestern part of the French Massif Central (highland area), (Fig. 1a & 1b). This site is situated on the northwestern edge of the Millevaches Natural Regional Park. It corresponds to the first mountainside since the Atlantic Ocean (elevation ranging between 660 and 830 m a.s.l at the study site) - (Fig. 1b).
Currently, the Prugnolas catchment is - like the Millevaches Natural Park - mostly occupied by forests (respectively 82% and 70% of their surface area): the rest of the catchment being covered with artificial or natural grassland (16% of the Prugnolas catchment area). The surface area occupied by forests significantly increased during the second part of the 20th century: only 30% of the catchment was occupied by woodland in 1950 (Foucher et al., submitted). Major afforestation works were conducted in the early 1950s (National Office of Forest information).
This region has a humid oceanic climate: average annual precipitations amount to around 1550 mm (Météo France), and the site is exposed to a large number of Atlantic depressions and storms. During the last century, three major windstorms hit this area in 1951, 1982 and 1999 (with gusting winds reaching up to 169, 157 and 130 km.h-1, respectively (Jubertie, 2006)). In addition, 15 regional historical floods were recorded in this area between 1904 and 2009. Most of them were induced by heavy rainfall events (e.g. 163 and 160 mm in 1960 and 2001 – Météo France data). Among these regional floods, the 1993, 1982, 1960 and 1944 events have generated extensive damage to infrastructure and housing in those areas located downstream of the investigated catchment. Historical rainfall events and their characteristics were summarized in Table 1.
A small pond dating back to 1645 A.D and located at the catchment outlet has potentially recorded these climatic events (Fig. 1c & 1d). It is a north-south oriented water body with a surface of 1.8 ha. This shallow water body has an average depth of 0.65 m. The deeper part is located in the vicinity of the dam on the north-west (1.50 m) edge, while the shallowest part is located nearby the progradation of the sandy delta, on the southern part (0.2m depth). The deltaic area extends upstream towards a sandy shallow river.
2.2 Materials and methods
Sediment cores (n=3) with a length ranging between 56 and 82 cm were retrieved in the Prugnolas pond along an upstream-downstream profile (Fig. 1.d) with an Uwitec gravity corer equipped with a 90 mm PVC liner.
Laboratory analyses
Relative sediment density was recorded every 0.6 mm along the sediment sequences using Computer Tomography (CT-scan) images obtained using those facilities (Siemens Somatom 128 Definition AS scanner) available at the CIRE platform (Surgery and Imaging for Research and Teaching; INRA Val de Loire, France). Relative density values were extracted from the scanner images using the free software ImageJ (Schneider et al., 2012). The relative values of density were calibrated by measuring the absolute dry bulk density (g.cm-3) in samples collected randomly along the cores.
Particle size analyses were undertaken every 0.5 cm using a Malvern Mastersizer 3000 grain-sizer (allowing theoretically measurements on particle fractions comprised between 0.01 and 3500 µm). This analysis was performed after removing the organic material with a hydrogen peroxide solution (H2O2 30% during 48h).
Sediment core dating
The chronology of the master core (23-PR-1701) was established using excess of Lead-210 (210Pbex) and Caesium-137 (137Cs) activities analyzed in 15 samples of dried material (~10g). These gamma spectrometry measurements were obtained with the very low background GeHP detectors available at the Laboratoire des Sciences du Climat et de l’Environnement (Gif-sur-Yvette, France). Radionuclide activities were decay-corrected to the sampling date (Evrard
et al., 2016).
Ages were determined using the Constant Rate of Supply model (CRS), (Appleby & Oldfield, 1978). This model assumes a constant rate of unsupported Lead-210 (210Pbex) from atmospheric fallout, although sediment accumulation is allowed to vary. For improving the 210Pbex age model validation, the corrected CRS model described in Appleby (2001) was used. Model validation was carried out through the identification of those deposits tagged with peak 137Cs concentrations. This artificial radionuclide may originate from two sources in Western Europe: thermonuclear weapon testing (maximal emission in 1963) and the Chernobyl accident (1986). To distinguish between both potential 137Cs sources, Americium-241 (241Am), which regrows from 241Pu, was used to identify the 137Cs peak attributed to the maximum nuclear bomb fallout (e.g Cambray et al., 1989).
Rainfall database
Daily rainfall information was extracted from the SAFRAN climate database produced by the official French meteorological agency (Météo France) and available since 1960 along a 8km resolution grid. Four grid points cover the study area, and their mean value was calculated to obtain average weather daily values.
In addition to these weather data, a database produced by the National Forest Office (ONF), reporting the damages affecting the forest on the study site since 1965 was used. This information is used to check the occurrence of links between major weather events and the disturbance of forested areas. Furthermore, regional data reporting the occurrence of major floods events associated with heavy rainfall – storm events were collected for the last century (French governmental database), Table 1.
Statistical analyses
The Mann-Kendall non-parametric test (MK-test) was used for detecting monotonic trends in temporal series (Warren & Gilbert, 1988) and it confirmed the occurrence of monotonic upward or downward trends of a given variable throughout time (with a p-value level of 0.05). Trends can be positive, negative or non-null. Then, the non-parametric homogeneity test (Buishand test) was used for detecting the occurrence of changes in temporal series (Buishand, 1982). Buishand test with a p-value <0.05 indicated a heterogeneous temporal trend between two periods.
3. Results
3.1 Cores description
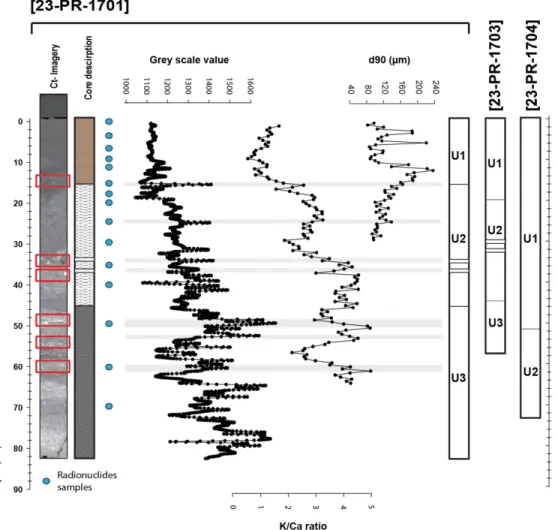
The upper part of the three cores was composed of fine (d50: 20 ± 2µm) brown-coloured sediment. This layer was rich in pine needles deposited horizontally. The first unit (U1) was found at 15.5 cm in the 23-PR-1701 core and at 50 cm depth in the 23-PR-1704 core (Fig. 2). The upper 4 cm of this unit showed a decrease in needle concentrations.
A second unit (U2) was present in the 23-PR-1701 core between 15.5 and 45 cm depth and between 20 and 42.5 cm in the 1703 core (Fig. 2): U2 was absent from the 23-PR-1704 deltaic core. This facies was composed of a fine brown material with properties similar to those found in the first unit (d50: 18 ± 2µm). The main difference between these two units was the absence of needles and the occurrence of denser sediment in Unit 2 (average density in Unit 1 = 0.16 g.cm-3 and Unit 2 = 0.38 g.cm-3). Within this unit, light-coloured levels identified with the scanner imagery were visible at 28, 29 and 37 cm in core 23-PR-1703. These layers were also visible at 33 and 36 cm depths in core 23-PR-1701. These lighter-coloured levels correspond to denser layers.
The transition between U2 and U3 was clearly marked in the 1701 and 23-PR-1703 cores (respectively at 45 and 42.5 cm depth), (Fig. 2). U3 was composed of black sediment with a lumpy aspect. This denser layer (0.5 g.cm-3) was rich in mica and sands. No specific
sandy layer could be identified in this unit. A coarser deposit was present at the base of the 23-PR-1703 core (1 cm diameter gravels at 51 cm depth).
3.2 Radionuclide activities and core chronology
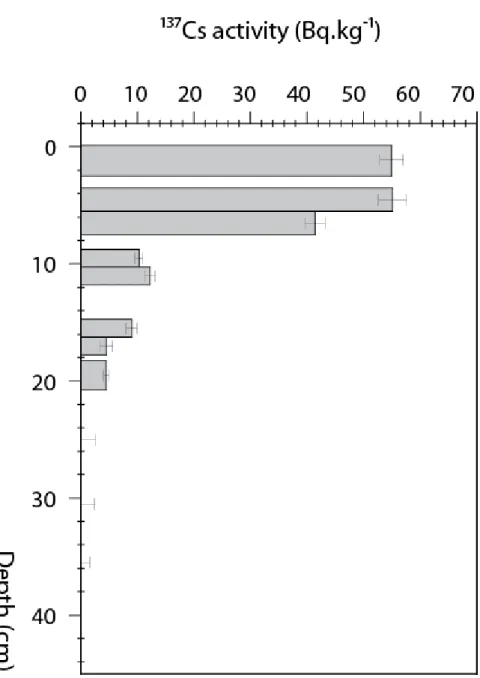
137Cs activities were detected between 20 and 21 cm depth in the 23-PR-1701 core (4.5 ± 0.5 Bq.kg-1), (Fig. 3). No radio-cesium peak may be clearly attributed to the 1963 fallout in this sequence (Fig. 3). Fallout attributed to 1986 was detected at 11.5 cm depth (12.2 ±0.8 Bq.kg-1) with a slight increase of 137Cs activity (Fig. 3). In the upper part of the core, concentrations show a significant rise of 137Cs concentrations: activities increased from 9.3 ± 0.6 Bq.kg-1 at 9 cm depth to 49.7 ± 2.2 at 5 cm depth (Fig. 3).
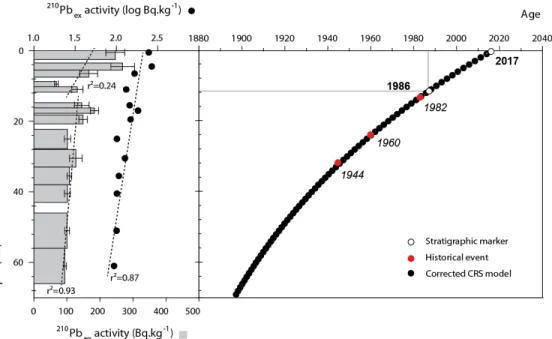
The 210Pbex records showed the occurrence of two trends: the first between 1 and 15.5 cm depth (r²=0.24) and then the second between 15.5 and 70 cm depth (r²= 0.93), (Fig. 4). The Log 210Pbex model created for the entire core (linear regression r²=0.87) was used to date the transition between the units U1 and U2 to 1982. A major windstorm occurred on that year and left many damages in the forest. The above-mentioned massive deposit of pine needles was attributed to the post-windstorm deposits.
In the upper part of the core, a decline of 210Pbex activities was recorded at 9 and 24 cm depth. In these levels, concentration decreased from 184 ± 12 Bq.kg-1 (17 cm depth) to 68 ± 6 Bq.kg -1 (9cm depth), and then from 127 ± 19 Bq.kg-1 (30 cm depth) to 102 ± 10 Bq.kg-1 (24 cm depth). These two layers were dated to 1993 (standard deviation, SD: 0.2 yrs) and 1960 (SD: 0.7 yrs). These periods correspond to the occurrence of two major rainfall events (with respectively 70 and 163 mm), which have resulted in historical regional floods. Identification of these layers was in agreement with the age model constructed for the upper part of the core. Additionally, 137Cs time markers were found at the expected level (corresponding to 1986).
For the 1900-1960 period, few stratigraphic layers showed an atypical composition except for the denser deposit detected with the CT-scan at 33 cm depth and dated to 1942. This layer was attributed to the major regional flood that occurred in 1944.
3.3. Sediment deposition between 1960-2017
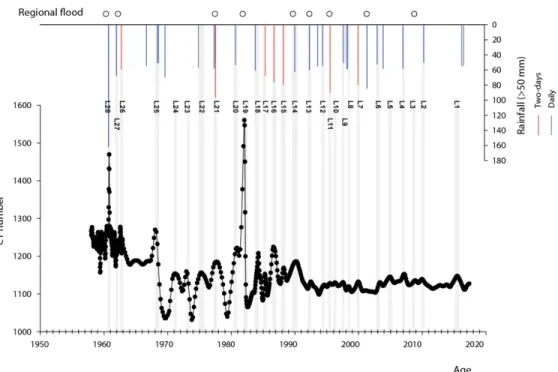
During the last 57 years (1960-2017), 28 denser layers were identified with the CT-Scan (Fig. 5), with the mean occurrence of a dense layer every 2.1 years (SD: 1.3 year). The detailed properties of these layers are summarized in Table 2.
The densities extracted from scanner profile were calibrated using density measurements (r²=0.85). They ranged between 0.13 g.cm-3 and 0.57 g.cm-3 (respectively for layers L8 and L19 (Table 2)), with an average density of 0.2 g.cm-3 (SD: 0.1 g.cm-3). These values have become significantly lower since 1990. Two levels showed a very high CT-scan intensity in 1982 and in 1960 (L19 and L28), corresponding to the two highest densities found in the upper part of the core (Table 2). These layers remained relatively thin with thicknesses varying between 0.1 and 0.75 cm (with an average thickness of 0.37 cm (SD: 0.16 cm). Eighty-two % of the layers showed a thickness lower than 0.5 cm.
In order to compare the link between those denser layers and the occurrence of significant meteorological events, a cumulative rainfall threshold was fixed to identify those ‘heavy’ rainfall events. For the study area and the wider Massif Central Region, a previous study compiled historical weather information and estimated this limit to 50 mm within 24 hours (Jubertie, 2006).
For the 1960-2017 period, 23 rainfall events exceeding 50 mm.day-1 were recorded in the study site, which represents a frequency of one heavy rainfall event occurring every 2.4 years. The heaviest event was recorded in 1960 with 162-mm cumulative rainfall. The average rainfall amount associated with the heavy events is 63 mm (SD: 23 mm). They occurred mainly during the summer and winter periods, with respectively 33 and 28% of the events (vs. 19 and 18% during spring and autumn). A lower proportion of these events (25%) occurred during the same year (with only few months between successive events). Consequently, individual events occurring within the same year were likely not distinguished. A total of 16 individual heavy rainfall events were finally selected.
In addition of these individual daily events, those events generating cumulative rainfall exceeding 50 mm during two successive days were also identified. During the 1960-2017 period, seven 2-day events were found, with rainfall ranging from 82 to 160 mm (mean: 97 mm, SD: 28mm).
Among the 28 denser sediment layers detected with the scan, 14 units were correlated to intense daily rainfall (52%) and 7 of these were associated with two-day cumulative rainfall (26%). The other layers could not be correlated to heavy rainfall events (Table 2). Errors associated with the corresponding years were estimated between -0.9 and +1.3 year (mean: 0.1 yr, SD: 0.48 year). Among the selected rainfall events, only two rainstorms (those of 1969 and 2010) could not be associated with sediment layers in the Prugnolas sedimentary archive.
Changes in particle size measured with a 0.5 cm resolution were observed in 26% of the 28 levels detected with the scanner imagery (n=7) in the upper part of the core.
The d50s of these layers ranged between 19.4 and 25.7 µm with an average value of 23.4 µm (SD: 2.3µm). The d50 in all the layers of the upper part of the core was around 17.2 µm (SD: 0.5µm). Of the seven layers with a coarser particle size, six were associated with the occurrence of a heavy rainfall event.
3.5 Sediment deposition between 1900 – 1960
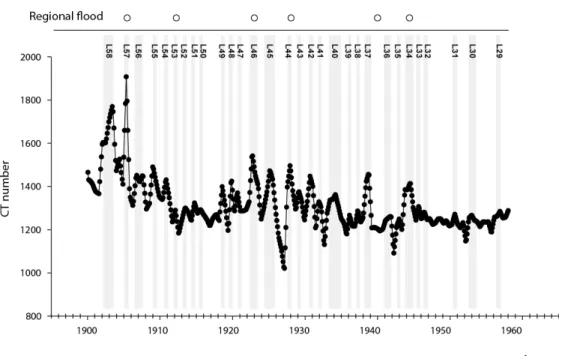
Data extracted from the CT-Scan records showed the occurrence of 30 denser layers during this 60 year period, which represents on average one event every 1.7 year (SD: 0.7 year). (Fig. 6). The densities of these levels ranged between 0.24 g.cm-3 and 0.9 g.cm-3 (respectively for layers L29 and L59 (Table 3)) with an average density of 0.4 g.cm-3 (SD: 0.1 g.cm-3). The CT-scan intensity of these deposits was clearly higher than in those layers identified in the upper part of the core especially for the layers L34, 37, 44, 46, 57 and 59 (deposited respectively in 1944, 1938, 1927, 1922, 1905 and 1903 according to the 210Pbex model). (Table 3).
These layers were relatively thin with values ranging between 0.1 and 1.1 cm respectively for layers L47 and L40, with an average thickness of 0.5 cm (SD: 0.22 cm). Sixty-three % of the detected layers had a thickness lower than 0.5 cm.
In contrast to the period covered in the upper part of the core, no daily meteorological data was available for the 1900-1960 period to test the occurrence of a correlation between those denser deposits and heavy rainfall events or major human disturbances.
4. Discussion
CT-scan imagery provided an effective technique for the detection with a ultra-high resolution of 58 denser layers that deposited in this lake during the last century. These deposits were highly correlated to the occurrence of heavy daily or two-day rainfall events (75%; n=21 rainfall events >50mm) during the period for which rainfall monitoring was available (last 60 years, n=28 deposits). Only one layer, L19 (1982), was associated with a less intense event (41 mm.day-1) and a windstorm. This event triggered a regional flood. These results demonstrate the high potential of this proxy for detecting individual detritical layers generated by intense rainfall events during a period of lower anthropogenic impact. This high resolution proxy (0.6 mm) is not the only indicator used to reach this goal. Previous research has already successfully made a correlation between meteorological data (rainfall, flood or windstorm events) and other
high resolution sedimentary proxies (e.g Affouri et al., 2017). For example, winter rainfall was reconstructed over the last 500 years using thickness of annual calcite deposited in sedimentary deposits with a 15 µm resolution in Spain (Romero-Viana et al., 2011). In the foothills of the Spanish Pyrenees, detritical layers were detected in a varved lake for reconstructing those trends in heavy rainfall (Corella et al., 2016). In Germany, windstorms were identified during the 1961-2001 period using quartz grain size (micrometer resolution; Pfahl et al., 2009). Other studies mainly focused on the identification of major historical events using a large variety of proxies (e.g. grain size, radionuclides, geochemistry), (e.g. Chapron et al., 2007; Dhivert et al., 2015) although they generally achieved a lower temporal resolution.
In the current research, CT-scan data allowed the detection of the majority of those intense rainfall events. Furthermore, every known historical event recorded in the lower part of the Prugnolas catchment during the last 60 years was identified in this sequence (1995, 1993, 1990, 1986, 1982, 1979, 1963 and 1960). Four of these events were associated with a decline in 210Pbex concentrations (1995, 1993, 1986 and 1960). In uncultivated soil, the maximum 210Pbex concentration is found near the surface (in the top 10 cm, Caitcheon et al., 2012). Accordingly, a low concentration of this radionuclide indicates a dominant contribution of sediment originating from deeper soil erosion, channel or gully erosion (Evrard et al., 2016). These four regional floods were amongst the most destructive experienced over the last 60 years. The observed decrease of 210Pbex concentrations for the corresponding periods may reflect an increase of gully and channel erosion. Accordingly, the combined use of CT-Scan and radionuclide analyses may provide a powerful technique to identify the source of flood deposits.
However, several detritical layers were not correlated to intense rainfall events (18%, n=5). They were likely associated with human management operations (afforestation works) within the catchment, especially after 2000 (n=3). The 1999 storm is the most powerful hurricane recorded over the last century in this region (maximum wind speed of 148 km/h, in Limoges (Fig. 1)). It devastated a significant portion of the forest cover. Nearby the pond, 15 ha of forest fell down. However, neither an increase of the corresponding layer density nor the occurrence of an intense rainfall event was associated with this windstorm. From 2001-2002 onwards, forest management operations were implemented in the catchment to clear the fallen trees and replant these surfaces. These practices were recorded in the sediment sequence accumulated in the pond as a change in sediment properties reflecting a change of sediment source was observed. Accordingly, 137Cs activities increased 5-fold from 10.3 ± 0.7 Bq.kg-1 in 1995 to 55.1 ± 2.5 Bq.kg-1 in 2005. 137Cs is predominantly fixed to fine particles (He & Walling, 1996; Wallbrink & Murray, 1996). In undisturbed soils, this radionuclide remains concentrated
near the surface with a concentration decreasing exponentially with depth (e.g. Matisoff et al., 2005). In contrast, in cultivated soils, the 137Cs is homogenized by tillage (Olley et al., 2013). Sediment supplied by the erosion of surface layers often have elevated 137Cs concentrations whereas sediment generated by subsoil erosional processes, like channel bank erosion, show low 137Cs concentrations (Foucher et al., 2015; Lepage et al., 2015; Le Gall et al., 2017). The supply of sediment with elevated 137Cs concentrations after the 1999 windstorm therefore likely reflects a shift in sediment sources with an increase of surface soil contributions associated with the major management disturbances observed in forest areas. This period of increased sediment connectivity likely facilitated the transfer of material from upper parts of the catchment to the pond during less intense rainfall events than during the previous periods (Paimin, 2017). Those detritical layers, which were not correlated to major rainfall events (2015, 2009, 2005), were therefore likely generated by events with lower rainfall intensities during a period of human disturbance nearby the pond.
Over the entire centennial sequences, a significant decline in deposit intensity was observed (Mann-Kendall test - p-value <0,0001) – (r²=0.55), (Fig. 7). Homogeneity Buishand statistical test (p-value <0,0001) showed the occurrence of a break-in-slope in this negative trend around 1970-1971.
During the 20th century, land cover in this region changed significantly, with the massive conversion of cropland and grassland into forests in response to the rural depopulation (after the end of WWII) – (Foucher et al., submitted). Deforestation and cultivation rank with urbanization among the major factors increasing flood severity and frequency at the catchment scale (de la Paix et al., 2011; Reinhardt-Imjela et al., 2018). Previous research also showed that land use change has even more pronounced effects on flood severity in smaller catchments (Tollan, 2002). Progressive land abandonment and afforestation in the Prugnolas catchment likely generated a decrease of the sediment quantity supplied to the lake during intense rainfall events with the extensive development of forest cover. Although this remains debated in the literature, the planting of forests to act as a buffer against floods appears to be effective in small catchments (van Dijk et al., 2009; Bradford et al., 2012).
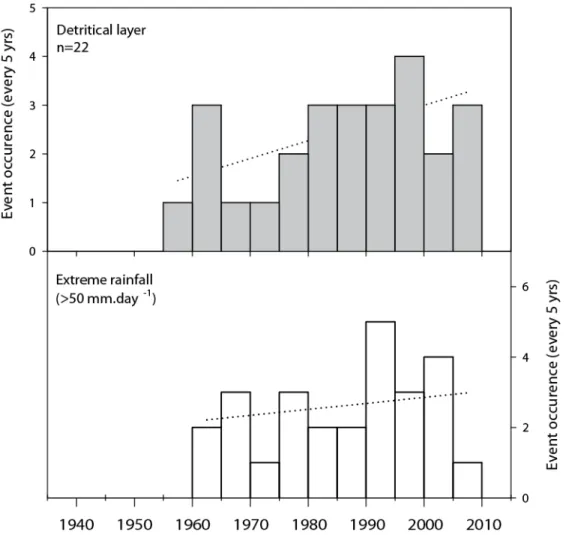
In the Prugnolas Pond sediment sequence, the occurrence of detritical layers associated with intense rainfall events (>50 mm per day/two days for this site) has shifted from the occurrence of 5 events between 1960 and 1970 to that of 8 events between 2000 and 2010 (60% increase). In the meantime, the number of denser sediment layers increased for 4 units between 1960 and 1970 to 7 units between 2000-2010 (75% increase), (Fig. 8). Both trends are correlated (r2=0.60). However, no statistically significant trend was clearly detected during the last 57
years using the Mann-Kendal test (p-value of 0.132). In the same way, no similar trend was detected at the scale of the last century (p-value of 0.56). These results are in agreement with those of modelling studies which showed the stable occurrence of heavy precipitation in this part of Europe (Frei et al., 2006).
Conclusions
This study demonstrated the potential of analyzing CT-scan proxies in sediment cores for detecting individual flood deposits associated with the occurrence of heavy rainfall. This robust and cost-efficient method produced ultra-high resolution data of the core relative density. Extracted values were used for identifying changes in density within a centennial sedimentary archive. After their dating with radionuclides, these layers were compared to the daily meteorological data available in the study area since 1960. A strong correlation was found between the occurrence of heavy precipitation and those denser layers during the period devoid of major human management (prior to 2000). Moreover, all historical regional floods were associated with CT-scan peaks. When combined with the 210Pbex radionuclide records, this method proved to provide a powerful technique to identify the impact of the major regional destructive floods (1995, 1993, 1982 and 1960), which supplied sediment originating from channel bank erosion.
Accordingly, CT-Scan-derived proxy may provide an additional tool for the community of sedimentologists in order to identify with a ultra-high resolution those changes in sediment records induced by anthropogenic or climatic disturbances. This method may provide a rapid high resolution characterization of the sedimentary archive before the coupling of this information with other proxies. Future research should examine the potential of this tool for reconstructing heavy rainfall series over longer time scales. Providing an improved technique to achieve this goal could contribute to improve our understanding of the impact of global changes in rainfall intensity and frequency and our capacities for predicting long term trends affecting the occurrence of extreme rainfall events.
Acknowledgements
The authors are grateful to Anne Colmar, Xavier Bourrain and Jean-Noël Gautier for their technical and financial support. This work was supported by a grant from the
Loire-Brittany Water Agency (METEOR project). The authors would also like to thank Jerome Vany (Office National des Forêts) and Peggy Chevilley (Communauté de Commune de Bourganeuf) for their precious historical information on the studied catchment. Authors gratefully acknowledge Naresh Kumar and Anastasiia Bagaeva for their help during the field survey.
References
Affouri, A., Dezileau, L. and Kallel, N. (2017) Extreme flood event reconstruction spanning
the last century in the El Bibane Lagoon (southeastern Tunisia): a multi-proxy approach.
Clim. Past, 13, 711–727.
Appleby, P.G. (2001) Tracking Environmental Change Using Lake Sediments. Volume 1:
Basin Analysis, Coring, and Chronological Techniques. 171-201 pp.
Appleby, P.G. and Oldfield, F. (1978) The calculation of lead-210 dates assuming a constant
rate of supply of unsupported210Pb to the sediment. Catena, 5, 1–8.
Arnaud, F., Lignier, V., Revel, M., Desmet, M., Beck, C., Pourchet, M., Charlet, F., Trentesaux, A. and Tribovillard, N. (2002) Flood and earthquake disturbance of 210Pb
geochronology (Lake Anterne, NW Alps). Terra Nov., 14, 225–232.
Ashi, J. (1997) Computed Tomography Scan Image Analysis of Sediments. Proc. Ocean.
Drill. Program, Sci. Results, 156, 151–159.
Boespflug, X., Long, B.F.N. and Occhietti, S. (1995) CAT-scan in marine stratigraphy: a
quantitative approach. Mar Geol. doi: 10.1016/0025-3227(94)00129-9
Bradford, R.A., O’Sullivan, J.J., Van Der Craats, I.M., Krywkow, J., Rotko, P., Aaltonen, J., Bonaiuto, M., De Dominicis, S., Waylen, K. and Schelfaut, K. (2012)
Risk perception - Issues for flood management in Europe. Nat. Hazards Earth Syst. Sci.,
12, 2299–2309.
Buishand, T.A. (1982) Some methods for testing the homogeneity of rainfall records. J
Hydrol. doi: 10.1016/0022-1694(82)90066-X
Caitcheon, G.G., Olley, J.M., Pantus, F., Hancock, G. and Leslie, C. (2012) The dominant
Daly (NT), Mitchell (Qld) and Flinders (Qld) Rivers. Geomorphology. doi: 10.1016/j.geomorph.2012.02.001
Cambray, R.S., Playford, K. and Carpenter, R.C. (1989) Radioactive Fallout in Air and
Rain: Results to the End of 1988.
Chapron, E., Juvigné, E., Mulsow, S., Ariztegui, D., Magand, O., Bertrand, S., Pino, M.
and Chapron, O. (2007) Recent clastic sedimentation processes in Lake Puyehue (Chilean Lake District, 40.5°S). Sediment. Geol., 201, 365–385.
Christensen, J.H. and Christensen, O.B. (2003) Severe summertime flooding in Europe.
Nature, 421, 805.
Cnudde, V. and Boone, M.N. (2013) High-resolution X-ray computed tomography in
geosciences: A review of the current technology and applications. Earth-Science Rev. 123:1–17.
Corella, J.P., Valero-Garcés, B.L., Vicente-Serrano, S.M., Brauer, A. and Benito, G.
(2016) Three millennia of heavy rainfalls in Western Mediterranean: Frequency, seasonality and atmospheric drivers. Sci Rep. doi: 10.1038/srep38206
de la Paix, M.J., Lanhai, L., Xi, C., Ahmed, S. and Varenyam, A. (2011) SOIL
DEGRADATION AND ALTERED FLOOD RISK AS A CONSEQUENCE OF DEFORESTATION. L. Degrad. Dev., n/a-n/a.
Debret, M., Chapron, E., Desmet, M., Rolland-Revel, M., Magand, O., Trentesaux, A., Bout-Roumazeille, V., Nomade, J. and Arnaud, F. (2010) North western Alps
Holocene paleohydrology recorded by flooding activity in Lake Le Bourget, France.
Quat. Sci. Rev., 29, 2185–2200.
Dhivert, E., Grosbois, C., Coynel, A., Lefèvre, I. and Desmet, M. (2015) Influences of
major flood sediment inputs on sedimentary and geochemical signals archived in a reservoir core (Upper Loire Basin, France). CATENA, 126, 75–85.
Evrard, O., Laceby, J.P., Onda, Y., Wakiyama, Y., Jaegler, H. and Lefèvre, I. (2016)
Quantifying the dilution of the radiocesium contamination in Fukushima coastal river sediment (2011–2015). Sci. Rep., 6, 34828.
Evrard, O., Navratil, O., Ayrault, S., Ahmadi, M., Némery, J., Legout, C., Lefèvre, I., Poirel, A., Bonté, P. and Esteves, M. (2011) Combining suspended sediment
monitoring and fingerprinting to determine the spatial origin of fine sediment in a mountainous river catchment. Earth Surf Process Landforms. doi: 10.1002/esp.2133
Fortin, D., Francus, P., Gebhardt, A.C., Hahn, A., Kliem, P., Lisé-Pronovost, A.,
Roychowdhury, R., Labrie, J. and St-Onge, G. (2013) Destructive and non-destructive
density determination: Method comparison and evaluation from the Laguna Potrok Aike sedimentary record. Quat. Sci. Rev., 71, 147–153.
Foucher, A., Evrard, O., Chabert, C., Cerdan, O., Lefèvre, I., Vandromme, R. and Salvador-Blanes, S. Erosional response to land abandonment in rural areas of Western
Europe during the Anthropocene: a case study in the Massif-Central, France.
Foucher, A., Patrick Laceby, J., Salvador-Blanes, S., Evrard, O., Le Gall, M., Lefèvre, I., Cerdan, O., Rajkumar, V. and Desmet, M. (2015) Quantifying the dominant
sources of sediment in a drained lowland agricultural catchment: The application of a thorium-based particle size correction in sediment fingerprinting. Geomorphology. doi: 10.1016/j.geomorph.2015.09.007
Foucher, A., Salvador-Blanes, S., Evrard, O., Simonneau, A., Chapron, E., Courp, T., Cerdan, O., Lefèvre, I., Adriaensen, H., Lecompte, F. and Desmet, M. (2014)
Increase in soil erosion after agricultural intensification: Evidence from a lowland basin in France. Anthropocene, 7, 30–41.
Fouinat, L., Sabatier, P., Poulenard, J., Reyss, J.L., Montet, X. and Arnaud, F. (2017) A
new CT scan methodology to characterize a small aggregation gravel clast contained in a soft sediment matrix. Earth Surf. Dyn., 5, 199–209.
Frei, C., Schöll, R., Fukutome, S., Schmidli, J. and Vidale, P.L. (2006) Future change of
precipitation extremes in Europe: Intercomparison of scenarios from regional climate models. J Geophys Res Atmos. doi: 10.1029/2005JD005965
Grangeon, T., Manière, L., Foucher, A., Vandromme, R., Cerdan, O., Evrard, O., Pene-Galland, I. and Salvador-Blanes, S. (2017) Hydro-sedimentary dynamics of a drained
agricultural headwater catchment: A nested monitoring approach. Vadose Zo J. doi: 10.2136/vzj2017.05.0113
He, Q. and Walling, D.E. (1996) Interpreting particle size effects in the adsorption of 137Cs
and unsupported 210Pb by mineral soils and sediments. J Environ Radioact. doi: 10.1016/0265-931X(96)89275-7
Hirabayashi, Y., Mahendran, R., Koirala, S., Konoshima, L., Yamazaki, D., Watanabe, S., Kim, H. and Kanae, S. (2013) Global flood risk under climate change. Nat. Clim.
Chang., 3, 816–821.
Hodell, D.A., Evans, H.F., Channell, J.E.T. and Curtis, J.H. (2010) Phase relationships of
North Atlantic ice-rafted debris and surface-deep climate proxies during the last glacial period. Quat. Sci. Rev., 29, 3875–3886.
Ishii, Y., Hori, K. and Momohara, A. (2017) Middle to late Holocene flood activity
estimated from loss on ignition of peat in the Ishikari lowland, northern Japan. Glob.
Planet. Change, 153, 1–15.
Jubertie, F. (2006) Les excès climatiques dans le Massif central français. L’impact des temps
forts pluviométriques et anémométriques en Auvergne. Université Blaise Pascal - Clermont-Ferrand II
Le Gall, M., Evrard, O., Thil, F., Foucher, A., Laceby, J.P., Manière, L., Salvador-Blanes, S. and Ayrault, S. (2017) Examining suspended sediment sources and dynamics
during flood events in a drained catchment using radiogenic strontium isotope ratios (87Sr/86Sr). Chem. Geol., 449, 147–157.
Lepage, H., Evrard, O., Onda, Y., Chartin, C., Lefevre, I., Sophie, A. and Bonte, P.
(2015) Tracking the origin and dispersion of contaminated sediments transported by rivers draining the Fukushima radioactive contaminant plume. Proc. Int. Assoc. Hydrol.
Sci., 367, 237–243.
Macdonald, N. and Black, A.R. (2010) Reassessment of flood frequency using historical
information for the River Ouse at York, UK (1200–2000). Hydrol. Sci. J., 55, 1152– 1162.
Matisoff, G., Wilson, C.G. and Whiting, P.J. (2005) The7Be/210Pbxs ratio as an indicator
of suspended sediment age or fraction new sediment in suspension. Earth Surf. Process.
Landforms, 30, 1191–1201.
Mena, A., Francés, G., Pérez-Arlucea, M., Aguiar, P., Barreiro-Vázquez, J.D., Iglesias, A. and Barreiro-Lois, A. (2015) A novel sedimentological method based on
CT-scanning: Use for tomographic characterization of the Galicia Interior Basin. Sediment.
Nakashima, Y. and Komatsubara, J. (2016) Seismically induced soft-sediment deformation
structures revealed by X-ray computed tomography of boring cores. Tectonophysics,
683, 138–147.
Navratil, O., Evrard, O., Esteves, M., Legout, C., Ayrault, S., Némery, J., Mate-Marin, A., Ahmadi, M., Lefèvre, I., Poirel, A. and Bonté, P. (2012) Temporal variability of
suspended sediment sources in an alpine catchment combining river/rainfall monitoring and sediment fingerprinting. Earth Surf Process Landforms. doi: 10.1002/esp.3201
New, M., Todd, M., Hulme, M. and Jones, P. (2001) Precipitation measurements and trends
in the twentieth century. Int. J. Climatol., 21, 1889–1922.
Olley, J., Burton, J., Smolders, K., Pantus, F. and Pietsch, T. (2013) The application of
fallout radionuclides to determine the dominant erosion process in water supply catchments of subtropical South-east Queensland, Australia. Hydrol Process. doi: 10.1002/hyp.9422
Osleger, D.A., Heyvaert, A.C., Stoner, J.S. and Verosub, K.L. (2009) Lacustrine turbidites
as indicators of Holocene storminess and climate: Lake Tahoe, California and Nevada. J.
Paleolimnol., 42, 103–122.
Paimin, P. (2017) The Effectiveness of Mahogany (Swietenia macrophylla) Plantation Forest
on Controlling Erosion and Runoff. Forum Geogr., 19, 88.
Pfahl, S., Sirocko, F., Seelos, K., Dietrich, S., Walter, A. and Wernli, H. (2009) A new
windstorm proxy from lake sediments: A comparison of geological and meteorological data from western Germany for the period 1965–2001. J. Geophys. Res., 114, D18106.
Reinhardt-Imjela, C., Imjela, R., Bölscher, J. and Schulte, A. (2018) The impact of late
medieval deforestation and 20th century forest decline on extreme flood magnitudes in the Ore Mountains (Southeastern Germany). Quat Int. doi: 10.1016/j.quaint.2017.12.010
Richardson, K.N.D., Hatten, J.A. and Wheatcroft, R.A. (2018) 1500 years of lake
sedimentation due to fire, earthquakes, floods and land clearance in the Oregon Coast Range: geomorphic sensitivity to floods during timber harvest period. Earth Surf.
Process. Landforms, 43, 1496–1517.
Romero-Viana, L., Julià, R., Schimmel, M., Camacho, A., Vicente, E. and Miracle, M.R.
based on calcite laminated sediment from Lake La Cruz. Clim Change. doi: 10.1007/s10584-010-9966-7
Rosenberg, R., Davey, E., Gunnarsson, J., Norling, K. and Frank, M. (2007) Application
of computer-aided tomography to visualize and quantify biogenic structures in marine sediments. Mar Ecol Prog Ser. doi: 10.3354/meps331023
Sakaguchi, A., Yamamoto, M., Sasaki, K. and Kashiwaya, K. (2006) Uranium and thorium
isotope distribution in an offshore bottom sediment core of the Selenga Delta, Lake Baikal, Siberia. J. Paleolimnol., 35, 807–818.
Schillereff, D.N., Chiverrell, R.C., Macdonald, N. and Hooke, J.M. (2014) Flood
stratigraphies in lake sediments: A review. Earth-Science Rev. 135:17–37.
Schneider, C.A., Rasband, W.S. and Eliceiri, K.W. (2012) NIH Image to ImageJ: 25 years
of image analysis. Nat. Methods, 9, 671–675.
Shabalova, M. V., Können, G.P. and Borzenkova, I.I. (1999) Precipitation change: Model
simulations and paleoreconstructions. Clim Change. doi: 10.1023/A:1005455707323
Simonneau, A., Chapron, E., Courp, T., Tachikawa, K., Le Roux, G., Baron, S., Galop, D., Garcia, M., Di Giovanni, C., Motellica-Heino, M., Mazier, F., Foucher, A., Houet, T., Desmet, M. and Bard, E. (2013) Recent climatic and anthropogenic imprints
on lacustrine systems in the Pyrenean Mountains inferred from minerogenic and organic clastic supply (Vicdessos valley, Pyrenees, France). Holocene. doi:
10.1177/0959683613505340
Soutar, A. and Crill, P.A. (1977) Sedimentation and climatic patterns in the Santa Barbara
Basin during the 19th and 20th centuries. Bull. Geol. Soc. Am., 88, 1161–1172.
St-Onge, G., Chapron, E., Mulsow, S., Salas, M., Viel, M., Debret, M., Foucher, A., Mulder, T., Winiarski, T., Desmet, M., Costa, P.J.M., Ghaleb, B., Jaouen, A. and Locat, J. (2012) Comparison of earthquake-triggered turbidites from the Saguenay
(Eastern Canada) and Reloncavi (Chilean margin) Fjords: Implications for paleoseismicity and sedimentology. Sediment. Geol., 243–244, 89–107.
St-Onge, G. and Long, B.F. (2009) CAT-scan analysis of sedimentary sequences: An
ultrahigh-resolution paleoclimatic tool. Eng. Geol., 103, 127–133.
Physical Properties of Cored Marine Sediments. Dev. Mar. Geol. 1:63–98.
Støren, E.W.N., Paasche, Ø., Hirt, A.M. and Kumari, M. (2016) Magnetic and
geochemical signatures of flood layers in a lake system. Geochemistry, Geophys.
Geosystems, 17, 4236–4253.
Tanaka, A., Nakano, T. and Ikehara, K. (2011) X-ray computerized tomography analysis
and density estimation using a sediment core from the Challenger Mound area in the Porcupine Seabight, off Western Ireland. Earth, Planets Sp., 63, 103–110.
Tollan, A. (2002) Land-use change and floods: what do we need most, research or
management?
Van Boxel, J.H., González-Carranza, Z., Hooghiemstra, H., Bierkens, M. and Vélez, M.I.
(2014) Reconstructing past precipitation from lake levels and inverse modelling for Andean Lake La Cocha. J Paleolimnol. doi: 10.1007/s10933-013-9755-1
Van den Besselaar, E.J.M., Klein Tank, A.M.G. and Buishand, T.A. (2013) Trends in
European precipitation extremes over 1951-2010. Int. J. Climatol., 33, 2682–2689.
van Dijk, A.I.J.M., van Noordwijk, M., Calder, I.R., Bruijnzeel, S.L.A., Schellekens, J.A.A.P. and Chappell, N.A. (2009) Forest-flood relation still tenuous - Comment on
’Global evidence that deforestation amplifies flood risk and severity in the developing world’by C. J. A. Bradshaw, N.S. Sodi, K. S.-H. Peh and B.W. Brook. Glob. Chang. Biol.
Vannière, B., Magny, M., Joannin, S., Simonneau, A., Wirth, S.B., Hamann, Y., Chapron, E., Gilli, A., Desmet, M. and Anselmetti, F.S. (2013) Orbital changes,
variation in solar activity and increased anthropogenic activities: Controls on the Holocene flood frequency in the Lake Ledro area, Northern Italy. Clim. Past, 9, 1193– 1209.
Wallbrink, P.J. and Murray, A.S. (1996) Distribution and variability of 7Be in soils under
different surface cover conditions and its potential for describing soil redistribution processes. Water Resour Res. doi: 10.1029/95WR02973
Warren, J. and Gilbert, R.O. (1988) Statistical Methods for Environmental Pollution
Monitoring. Technometrics. doi: 10.2307/1270090
distribution and internal geometry of the fall 2000 Po River flood deposit: Evidence from digital X-radiography. Cont. Shelf Res., 26, 499–516.
Wilhelm, B., Arnaud, F., Sabatier, P., Magand, O., Chapron, E., Courp, T., Tachikawa, K., Fanget, B., Malet, E., Pignol, C., Bard, E. and Delannoy, J.J. (2013) Palaeoflood
activity and climate change over the last 1400 years recorded by lake sediments in the north-west European Alps. J. Quat. Sci., 28, 189–199.
Wirth, S.B., Gilli, A., Simonneau, A., Ariztegui, D., Vannière, B., Glur, L., Chapron, E., Magny, M. and Anselmetti, F.S. (2013) A 2000 year long seasonal record of floods in
the southern European Alps. Geophys. Res. Lett., 40, 4025–4029.
Zolina, O., Simmer, C., Belyaev, K., Kapala, A. and Gulev, S. (2009) Improving Estimates
of Heavy and Extreme Precipitation Using Daily Records from European Rain Gauges.
J. Hydrometeorol., 10, 701–716.
---Figure captions
Figure 1: Study site location in France: (a) General localization of the study site and track of the 1999 storm, (b) topographic map and profile for the western part of the Massif Central – localization of the Millevache National Park, (c) Prugnolas catchment map, (d) Prugnolas pond map: localization of the collected cores
Figure 2: Definition of the sedimentary units along the master core 23-PR-1701 using CT-Scan imagery/grey values, K/Ca ratio and grain size analyses (d90). Correlation with the 23-PR-1702 and 23-PR-1704 cores.
Figure 3: Evolution of 137Cs activities with depth in core 23-PR-1701
Figure 4: Age depth model of core 23-PR-1701 based on 210Pbex corrected Constant Rate Supply model. Model validation was achieved by the identification of those 137Cs fallout peaks and the visual identification of sediment layers associated with flood events.
Figure 5: Detection with CT-scan profile of denser layers for the 2017-1960 period. Comparison with daily and two-days extreme rainfall (>50 mm).
Figure 6: Detection with CT-scan profile of denser layers for the 1960-1900 period.
Figure 7: Evolution of flood sediment deposit intensity (g.cm-3) during the last 120 years in the Prugnolas pond using the 23-PR-1701 core
Figure 8: Trend in frequency of heavy rainfall and denser layer records during the monitored period (2017-1960) years in the Prugnolas pond using the 23-PR-1701 core
---Table caption
Table 1: Historical climatic events record in the vicinity of the Prugnolas catchment Table 2: Properties of detritical layers deposited between 2017 and 1960
Table 3: Properties of detritical layers deposited between 1960 and 1900
---Figure 1: Study site location in France: (a) General localization of the study site and track of the 1999 storm, (b) topographic map and profile for the western part of the Massif Central – localization of the
Millevache National Park, (c) Prugnolas catchment map, (d) Prugnolas pond map: localization of the collected cores
Figure 2: Definition of the sedimentary units along the master core 23-PR-1701 using CT-Scan imagery/grey values, K/Ca ratio and grain size analyses (d90). Correlation with the 23-PR-1702 and 23-PR-1704 cores.
Figure 3: Evolution of 137Cs activities with depth in core 23-PR-1701 73x99mm (150 x 150 DPI)
Figure 4: Age depth model of core 23-PR-1701 based on 210Pbex corrected Constant Rate Supply model. Model validation was achieved by the identification of those 137Cs fallout peaks and the visual identification
of sediment layers associated with flood events. 204x124mm (150 x 150 DPI)
Figure 5: Detection with CT-scan profile of denser layers for the 2017-1960 period. Comparison with daily and two-days extreme rainfall (>50 mm).
Figure 6: Detection with CT-scan profile of denser layers for the 1960-1900 period. 195x123mm (150 x 150 DPI)
Figure 7: Evolution of flood sediment deposit intensity (g.cm-3) during the last 120 years in the Prugnolas pond using the 23-PR-1701 core
Figure 8: Trend in frequency of heavy rainfall and denser layer records during the monitored period (2017-1960) years in the Prugnolas pond using the 23-PR-1701 core
Date Flood Windstorm
2009 +
2001 +
1999 + Major Storm - human and material damage
1995 + 1993 + Major flood 1990 + 1982 + + Extensive flood 1978 + 1962 + Extensive flood
1960 + Regional flood - human and material damage
1951 +
1944 + Major flood - human and material damage
1940 +
1927 + Major flood
1923 + Major flood - large damage
1912 + Major flood
Layer
label Depth (cm) Age
Time between two-events (yrs) Layer density (g.cm-3) Layer Thickness (cm) Rainfall (mm) Date of the rainfall Age difference : layer-meteorological event Age of change in particle size Change in paticle size(d50) µm Historical regional Flood L1 05 2016 0.16 0.5 L2 2.3 2010 5.5 0.15 0.3 50 2010 -0.4 L3 3.3 2009 0.9 0.15 0.3 L4 3.9 2007 1.9 0.17 0.3 58 2007 0.1 L5 4.5 2005 2.3 0.15 0.2 L6 5.6 2004 1.5 0.14 0.3 52 2003 0.4 L7 6.1 2000 3.5 0.14 0.2 83 2001 -0.9 2001 22.4 L8 6.5 1999 1.5 0.13 0.3 59 1998 0.2 L9 7.0 1998 0.9 0.14 0.2 50 1998 -0.5 L10 7.3 1997 1.1 0.14 0.2 L11 7.7 1996 0.7 0.14 0.2 88 1995 0.6 L12 8.6 1995 1.0 0.13 0.6 54 1994 0.2 + L13 9.6 1993 2.1 0.14 0.7 60 1992 0.2 + L14 10.5 1990 2.3 0.20 0.2 62 1990 0.2 + L15 11.1 1988 2.2 0.18 0.5 84 1988 0.0 + L16 12.0 1987 1.5 0.23 0.4 84 1986 0.6 1987 22.1 L17 11.6 1985 1.4 0.16 0.2 77 1985 -0.1 1986 24.9 L18 13.1 1984 1.1 0.22 0.7 61 1984 0.3 1985 23.9 L19 15.0 1982 2.2 0.57 0.4 1982 25.7 + L20 15.3 1981 1.1 0.23 0.2 53 1981 0.1 1981 25.5 L21 16.1 1978 3.1 0.19 0.4 97 1978 0.0 + L22 16.7 1975 2.4 0.16 0.4 57 1974 1.3 L23 17.4 1973 2.5 0.17 0.2 1974 19.4 L24 17.8 1968 4.9 0.28 0.4 51 1969 -0.7 L25 18.7 1963 5.3 0.29 0.4 67 1962 0.6 + L26 22.7 1962 1.0 0.27 0.6 60 1962 -0.2 L27 24.4 1961 0.8 0.48 0.4 162 1961 0.0 +
Layer label Depth (cm) Age Interval between two-events (yrs) Layer density (g.cm-3) Intensity (%) Occurrence of a regional flood L29 25.2 19567 3.1 0.3 39 L30 27.1 1953 4.0 0.3 55 L31 28.1 1951 2.2 0.3 52 L32 29.9 1947 4.0 0.3 39 L33 30.5 1946 1.0 0.3 83 L34 31.1 1944 1.3 0.4 286 + L35 32.2 1942 2.4 0.3 69 L36 33.3 1942 0.3 0.3 89 L37 33.7 1939 3.0 0.5 365 L38 34.4 1937 1.5 0.3 114 L39 35.5 1936 1.2 0.3 86 L40 35.8 1934 1.8 0.4 255 L41 36.9 1932 2.5 0.3 160 L42 37.3 1931 0.8 0.4 185 L43 38.2 1929 1.9 0.4 101 L44 38.7 1928 1.1 0.5 282 + L45 40.0 1925 2.9 0.5 292 L46 41.1 1923 2.4 0.5 345 + L47 41.9 1921 2.0 0.4 105 L48 42.7 1920 0.8 0.4 190 L49 42.8 1919 1.2 0.4 207 L50 44.1 1916 3.0 0.3 24 L51 44.5 1915 1.0 0.3 109 L52 45.2 1913 1.6 0.3 79 L53 45.6 1912 0.9 0.3 65 + L54 46.1 1911 1.4 0.4 127 L55 46.8 1909 1.8 0.5 247 L56 47.6 1907 2.0 0.5 178 L57 48.4 1905 1.8 0.9 692
L58 48.6 1904 0.7 0.5 72 +