HAL Id: hal-02892661
https://hal.archives-ouvertes.fr/hal-02892661
Submitted on 7 Jul 2020
HAL is a multi-disciplinary open access
archive for the deposit and dissemination of
sci-entific research documents, whether they are
pub-lished or not. The documents may come from
teaching and research institutions in France or
abroad, or from public or private research centers.
L’archive ouverte pluridisciplinaire HAL, est
destinée au dépôt et à la diffusion de documents
scientifiques de niveau recherche, publiés ou non,
émanant des établissements d’enseignement et de
recherche français ou étrangers, des laboratoires
publics ou privés.
Streptomyces coelicolor
Aaron Millan-Oropeza, Céline Henry, Clara Lejeune, Michelle David,
Marie-Joelle Virolle
To cite this version:
Aaron Millan-Oropeza, Céline Henry, Clara Lejeune, Michelle David, Marie-Joelle Virolle. Expression
of genes of the Pho regulon is altered in Streptomyces coelicolor. Scientific Reports, Nature Publishing
Group, 2020, 10, pp.8492. �10.1038/s41598-020-65087-w�. �hal-02892661�
www.nature.com/scientificreports
expression of genes of the pho
regulon is altered in Streptomyces
coelicolor
Aaron Millan-oropeza
1,2,3, Céline Henry
2,3, Clara Lejeune
1, Michelle David
1&
Marie-Joelle Virolle
1✉
Most currently used antibiotics originate from Streptomycetes and phosphate limitation is an important trigger of their biosynthesis. Understanding the molecular processes underpinning such regulation is of crucial importance to exploit the great metabolic diversity of these bacteria and get a better understanding of the role of these molecules in the physiology of the producing bacteria. To contribute to this field, a comparative proteomic analysis of two closely related model strains, Streptomyces
lividans and Streptomyces coelicolor was carried out. These strains possess identical biosynthetic
pathways directing the synthesis of three well-characterized antibiotics (CDA, RED and ACT) but only
S. coelicolor expresses them at a high level. Previous studies established that the antibiotic producer, S. coelicolor, is characterized by an oxidative metabolism and a reduced triacylglycerol content
compared to the none producer, S. lividans, characterized by a glycolytic metabolism. Our proteomic data support these findings and reveal that these drastically different metabolic features could, at least in part, due to the weaker abundance of proteins of the two component system PhoR/PhoP in S.
coelicolor compared to S. lividans. In condition of phosphate limitation, PhoR/PhoP is known to control
positively and negatively, respectively, phosphate and nitrogen assimilation and our study revealed that it might also control the expression of some genes of central carbon metabolism. The tuning down of the regulatory role of PhoR/PhoP in S. coelicolor is thus expected to be correlated with low and high phosphate and nitrogen availability, respectively and with changes in central carbon metabolic features. These changes are likely to be responsible for the observed differences between S. coelicolor and S. lividans concerning energetic metabolism, triacylglycerol biosynthesis and antibiotic production. Furthermore, a novel view of the contribution of the bio-active molecules produced in this context, to the regulation of the energetic metabolism of the producing bacteria, is proposed and discussed.
The Streptomyces genus is of crucial importance for mankind since it produces more than two thirds of life-saving antibiotics1,2. Consequently, worldwide research efforts have been devoted to a better understanding of the
reg-ulation of antibiotic biosynthesis3,4 to enhance the production of these important molecules and discover novel
antibiotics5. The regulation of antibiotic biosynthesis is extremely complex as testified by the abundant literature
of the field and by recent large-scale transposition mutagenesis studies revealing that the inactivation of several hundred of genes had a positive or a negative impact on the biosynthesis of a single antibiotic (RED or ACT) in Streptomyces coelicolor (SC)6,7. Therefore, despite numerous important contributions8, a global understanding of
the complex regulation of antibiotics biosynthesis in Streptomyces, its links with primary metabolism and the role of these molecules in the physiology of the producing bacteria, is still incomplete.
The two closely related model strains, Streptomyces coelicolor (SC)9,10 and Streptomyces lividans (SL)11 have
been extensively studied to address these questions. These strains, despite their phylogenetic proximity (93% of the genes present in one strain have orthologs in the other strain) have drastically different abilities to produce three well characterized bioactive secondary metabolites, the peptide Calcium Dependent Antibiotic (CDA), the hybrid peptide-polyketide red antibiotic undecylprodigiosin (RED) and the blue polyketide antibiotic, actinorhodin (ACT). Notably, these two strains also show a different ability to accumulate storage lipids of the TriAcylGlycerolcerol (TAG) family upon growth on the classical R2YE solid medium containing glucose as main
1Université Paris-Saclay, CEA, CNRS, Institute for Integrative Biology of the Cell (I2BC), 91198, Gif-sur-Yvette, France. 2PAPPSO, Micalis Institute, INRAE, AgroParisTech, Université Paris-Saclay, Jouy-en-Josas, France. 3These authors
contributed equally: Aaron Millan-Oropeza and Céline Henry. ✉e-mail: marie-joelle.virolle@i2bc.paris-saclay.fr
open
carbon source12–14. On this medium, the weak antibiotic producer, SL, accumulates TAG but exclusively in
con-ditions of phosphate (P) limitation, as most micro-organisms15,16. In contrast, the TAG content of SC remains at
a low level throughout growth in phosphate limitation or proficiency14. This suggested the existence of a reverse
correlation between the ability to accumulate TAG and that to synthesize antibiotics. However, we noticed that when SL and SC were grown on the same solid R2YE medium but with glycerol instead of glucose, as main car-bon source, SC, while still producing antibiotics, was able to accumulate TAG, although to a lower level than SL (this study). In order to achieve a better understanding of the metabolic features underpinning the contrasted biosynthetic abilities of these two strains in relation to the nature of the carbon source used for growth (glucose or glycerol), a quantitative shotgun label-free comparative proteomic analysis was conducted.
In this study, the number of proteins showing significant differences in their abundance between SC and SL was 3 fold higher (1040 versus 360) than in our previous study carried out in liquid cultures in micro-aerobiosis17.
This allowed a much better understanding of the metabolic differences between the two strains and revealed the unexpected significantly lower abundance, in SC compared to SL, of the sensor kinase PhoR and the response regulator PhoP. This two-component system is known to control positively and negatively, respectively, phosphate (Pi)18–20 and nitrogen (N) assimilation21–23. The low abundance of PhoR/PhoP in SC resulted in the tuning down
of its regulatory role and thus in a lower abundance of proteins involved in Pi scavenging and uptake in SC than in SL, leading to a severe Pi limitation in SC. In contrast, the relieve of the repressing effect that PhoP exerts on N assimilation is expected to lead to higher N availability in SC compared to SL. Furthermore, our study also revealed putative novel PhoP regulatory targets involved in carbon as well as iron metabolism. The differential expression of the numerous Pho targets in the two strains contributed to their contrasting metabolic features. Indeed, SL is characterized by a glycolytic metabolism allowing TAG accumulation whereas SC is characterized by an oxidative metabolism generating abundant ATP and oxidative stress14,17. A novel view of the role played by
the produced antibiotics in the regulation of the energetic metabolism of the producing bacteria in condition of Pi scarcity is proposed and discussed.
Results
Bacterial growth and biochemical analysis.
In this study the classical solid R2YE medium with no phosphate added (condition of Pi limitation) was used to cultivate SC and SL. This medium contains 1 mM free P but most of the phosphate is organic phosphate present in the yeast extract. Similarly, most N present in this medium resides in organic molecules (amino acids, yeast extract). Access to organic P and N thus first requires the specific induction of enzymes involved in the degradation of these molecules.Spores (106) of SL and SC were plated on cellophane disks (porous to nutrients) deposited on the surface of
plates of solid R2YE medium limited in Pi and supplemented with either glucose (50 mM) or glycerol (100 mM), as main carbon sources. Growth per plate was estimated by dry biomass weight (Fig. 1A). On glycerol, growth of the two strains was similar, however since SL showed an extended lag phase of 24 h, biomass yields of SL were slightly lower than those of SC. In contrast, on glucose, growth of SC was severely retarded compared to that of SL from 36 h onward. Consistently, the consumption of glucose was less active in SC than in SL (Fig. 1B) and the total Fatty Acid Methyl Esters (FAME) content of SC was 2 to 4 fold lower than that of SL (Fig. 1C). In contrast the two strains consumed glycerol at a similar rate and their FAME content was rather similar at 36 h and 48 h but at 72 h the FAME content of SL was 1.8 fold higher than that of SC. The FAME content of SC was 3.6 fold higher on glycerol than on glucose whereas that of SL was only 1.6 fold higher on glycerol compared to glucose. These data indicated that glycerol was more lipogenic than glucose for both strains. On solid (this study) as in liquid R2YE glucose medium17, SC consumed proline, the most abundant amino acid of the medium (0.3 g/l) likely to
constitute the major NH4+ source, at a greater rate and finally completely compared to SL (Fig. 1B) whereas this
difference was less pronounced on glycerol. Interestingly the absence (in glucose) or reduced (in glycerol) TAG accumulation in SC was correlated with ACT and RED biosynthesis (Fig. 1D). In order to obtain a better under-standing of molecular basis of the different growth rate and biosynthetic abilities of the two strains in relation to the nature of the carbon sources used for growth, a deep shotgun label-free comparative analysis of the proteomes of SL and SC was carried out, at 36 h, 48 h and 72 h, in the presence of glucose or glycerol.
Global proteome analysis.
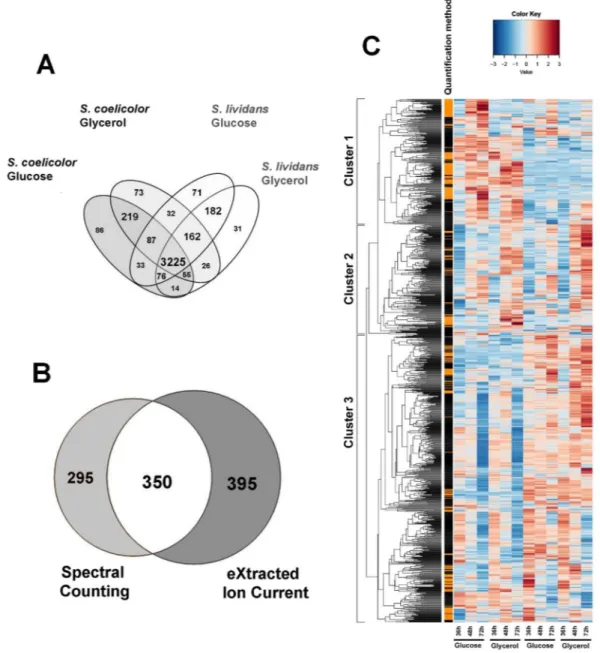
Protein quantification was performed for 42 samples out of 48. The reasons for the exclusion of these samples are detailed in Materials and Methods. A total of 4372 proteins were quantified in 42 samples by both Spectral Counts and eXtracted Ion Current (XIC) approaches, 3710 were found both in SC and SL and 378 and 284 were only detected in SC and SL, respectively (Fig. 2A, data available in File S1). These values represented approximately half of the theoretical proteome of the strains. The 1040 proteins that showed statistical abundance changes were represented in a heatmap using hierarchical clustering with Euclidean dis-tances (Fig. 2C). Among these, 295 were detected by the Spectral Counts-based method, 395 by the XIC-based method and 350 by both methods. When a given protein showed significant abundance change by both meth-ods, only the values obtained by XIC-based approach were considered since it is a more sensitive approach than Spectral Counts. The proteomes were clearly resolved into 3 main clusters that show similar trend on both carbon sources. Cluster 1 contains proteins generally more abundant in SC than in SL. This cluster includes most of the proteins involved in the biosynthesis of the canonical secondary metabolites, CDA, RED and ACT. Cluster 2 includes proteins with a similar expression pattern in both strains. Finally, cluster 3 is constituted by proteins more abundant in SL than in SC.An interesting feature revealed by this study was the significantly lower (3 to 5 fold) abundance of the sensor kinase PhoR (SCO4231) and the response regulator PhoP (SCO4230) in SC compared to SL. The relative abun-dance of proteins known to be under the positive or negative control of PhoR/PhoP was thus examined in the two strains.
www.nature.com/scientificreports
www.nature.com/scientificreports/
Proteins involved in phosphate and nitrogen assimilation are respectively down- and up-regulated
in S. coelicolor.
PhoR/PhoP is known to control positively phosphate scavenging and uptake18–20 as well asstrategies involved in Pi saving such as the replacement of phosphate rich teichoic acids by phosphate free tei-churonic acids22,24 or of phospholipids by phosphate free ornithine lipids25. As anticipated, the low abundance of
PhoR/PhoP in SC was correlated with significantly lower abundance of proteins known to be positively regulated by PhoP, in SC compared to SL (Fig. 3). This was confirmed at the transcriptional level, by qRT-PCR experiments, for 8 genes known to belong to the Pho regulon (Fig. S2A). Furthermore since most of the phosphate present in R2YE is organic phosphate, its mobilization necessitates the action of various PhoP-dependent phosphatases that were also less abundant in SC than in SL (Fig. 3A).
PhoR/PhoP is also known to regulate negatively the expression of several genes involved in nitrogen (N) assimilation21–23 either directly or indirectly via its repressive effect on the expression of GlnR (SCO4159), a major
positive or negative regulator of nitrogen (N) metabolism26–29. The expression of GlnR seems independent of N
availability but its affinity for its targets was demonstrated to be modulated by phosphorylation30. GlnR has a
pleiotropic impact on both primary and secondary cellular metabolism31 not only via its impact on the expression
of genes of N metabolism but also through the positive control it exerts on the expression of lysine deacetylases that modulate the activity of numerous proteins via removal of post-translational acetylations32. In our study,
the abundance of GlnR was too low to reveal significant difference between the two strains and most proteins belonging to the GlnR regulon had a similar abundance in the two strains. However, one notes the slightly higher abundance in SC of proteins known to be positively regulated by GlnR such as the glutamine synthetases I and II (SCO2198 and SCO2210). Since glutamine is the first amino acid to be synthesized from glutamate in condi-tions of high ammonium (NH4+) concentration, this indicated higher glutamate and NH4+ availability (likely
originating from proline degradation) in SC compared to SL. Furthermore, the high abundance of SCO7428, a protein belonging to the NsrR regulon (File S2), involved in the conversion/detoxification of nitric oxide (NO)
Figure 1. Cultures of S. lividans (TK24) and S. coelicolor (M145) grown on solid R2YE limited in phosphate
(1 mM) with either glucose (50 mM) or glycerol (100 mM) as main carbon source for 36, 48 and 72 h at 28 °C. Growth curves of S. lividans and S. coelicolor grown on glucose and glycerol (A). Concentration of glucose, proline and free phosphate in the growth medium (B). Content in Fatty Acid Methyl Esters (FAME) (C). Quantification of ACT and RED yields (D).
to nitrate33, of nitrite reductase (SCO0216-17) belonging to the dormancy regulon OsdR34 as well as of other
nitrite (NirB, SCO2487) or nitrate reductases, SCO2473 and SCO4947-48 whose expression was shown to be induced in Pi limitation35 was noteworthy in SC (File S2). This suggested the existence of NO stress detected by
the WhiB-like proteins in SC36. Such stress might contribute to the slow growth rate of SC and its entry into a
dormancy state as reported for Mycobacterium37. The predicted high N availability in SC is proposed to lead to
inhibition of TAG biosynthesis as in other micro-organisms38–40.
The relationships between P and N metabolism in Streptomycetes have been established in previous studies and our data are consistent with what was reported23. However, the proper functioning of cellular metabolism
requires the coordinated regulation of C, P, N and energetic metabolisms. In consequence, the differences in the abundance of proteins belonging to central carbon metabolism in SC and SL were examined.
Figure 2. Comparative analysis of the proteomes of S. lividans (TK24) and S. coelicolor (M145) grown on R2YE
medium limited in phosphate (1 mM) with either glucose or glycerol as main carbon source, for 36, 48 and 72 h. Venn diagram of the 3225 proteins identified using X!TandemPipeline showing significant abundance change according to strain, medium or time. (ANOVA, adjusted p value <0.05) (A). Detection of 1040 proteins with significant abundance changes: 745 quantified by XIC, 645 by Spectral Counting and 350 by both methods (B). Heatmap representation of the protein abundances estimated by the Spectral Counting and XIC approaches. Only proteins showing significant abundance change between the two strains (ANOVA, adjusted p value <0.05) are displayed. The quantification methods are displayed in the vertical bar indicating proteins quantified by Spectral Counting (orange) or XIC (black) (C).
www.nature.com/scientificreports
www.nature.com/scientificreports/
Enzymes of Glycolysis, Pentose Phosphate Pathway, Pyruvate Deshydrogenase complex and
over-flow metabolism were more abundant in S. lividans than in S. coelicolor, except SCO7511
and SCO4209.
Among the 140 proteins of carbon metabolism that showed significant abundance variation between strains and/or nature of the carbon sources, 72 proteins belong to conserved pathways of central carbon metabolism.On glucose, enzymes catalyzing the first four glycolytic steps resulting in the production of the phospho-rylated trioses GAP and DHAP were clearly more abundant in SL than in SC (Fig. 4A). On glucose, these tri-oses whose inter-conversion is catalyzed by the triose phosphate isomerase SCO1945 (TPI, step 5) can then be converted into glycerol 3 P (Glycerol3P) by glycerol 3P dehydrogenases whereas on glycerol, Gly3P results from the phosphorylation of glycerol by an ATP dependent glycerol kinase (SCO1660)41 (Fig. 4B). Gly3P is a
necessary precursor of PhosphoLipids (PL) and/or TAG biosynthesis. Step 6 is putatively catalyzed by 3 different NAD+-dependent glyceraldehyde-3-phosphate dehydrogenases (GAPDH SCO7511, SCO1947 and SCO7040), step 7 by the phosphoglycerate kinase (PGK, SCO1946), step 8 by two different phosphoglycerate mutases (PGM, SCO4209 and SCO4470), step 9 by two different enolases (ENO, SCO3096 and SCO7638) and step 10 by the pyruvate kinase (PYK, SCO2014)42. Interestingly, the Fructose bis-phosphate aldolase (SCO3649, step 4), the TPI
SCO1945, the pyruvate phosphate dikinase SCO2494 and the fructose 1, 6 bisphosphatase SCO5047 were more abundant on glycerol than on glucose in both strains at 48 h and 72 h. The abundance of these enzymes catalyzing the glycolytic steps upstream of the entry point of glycerol into glycolysis, suggests that they contribute to gluco-neogenesis from glycerol (Fig. 4A). The GADPH SCO7040, the PGK SCO1946-47, the PGM SCO4470 and the ENO SCO3096 were more abundant in SL than in SC on both carbon sources throughout growth as enzymes of
Figure 3. Heatmap representation of proteins of the Pho regulon belonging to phosphate metabolism with
significant abundance change (ANOVA, adjusted p value <0.05) between S. coelicolor (M145) and S. lividans (TK24) with either glucose or glycerol as main carbon source, for 36, 48 and 72 h. The quantification methods are displayed in the vertical bar indicating those proteins quantified by Spectral Counting (orange) or XIC (black) (A). Corresponding global trends curves (B).
the upper part of glycolysis (Fig. 4A). Interestingly the ENO SCO7638 and the PYK SCO2014 were expressed at a far higher level (up to 7 fold) than the other glycolytic enzymes in SL (Fig. 4A). In contrast, at 36 h and/or 48 h, the GAPDH SCO7511 and PGM SCO4209 were 5.6 and 1.9 fold and 2.6 and 1.7 fold more abundant in SC than in SL on glycerol and glucose, respectively.
Enzymes constituting the PPP pathway (Fig. 4C), the pyruvate dehydrogenase complex (PDH) or contributing to the generation and re-utilization of acetate (over-flow metabolism) were all more abundant in SL than in SC on both carbon sources throughout growth or at different time points (Fig. 4D). The higher abundance of these enzymes in SL compared to SC is consistent with its more active glucose uptake, higher glycolytic activity and ability to accumulate TAG, a process requiring abundant NADPH synthesized by the PPP.
PhoP likely regulates the expression of some genes encoding glycolytic enzymes.
We consid-ered the possibility that the higher abundance in SC than in SL of the GAPDH SCO7511 and the PGM SCO4209 or the lower abundance in SC than in SL of the ENO SCO7638 and PYK SCO2014 (Fig. S6A) could be due to the direct/indirect negative or positive control of the expression of their encoding genes by PhoP. In order to test this hypothesis the level of expression of these genes was assessed in qRT-PCR with RNA prepared from SL and its phoP mutant43 as well as from SC for comparison (Fig. S6B). We first noticed that protein and transcriptabun-dance were correlated in SL and SC for sco2014 and sco7638 but not for sco7511 and sco4209. This lack of correla-tion between transcriptome and proteome is not unusual and has been frequently reported44. The transcriptional
Figure 4. Independently generated heatmap representations of proteins belonging to central carbon
metabolism pathways with significant abundance change (ANOVA, adjusted p value < 0.05) between S. coelicolor (M145) and S. lividans (TK24) with either glucose or glycerol as main carbon source, for 36, 48 and 72 h. Proteins belonging to glycolysis/gluconeogenesis (A); glycerol metabolism (B); Pentose Phosphate Pathway (C); AcetylCoA generation and over-flow metabolism (D). Protein identifiers are indicated as SCO numbers for both strains and by predicted functions. The quantification methods are displayed in the vertical bar indicating proteins quantified by Spectral Counting (orange) or XIC (black).
www.nature.com/scientificreports
www.nature.com/scientificreports/
start site of these genes was positioned according to Jeong et al.45 and Pho boxes22,24,46 were searched in their
promoter regions (Fig. S6C).
qRT-PCR data indicated that the level of expression of sco7511 and sco2014 was higher in the wild type strain of SL than in its phoP mutant suggesting that the expression of these genes was under the positive control of PhoP. Inspection of the promoter region of sco2014 did not reveal the presence of a canonical Pho box (constituted by 2 direct repeats) but a half Pho box and numerous TCA repeats were found upstream of the −35 promoter region of sco2014 (Fig. S6C2) and could be the siege of a positive regulation by PhoP. Inspection of the promoter region of sco7511 did not reveal either the presence of a canonical Pho box (constituted by 2 direct repeats) but a half Pho box was detected just upstream of the −35 sequence and might play the role of activator site.
In contrast, the level of expression of sco4209 and sco7638 was slightly higher in the phoP mutant than in the wild type strain suggesting that the expression of these genes might be under the negative control of PhoP. Inspection of the promoter region of sco4209 revealed the presence of putative Pho box located downstream of its −10 promoter region (Fig. S6C3) and that of sco7638 revealed the presence of two putative Pho boxes, one overlapping the −35 promoter region (position of repressor site) and the other one found just upstream the ATG start codon (position of road block) (Fig. S6B4). These positions are consistent with the repression of sco4209 and sco7638 expression by PhoP. However, since the level of expression of these genes was not significantly higher in the phoP mutant than in SL we cannot exclude that other regulators besides PhoP contribute to their regulation.
Even if the difference of level of expression of the tested genes (especially that of sco7511 and sco2014) between the wild type and the phoP mutant of SL argues in favor of their regulation by PhoP, the functionality of the puta-tive Pho-boxes found in the promoter region of these genes should be confirmed experimentally by site-directed mutagenesis and EMSA. Furthermore most of the genes tested (except sco2014) do not show similar regulatory features in the phoP mutant of SL and in SC pointing out that SC should not be considered as a simple phoP mutant.
Enzymes of the Tricarboxylic acid cycle and those involved in the degradation of amino
acids generating reduced co-factors were up-regulated in S. coelicolor.
Most enzymes of the Tricarboxylic acid cycle (TCA) and notably those of the upper part of the TCA, the citrate synthase SCO2736 and the aconitase SCO5999 as well as the NADP+ dependent malic enzyme SCO295147, were more abundant in SLthan in SC throughout growth on glucose and glycerol, to a lesser extent. This is consistent with the more active growth and thus higher anabolic activity of SL (Fig. 5) as well as with its high TAG content since malic enzymes are thought to play a positive role (likely via NADPH generation) in lipid accumulation48,49. In contrast, enzymes
of the lower part of the TCA, that generate reduced co-factors, were 2 to 7 fold more abundant in SC than in SL on glycerol and on glucose, to a lesser extent at 48 h and 72 h (Fig. 5). These include, the NAD+-dependent isoc-itrate dehydrogenase SCO7000, as well as SCO2180, SCO2181 and SCO4919 putatively constituting the NAD+ dependent α-ketoglutarate dehydrogenase complex converting α-ketoglutarate into succinate; SCO0923 thought to be part of the FAD+-dependent succinate dehydrogenase complex converting succinate into fumarate that also constitutes the complex II of the respiratory chain and SCO4827, a NAD+ dependent malate dehydrogenase con-verting malate into oxaloacetate. This indicated that in SC the TCA is mainly fueled by α–ketoglutarate resulting from proline degradation.
Figure 5. Heatmap representation of proteins belonging to the Tricarboxylic Acid Cycle with significant
abundance change (ANOVA, adjusted p value<0.05) between S. coelicolor (M145) and S. lividans (TK24) with either glucose or glycerol as main carbon source, for 36, 48 and 72 h. Protein identifiers are indicated as SCO numbers for both strains and by predicted functions. Enzymes with asterisks are catalyzing a reaction generating a reduced co-factor. The quantification methods are displayed in the vertical bar indicating proteins quantified by Spectral Counting (orange) or XIC (black).
Furthermore, interestingly, 9 among the 36 proteins involved in amino acid degradation, showing significant abundance variation between strains and/or nature of the carbon sources, were more abundant in SC than in SL but mainly on glucose (Fig. S5). These enzymes catalyzed reactions generating reduced co-factors, including 4 enzymes involved proline catabolism (Fig. S5). The unexpected up-regulation of these enzymes in SC will be commented in the discussion.
Proteins of the respiratory chain and of the ATP synthase complex were more abundant in S.
lividans than in S. coelicolor.
Fifteen of the 17 proteins annotated as involved in the respiratory chain including ATP synthase were clearly more abundant in SL than in SC at all time points (Fig. S7). Twelve of these 17 proteins are part of the Rex regulon and are negatively regulated by Rex (http://regprecise.lbl.gov/RegPrecise/regulon.jsp?regulon_id=63393, Fig. S7). Rex senses changes in the cellular NADH/NAD+ redox balance and an
excess of NADH is thought to hinder Rex binding to its target sites. High NADH/NAD+ ratios thus result in alle-viation of Rex mediated repression50. Such regulation adjusts the abundance of proteins of the respiratory chain
to the amount of NADH generated by cellular metabolism. Eleven out of the 12 proteins belonging to the Rex reg-ulon were more abundant in SL than in SC at all time points. Only one protein of the Rex regreg-ulon, SCO4568, was more abundant in SC throughout growth on glucose. This protein is the sub-unit G of the NADH dehydrogenase constituted by 14 sub-units (A to N) encoded by the large operon SCO4562-75. The NADH dehydrogenase and the succinate dehydrogenase complex mentioned above constitute entry points for electrons into the respiratory chain and as such might be regulated differently than the other enzymes of the respiratory chain belonging to the Rex regulon. The lower abundance of proteins of the respiratory chain in SC could be seen as contradictory with the up-regulation of enzymes generating reduced co-factors and with the high intracellular ATP concentration of this strain14. However, it is possible that, in SC, high ATP levels exert a negative feedback regulatory control on
the expression of enzymes of the respiratory chain.
Lipid metabolism is more active in S. lividans than in S.coelicolor.
A major difference between SC and SL is their Fatty Acid Methyl Ester (FAME) content thought to be mostly due to their different TAG content13,14. Comparative analysis of 38 proteins annotated as involved in lipid metabolism showed a significantchange in abundance between the two strains. Among them, 19 were annotated as involved in fatty acid/lipid biosynthesis and 19 in lipid degradation.
This study revealed the slightly greater abundance (less than 2 fold) of most enzymes involved in fatty acid biosynthesis in SL compared to SC, especially on glucose (1.4 to 2 fold) (Fig. 6A). These include the regulator FasR (SCO2386)51 and most of the proteins under its positive control. Interestingly the Acyl Carrier Protein (ACP/
SCO2389) that also belongs to the FasR operon was up to 12 fold more abundant in SL than in SC on glucose, at 36 h. ACPs are critical actors in fatty acid metabolism since they covalently link all fatty acyl intermediates that are in the process of being elongated (or degraded). The greater abundance of this protein compared to that of the other proteins of the Fab operon in SL suggested that its expression might be under the positive control of another regulator besides FasR (Fig. S6A5). This other regulator could possibly be PhoP. Consistently, the expression of this gene was significantly lower in the phoP mutant than in the wild type strain of SL (Fig. S6B5) and a putative Pho box, constituted of 2 Direct Repeats (DR) of the canonical motif, was found just upstream of the −35 region of sco2389, in position of activator site (Fig. S6C5). The functionality of this putative Pho-box has to be confirmed experimentally but since PL biosynthesis mobilizes an important fraction of available Pi, phosphate and lipid metabolism ought to be linked and PL biosynthesis cannot take place if sufficient Pi is not available. Furthermore, the phosphatidic acid phosphatase SCO1102 was unexpectedly far less abundant on glycerol than on glucose in both strains. This protein dephosphorylates phosphatidic acid (PA) to DiAcylGlycerol (DAG), the precursor of TAG. The low abundance of SCO1102 on glycerol could explain the lower TAG content of SL on glycerol than on glucose even though the availability of Glycerol3P, the precursor of PA, is expected to be higher on glycerol than on glucose.
A given lipid content results from the equilibrium between synthetic and degradation processes. Most pro-teins annotated as involved in fatty acid degradation fall into two classes, those expressed early (36 and 48 h), the putative lipases or phospholipases SCO4298, SCO2892 and SCO6691 and those expressed late (72 h), the putative lipase and lysophospholipase, SCO2123 and SCO6966, both classes being more abundant in SL than in SC with a few exceptions (Fig. 6B). Early in growth, the putative phospholipase C, SCO6691, is proposed to cleave off the polar head of membranous PL yielding DAG a precursor of TAG synthesis. The two other lipases expressed early might act as acyl transferases cleaving off acylCoA from PL and transferring them on DAG to generate TAG. In contrast, the lipases expressed late might cleaved off acylCoA from TAG and the latter would be degraded by the enzymes of the β-oxidation pathways that were more abundant in SL than in SC, mainly on glucose (Fig. 6B). This would allow the generation of acetylCoA and energy, late in growth in SL. Our proteomic data are consistent with the high TAG content of SL that results from a more active lipid biosynthesis in SL than in SC, especially on glucose.
Stress responses of S. lividans and S. coelicolor differ.
The abundance of 48 proteins involved in stress and defense responses showed a significant variation according to strain, medium and/or time. These proteins fall into 3 clusters (Fig. 7A).Cluster 1 includes proteins more abundant in SL than in SC but mainly at late time points and on glycerol. These include the glyoxalases SCO7171 and SCO0477. These enzymes are thought to convert methylglyoxal (MG) into lactate. MG is a toxic by-product of glycolysis that contributes to oxidative stress52. MG is synthetized by an
MG synthase that catalyzes the elimination of phosphate from DHAP53, that might be generated in higher amount
on glycerol than on glucose. This reaction takes place when cells are starved for Pi, which is likely to be the case but mainly late in growth in SL. Some proteins involved in the maintenance of the redox balance of the cell also
www.nature.com/scientificreports
www.nature.com/scientificreports/
belonged to this cluster such as proteins involved in mycothiol (MT) biosynthesis54 or using MT as co-factor
(SCO4151, SCO1959) as well as the thioredoxin SCO5419. At last, 6 among the 9 tellurium resistance proteins (TRP) detected (SCO1903, SCO2367-68, SCO3767, SCO4277 and SCO7481) and 3 among the 5 Universal Stress Proteins (USP) detected (SCO0198, SCO0937 and SCO7299) also belong to cluster 1. The function of TRP and USP remains unclear but reports in the literature indicate that they play a role when growth slow down to improve cell survival55,56.
Cluster 3 includes proteins that were also more abundant in SL than in SC but mainly on glucose and at the three time points (Fig. 7A). These include proteins belonging to mycothiol metabolism (SCO0741 and SCO1663) and the SOD SCO5254 involved in the conversion of the anion superoxide into H2O2 as well as H2O2
scaven-gers such as the glutathione peroxidase SCO4444, the alkyl hydroperoxide reductases (SCO5031-32) and the catalase-peroxidase SCO0560. This suggested that growth on glucose generates more oxidative stress than growth on glycerol in SL.
Cluster 2 includes protein that were more abundant in SC than in SL on both carbon sources and through-out growth (Fig. 7A). These include two glyoxylases, SCO4590 and SCO6983. The abundance of these enzymes throughout the growth of SC is consistent with the severe Pi limitation characterizing this strain and thus gen-eration of MG from DHAP. Cluster 2 also includes some proteins involved in the resistance to oxidative stress such as SCO2021, DpsA (SCO0596) that contributes to DNA protection during severe oxidative stress57,58, the
superoxide dismutases (SOD) SCO0999 and SCO2633, the H2O2 scavengers including the catalase SCO0379
and the alkyl hydroperoxide reductases (SCO3132 and SCO6531). This indicates that SC suffers oxidative stress consistently with its oxidative metabolism. This cluster also includes 3 among the 9 tellurium resistance proteins (TRP) detected (SCO0641, SCO1020 and SCO1965) and 2 among the 5 the Universal Stress Proteins (USP) detected (SCO0167 and SCO0200).
Furthermore, interestingly, the anti-sigma factor antagonist SCO7324 was 30 and 10 fold more abundant in SC on glucose and glycerol, respectively at 72 h (File S1). SCO7324 is the first gene of a five-gene operon encoding several anti-sigma or anti-sigma-antagonists. It is related to RsbS and RsbR proteins involved in the
Figure 6. Independently generated heatmap representations of proteins belonging to lipid biosynthetic (A)
and degradative (B) pathways with significant abundance change (ANOVA, adjusted p value<0.05) between S. coelicolor (M145) and S. lividans (TK24) with either glucose or glycerol as main carbon source, for 36, 48 and 72 h. Protein identifiers are indicated as SCO numbers for both strains and by predicted functions. The quantification methods are displayed in the vertical bar indicating proteins quantified by Spectral Counting (orange) or XIC (black).
sensing of environmental stress and the formation of the stressosome complex in Bacillus subtilis59. Its abundance
indicates severe stress late in growth in SC. One also notes the high abundance of proteins of the dormancy regulon OsdR34 in SC (Fig. 7B). The OsdR regulon is mainly constituted by 2 large loci (SCO0161-SCO0181
and SCO0197-SCO0220) under the positive control of OsdR, the LuxR response regulator SCO0204. Some of these proteins are related to N metabolism and might be induced by NO stress as mentioned above. At last and unexpectedly 35 of the 54 proteins of the SigR regulon60 detected (among 77) were more abundant in SL than
in SC (Fig. 8B). The SigR regulon is induced when oxidation of thiols by reactive oxygen species (ROS) results in non-native disulfide bond formation in proteins. Thioredoxins61 belonging (SCO0885 and SCO3889- 3890)
or not (SCO2634, SCO2067, SCO2901, SCO5419) to the SigR regulon are involved in the reduction of these “illegitimate” bonds and were more abundant in SL throughout growth on both carbon sources. The strong and weak induction of the SigR regulon in SL and SC, respectively, was unexpected and will be commented in the discussion.
The specific metabolic features of S. coelicolor and S. lividans are correlated with the
expres-sion of specific secondary metabolites pathways.
A total of 80 proteins belonging to 17 second-ary metabolite biosynthetic pathways showed a statistically significant abundance change according to strain, medium and/or time (Figs. 9–10). Proteins belonging to the canonical NRPS cluster CDA (SCO3210-SCO3249, 10/39 proteins), the hybrid NRPS/PKS cluster RED (SCO5877-5801, 6/21 proteins) were detected at the three time points whereas those of the PKS cluster ACT (SCO5071-5092, 18/21 proteins) were detected mainly at 48 h and 72 h (Fig. 9). This proteomic profile is consistent with assays of ACT and RED antibiotics (Fig. 1D). Proteins related to γ-butyrolactone signaling, SCO6264 (FabG-like reductase), SCO6265 (ScbR γ-butyrolactone bind-ing regulator) and SCO0608 (ScbR-like γ-butyrolactone bindbind-ing regulator) that were shown to play a positive role in the regulation of CDA, RED and ACT biosynthesis62,63 showed a similar expression pattern as that ofthese antibiotics biosynthetic pathways. Proteins involved in lantibiotic (SCO6928) and dipeptide (SCO6431)
Figure 7. Independently generated heatmap representations of proteins involved in stress response and
defense with significant abundance change (ANOVA, adjusted p value<0.05) between S. coelicolor (M145) and S. lividans (TK24) with either glucose or glycerol as main carbon source, for 36, 48 and 72 h. General stress resistance proteins (clusters 1 to 3) (A). Proteins belonging to the OsdR regulon (B). Protein identifiers are indicated as SCO numbers for both strains and by predicted functions. The quantification methods are displayed in the vertical bar indicating proteins quantified by Spectral Counting (orange) or XIC (black).
www.nature.com/scientificreports
www.nature.com/scientificreports/
biosynthesis were also far more abundant in SC but mainly on glycerol (Fig. 9). Proteins of the deoxy sugar cluster (SCO0381-SCO0401) were only slightly more abundant in SC than in SL but mainly on glucose (Fig. 10D).
In contrast, all proteins of the coelimycin cluster (SCO6273-SCO6288, cluster C)64,65 were far more abundant
in SL on both carbon sources but mainly at 36 h (Fig. 10A). Proteins involved in terpene or hopene as well as in geosmin (SCO6073)66 and germicidine (SCO7221)67 biosynthesis were also far more abundant in SL at late time
points and especially on glycerol (Fig. 10E,F). These molecules are synthetized from acetyl/malonylCoA and their active synthesis in SL is consistent with the glycolytic metabolism of this strain. Furthermore, interestingly most proteins of the deferoxamine (SCO2782-85, synthetized from lysine)68 and the coelichelin (SCO0489-SCO0499,
synthetized from ornithine)69 clusters were more abundant in SL on both carbon sources at late time points or
throughout growth (Fig. 10B). The expression of the deferoxamine (desABCD) cluster is known to be under the negative control of DmdR1 (SCO4394) whose repressing effect is relieved in conditions of iron deprivation70. The
much lower expression of desA/sco2782 as well as of cchB/sco0498 of the coelichelin cluster in the phoP mutant in qRT-PCR suggested that they might be under the positive control of PhoP. However, inspection of their promoter regions did not reveal the presence of any canonical Pho-box whereas the inspection of the promoter region of DmdR1 revealed the presence of a rather convincing Pho box downstream of the transcriptional start site in posi-tion of road block (Fig. S6C6). qRT-PCR experiment confirmed the significantly higher expression of DmdR1 in the phoP mutant of SL than in the wild type strain (Fig. S6B6). The high expression of the negative regulator DmdR1 in the phoP mutant of SL (and in SC) is likely to be responsible for the very low expression of desA and cchB in this strain (as well as in SC) (Fig. S6B7–8). The negative regulation of DmdR1 expression by PhoP makes biological sense since divalent cations such as iron are often co-transported with phosphate71,72 and decreased Pi
uptake in conditions of Pi limitation, might not provide sufficient iron to fulfill cellular needs. Adaptation to such
Figure 8. Heatmap representation of proteins belonging to the SigR regulon (clusters 1 to 3) with significant
abundance change (ANOVA, adjusted p value<0.05) between S. coelicolor (M145) and S. lividans (TK24) with either glucose or glycerol as main carbon source, for 36, 48 and 72 h. Protein identifiers are indicated as SCO numbers for both strains and by predicted functions. The quantification methods are displayed in the vertical bar indicating proteins quantified by Spectral Counting (orange) or XIC (black).
iron deprivation would require the synthesis of high affinity siderophores under the indirect positive control of PhoR/PhoP.
Discussion
It has long been known that Pi limitation is a major trigger of antibiotic production in Streptomyces73. Consistently
the two component system PhoR/PhoP that, in condition of Pi limitation, controls positively Pi supply, has a neg-ative impact on antibiotic production74 whereas its disruption has a positive impact on these productions75–78.
The revelation by our proteomic study of the lower abundance of the sensor kinase PhoR (SCO4229) and its cognate response regulator PhoP (SCO4230) in the antibiotic producer, SC, compared to the none producer, SL, is consistent with this ancient knowledge. Indeed, the tuning down of the regulatory role of PhoR/PhoP in SC was shown to be correlated with low abundance of proteins involved in Pi scavenging and uptake leading to severe Pi limitation and thus energetic stress. However, paradoxically, SC is characterized by a high ATP content consist-ent with the specific up-regulation of enzymes of the TCA or of amino acids degradative pathways that generate reduced co-factors (Figs. 5 and S5). The re-oxidation of the latter by the respiratory chain likely contributes to the high ATP content of SC. We propose that such activation of the oxidative metabolism constitutes a homeostatic process to re-establish the energetic balance of SC14,79. In this context, available acetylCoA and nitrogen would be
used to fuel the TCA, precluding TAG biosynthesis in SC. Free Pi is also needed to achieve oxidative phosphoryl-ation and consistently SC was shown to consume its polyphosphate stores more actively than SL14. In contrast, the
predicted lower iron and N availability in SL compared to SC is predicted to lead to a slowing down of the TCA and thus to a reduced consumption of acetylCoA by the latter. SL is thus characterized by a glycolytic metabolism allowing TAG accumulation14. Interestingly the ppk mutant of SL is characterized, as SC, by a low TAG content
and strong antibiotic production14,80. In condition of Pi limitation, Ppk catalyzes the regeneration of ATP from
ADP and polyphosphate.80,81. As SC, the ppk mutant suffers from energetic stress and triggers homeostatic
mech-anisms comparable to those found in SC13,14.
Figure 9. Heatmap representation of proteins belonging to Calcium Dependent Antibiotic (CDA),
Red-pigmented cell-associated undecylprodigiosin (RED) and Actinorhodin (ACT) pathways with significant abundance change (ANOVA, adjusted p value<0.05) between S. coelicolor (M145) and S. lividans (TK24) with either glucose or glycerol as main carbon source, for 36, 48 and 72 h. Protein identifiers are indicated as SCO numbers for both strains and by predicted functions. ScbR proteins are underlined. The quantification methods are displayed in the vertical bar indicating proteins quantified by Spectral Counting (orange) or XIC (black).
www.nature.com/scientificreports
www.nature.com/scientificreports/
However, we think that the generation of ATP by the oxidative phosphorylation cannot last in SC since, at some point, SC would face a situation of severe Pi limitation, especially after exhaustion of its polyphosphate stores14. Interestingly, the production of the antibiotics CDA and RED occurs in this context. The production
of the ionophore CDA82 coincides with the transition phase, a phase of growth arrest characterized by extensive
breakage of cellular macromolecules83 whereas that of RED84 occurs at bit later. RED was shown to create damage
to the membrane and to promote cell death and lysis of a fraction of the population85. Programmed Cell Death
(PCD) is well documented in Streptomyces and both CDA, as RED, are likely to play a role in this process79,86.
Death and lysis of a fraction of the population would provide nutriments, and especially phosphate, to the sur-viving population. Indeed some putative nucleases (SCO1182, SCO3151 and SCO6341) as well as the adenosine deaminase (SCO4901)87 that are involved in nucleic acid and nucleotide degradation were far more abundant (up
to 10 fold) in SC than in SL, at all time points on both carbon sources (Fig. S3). Interestingly the genes sco6638, sco5329 and sco0324 encoding putative endonuclease or nucleosidase are present and expressed in SC but absent or truncated in the SL. The abundance of these proteins in SC suggests the occurrence of cell lysis and the recy-cling by this strain of the phosphate present in its nucleic acids. Another indication of cell lysis is the high abun-dance of twelve proteases early in growth on both carbon sources in SC (Fig. S4) as well as the 3 to 7 fold higher abundance of the 1,4-beta-N-acetylmuramidase (SCO6466) and alpha-mannosidase (SCO0948) involved in cell wall degradation in SC compared to SL at early time points (File S2). The degradation of these cellular constitu-ents and the resulting supply of nutrimconstitu-ents would support the temporary activation of the oxidative metabolism of this strain to restore its energetic balance79.
Nonetheless, at some point a situation of Pi starvation would occur and impair the proper functioning of the respiratory chain. This would result into the leakage of electrons toward secondary acceptors and thus the generation of oxidative stress (ROS/RNS). Since we previously demonstrated that the onset of ACT biosynthesis coincides with an abrupt drop in the intracellular ATP concentration in SC14, we propose that the
benzochro-mane quinone, ACT, as other molecules possessing quinone groups (melanine, humic acid …)88, might act
as electron acceptor, reducing electron flow through the respiratory chain and thus respiration efficiency and ATP generation79. Once charged with electrons, the resulting unstable semiquinone would be reduced by the
NADPH-dependent quinone or flavin reductases of the SoxR regulon whose expression is induced by ACT89–91.
In condition of phosphate limitation, ACT would thus somehow contribute to the regulation of the energetic state of the bacteria, reducing ATP generation in order to adjust it to low Pi availability79. Furthermore, as electron
Figure 10. Independently generated heatmap representations of proteins belonging to others secondary
metabolite pathways with significant abundance change (ANOVA, adjusted p value<0.05) between S. coelicolor (M145) and S. lividans (TK24) with either glucose or glycerol as main carbon source, for 36, 48 and 72 h. Coelimycin cluster (A). Desferroxamine cluster (B). Coelichelin cluster (C). Deoxysugar cluster (D). Terpenoid biosynthesis cluster (E). Others (F). Protein identifiers are indicated as SCO numbers for both strains and by predicted functions. The quantification methods are displayed in the vertical bar indicating proteins quantified by Spectral Counting (orange) or XIC (black).
acceptor, ACT would also reduce oxidative stress and the unexpected low expression of the SigR regulon in SC might be due to the proposed anti-oxidant function of ACT. This hypothesis led to the prediction that a SC mutant strain deleted for the ACT cluster92 would be more sensitive to diamide stress than the original strain. This
prediction was tested and confirmed (Fig. S8). Interestingly, some reports in the literature mention that oxidative stress is an important trigger of antibiotic production93–95 and that some antibiotics (for example chromomycin),
have anti-oxidant properties96 and thus constitute an adaptive response to oxidative stress.
This study also revealed that some proteins belonging to carbon and iron metabolism had a very different abundance in SL and in its phoP mutant suggesting that they might constitute novel PhoP regulatory targets. It may seem surprising that these targets were not identified in previously studies22,24. The expression of PhoR/PhoP
being low in SC, the difference of expression of some PhoP targets between the original strain and its phoP mutant might have been too small to allow the detection of all PhoP targets. The belonging of these targets to the Pho regulon has to be confirmed by site directed mutagenesis and EMSA but even in absence of such confirmation it is of interest to discuss the possible consequences of the difference of abundance of these proteins on the cellular metabolism of the strains. The reduced abundance of SCO7511 (GAPDH) and SCO4209 (PGM) in SL compared to SC is predicted to create a bottleneck leading to the accumulation of the triose phosphates DHAP and GA3P that can be easily converted into Gly3P, the necessary precursor of membrane phospholipids (PL) and TAG. Such bottleneck would not exist in SC and these triose phosphates will be metabolized through subsequent glycolytic steps. In consequence, upon growth on glucose, SC will not generate sufficient amounts of Gly3P for PL synthesis to support active growth and TAG biosynthesis will be impaired. The restoration of a growth rate comparable to that of SL and of the ability of SC to accumulate TAG in the presence of glycerol supports this hypothesis (Fig. 1A). Furthermore, the high abundance of enzymes catalyzing the two last steps of glycolysis in SL, the eno-lase SCO7638 and the pyruvate kinase SCO2014 would contribute to the generation of acetylCoA that, together with enhanced Gly3P availability mentioned above, would support TAG accumulation in SL. In SC, the lower abundance of these enzymes might lead to lower acetylCoA generation than in SL and thus to a reduced ability to synthesize fatty acids. In addition, the very low abundance of the Acyl Carrier Protein (ACP) SCO2389 that belongs to the FasR operon51 in SC compared to SL is also likely to contribute to the limited fatty acid synthesis
of this strain. Overall, these differences in protein abundance may play a part in the poorly understood accu-mulation of TAG under conditions of limitation of Pi in SL14 as well as in other microorganisms15,97. At last, the
putative bottleneck in the glycolytic flux generated by the low abundance of SCO7638 and SCO2014 in SC might contribute to the accumulation of 3-phosphoglycerate, a direct precursor of the amino acids, serine and glycine/ phenylglycine used for CDA and/or RED biosynthesis.
Conclusion
Our study revealed the nature of the metabolic features underlying the drastically different abilities of SL and SC to produce antibiotics. We believe that these differences are likely to be due, at least in part, to the weaker expression of PhoR/PhoP in SC compared to SL leading to the relief of the indirect negative impact that PhoR/ PhoP exerts on antibiotic production75,98. However, since the causes of the low expression of PhoR/PhoP in SC
remain to be clarified further investigation would be needed to confirm this hypothesis. Little is known on the regulation of PhoR/PhoP expression in Streptomyces besides that PhoP auto-controls positively the expression of the phoR/phoP operon from a promoter located upstream of phoR43 while the PhoU regulator plays a negative
role in the regulation of this operon99. phoP is also expressed from its own promoter located at the end of phoR43
but very little is known concerning the control of phoP expression from this promoter. A unique study indicated that the expression of phoP was negatively regulated by large ATP binding regulators of the LuxR family (LAL), SC07173 and SCO0877, to a lesser extent100. We propose that the LAL regulators that sense ATP repress PhoP
expression when the intracellular ATP concentration is high (high Pi availability) and this repression would be relieved when ATP concentration falls below a certain threshold (low Pi availability). Since the ATP content of SC is high in Pi limitation as in proficiency14, the LAL and ATP dependent repression of phoP expression would be
maintained in this strain even in Pi limitation. Considering the low expression of most glycolytic genes tested in SC it is tempting to speculate that the regulation of glycolysis is altered in this strain and promotes the use of the TCA that generates abundant ATP. This high ATP content would be responsible for the low expression of PhoR/ PhoP that itself would re-inforce the oxidative metabolism of this strain.
Materials and Methods
Most of the procedures described below were set up and used in the doctoral work of Millan-Oropeza101.
Bacterial growth.
Spores of S. coelicolor M145, a derivative of the wild-type strain A3(2) lacking the plas-mids SCP1 and SCP29 and S. lividans TK2411 were prepared from solid SFM medium (https://actinobase.org/index.php?title=SFM). Streptomyces strains were grown on solid R2YE medium (https://actinobase.org/index.
php?title=R2YE) devoided of sucrose, limited in phosphate (1 mM, no K2HPO4 added) and supplemented with
glucose 50 mM or glycerol 100 mM as major carbon sources. 106 spores were plated on the surface of cellophane
disks (Focus Packaging & Design Ltd, Louth, UK) laid down on the top of agar plates and incubated at 28 °C in darkness. Cell growth was assessed by dry cell weight every 12 h until 72 h of culture. To do so, four independent biological replicates of mycelial lawns were collected with a spatula for each strain and for each culture time, washed twice with deionized water, lyophilized and weighted.
Total proteins extraction and digestion.
Proteomic analysis was carried out at three culture times: 36, 48 and 72 h. Four biological replicates were collected for each strain cultivated in the two different media and for the three culture times. The total number of samples was thus 48 (2 strains × 2 media × 3 culture times × 4 biological replicates (Fig. S9). Half of the mycelial lawns obtained from each of the four replicates was collectedwww.nature.com/scientificreports
www.nature.com/scientificreports/
with a spatula, washed twice with 50 mM Tris-HCl pH = 7.8 ice cold buffer and suspended in 3 mL of lysis buffer containing 6 M urea (Sigma Aldrich, U5378), 2 M thiourea (Sigma Aldrich, T8656), 5 mM DTT (Sigma), 0.1 M TRIS-HCl pH = 8 and 150 µL of a proteases inhibitor cocktail (Sigma Aldrich, P8465). Cells were broken using a cell disruptor (Constant systems Ltd. One shot model) at 2.6 Kbars and cells debris were removed by centrifu-gation (15 min at 7100 g, 4 °C). Soluble protein concentrations were measured using the 2-D Quant kit protocol (GE Healthcare Life Sciences, 80-6483-56). Aliquots of 80 µg of total protein extracts were supplemented with RapiGestTM (Waters, 186001860) to obtain a final concentration of 0.1% m/v. Such protein extracts were used for
the proteome analysis.
The total protein extracts (80 µg) were alkylated with iodoacetamide (10 mM final concentration) in the dark for 1 h. Samples were subsequently digested in-solution for 3 h at room temperature with Lysyl-Endopeptidase (Wako, 125-05061) at a 1:100 (w/w) protein ratio. Then, following a 5-fold dilution with deionized water, they were digested with 80 μg of sequencing-grade modified trypsin (Promega) with 1:100 protein ratio at 37 °C overnight102. To quench the digestion, the pH of the peptide mixtures was adjusted to 2 by adding
trifluoro-acetic acid (TFA). The resulting peptide mixtures were pre-cleaned with a Strata-X column (Phenomenex, ref. 8B-S100-TAK). Columns were washed with 1.5 mL of washing buffer (containing 3% acetonitrile (ACN) and 0.06% glacial acetic acid). The peptide mixtures were charged into the columns, followed by three washing steps of 500 µL. Elution of peptides was achieved using 600 µL of elution buffer (40% ACN and 0.06% glacial acetic acid). The resulting samples were concentrated under vacuum to dryness and re-suspended in 320 μl of 0.1% TFA and 2% ACN for analysis in a high-resolution mass spectrometer.
LC-MS/MS analysis.
MS analyses were performed on a Dionex U3000 RSLC coupled to an Orbitrap Fusion™
Lumos™
Tribrid™
mass spectrometer (Thermo Fisher Scientific). Four μl (at 0.25 µg peptides/ml) con-taining 1 μg of peptides were injected and separated using a 75-μm × 500-mm Acclaim PepMap RSLC column packed with 3-μm diameter superficially porous particles (Thermo Scientific). The gradient used was 0–45% of 80% ACN/0.1% formic acid over 180 min at a flow rate of 300 nl/min. LC-MS/MS analysis was performed uti-lizing a nanospray ionization source and the eluted peptides were ionized by applying 2.4 kV in positive mode. MS scans were performed at 120,000 resolution, m/z range 400‒1,500. MS/MS analysis was performed in a data-dependent mode, with a top speed cycle of 3 s for the most intense double or multiple charged precursor ions. Ions in each MS scan over threshold 10,000 were selected for fragmentation (MS2) by collision-induced dissociation (CID) for identification at 35% and detection in the ion trap followed by a top speed MS2 fragment ions. Precursors were isolated in the quadrupole with a 0.7 m/z window and dynamic exclusion within 10 ppm during 25 s was used for m/z-values already selected for fragmentation. The AGC targets are 4 × 10 5 and 1 × 10 4 and maximum ion filling times of 50 ms and 50 ms for MS and MS/MS respectively. Polysilaxolane ions m/z445.12002, 519.13882 and 593.15761 were used for internal calibration.
Proteins identification.
A custom FASTA format database was constructed from the genomes of S. coel-icolor M145 and S. lividans TK24 downloaded from The Universal Protein Resource (http://www.uniprot.org/, June 22th 2011, 7810 and 7551 entries respectively). Unique labels were attributed to proteins encoded by ort-hologous genes that fulfilled an E-value <10E-10 as a top score after BLASTP103 for both strains. This resulted in6911 orthologous protein pairs, and 1539 strain-specific proteins (899 specific proteins for S. coelicolor and 640 specific proteins for S. lividans). The sub-cellular localization of each protein was predicted from the LocateP database104. The functional categories were assigned as described in Kegg105, BioCyc106 and STREP DB databases
(https://www.sanger.ac.uk/resources/downloads/bacteria/streptomyces-coelicolor.html). A database of common
contaminants was also used for the analysis. Database searches were performed using the X!Tandem algorithm (version 2015.12.15; http://www.thegpm.org/TANDEM/, December 15th 2015) implemented in the open source search engine X!TandemPipeline version 3.4.2107. Enzymatic cleavage was declared as a trypsin digestion with
one possible miss cleavage. Carboxyamidomethylation of cysteine residues and oxidation of methionine residues were set to static and possible modifications, respectively. Precursor and fragment mass tolerance was 10 ppm. Identified proteins were filtered and grouped using X!TandemPipeline. Data filtering was achieved according to a peptide E-value <0.05, protein log (E-value) < –2 and to a minimum of two identified peptides per protein. Using such filtering criteria, the peptides and proteins false discovery rates (FDR) were estimated to 0.13% and 0.66% respectively (File S1). MS data were deposited online on the public database PROTICdb108,109 in the
follow-ing URL: http://moulon.inra.fr/protic/strepto_gly_glu.
Peptide quantification based on extracted ion current.
Peptides were quantified based on XIC using MassChroQ 2.1.4110. XIC extraction was performed using a peak detection threshold between 30,000–50,000range of 10 ppm (File S3). The peptide intensities thus obtained were log10-transformed for further data analyses. Peptides showing a standard deviation of retention time higher than 20 s were removed.
Normalization was performed in order to remove systemic biases between samples as well as more complex variation resulting from transient stochastic events during LC-MS/MS run, such as ESI instability. For this, we used a local normalization method adapted from Lyutvinskiy, et al.111. Briefly, intensity deviation between a given
sample and a sample chosen as reference was computed for each peptide-charge quantified in both samples. The values of intensity deviation thus obtained were ordered according to the peptides’ retention time and smoothed using the smooth.spline function in R112. The smoothed values of intensity deviation were used as correction
factors to normalize the samples. The intensities of the peptides-charges that were present in the sample to be normalized and absent from the reference sample were corrected considering that intensity deviation was similar for temporally neighboring peptides (Fig. S10). Peptides that belonged to multiple proteins were removed. To be considered in reproducibility tests the peptides have been quantified: (1) in at least 2 replicates per strain × media × culture time combination, and (2) in 12 of the 12 possible strain × media × culture time combinations.
In order to remove peptides whose intensity profiles deviated from the average profile of the peptides from the same protein, Pearson-correlation coefficients were computed for each pair of peptides belonging to a same pro-tein. For each protein, a reference peptide was chosen as the peptide showing the highest number of significant correlations. Peptides correlated to the reference peptide with a coefficient of correlation >0.75 were kept for further analysis.
Detection of protein abundance changes.
To detect protein abundance changes, two protein quanti-fication methods were used. As recommended by Blein-Nicolas and Zivy113, we first performed a rough proteinquantification using Spectral Counting in order to detect semi-quantitative and presence/absence variations, then we performed a finer quantification using a XIC-based approach in order to detect smaller abundance changes.
For Spectral Counting, proteins were filtered by selecting those showing a minimal difference of 10 spectra when comparing the average of spectra for the different strain × medium × culture time combinations. For each protein, the abundance in number of spectra was modeled using the following generalized linear mixed model (GLM) with a Poisson distribution:
ε
= +µ + + + + + + + +
SCjklm Sj Mk Tl (SxM)jk (SxT)jl (MxT)kl (SxMxT)jkl Rm jklm
( )
σθ where jklmN 0, 2SCjklm is the number of spectra measured in strain j, growth medium k, culture time l and replicate m. Sj represents
the effect due to strain j. Mk represents the effect due to medium k. Tl represents the effect due to culture time l.
(SxM)jk represents the effect due to strain j × growth medium k interaction. (SxT)jl represents the effect due to
strain j × culture time l interaction. (MxT)kl represents the effect due to growth medium k × culture time l
inter-action. (SxMxT)jkl represents the effect due to strain j × growth medium k × culture time l interaction. Rm
repre-sents the effect due to biological replicate m. εjklm is the residual error. Protein abundance changes were detected
by analysis of variance (ANOVA) using a Chi-square test.
For the XIC-based approach, the effects of the strain, growth medium and of the culture time were tested for each protein by modeling the normalized peptide intensities using a mixed-effects model derived from Blein-Nicolas and Zivy113.
θ ε θ σ = μ + + + + + + + + + +
( )
θ I S M T SxM SxT MxT SxMxT R where N ( ) ( ) ( ) ( ) 0, jklm j k l jk jl kl jkl m jklm jklm jklm 2 jklmN 0,( )
σθ2Ijklm is the peptide intensity measured in strain j, growth medium k, culture time l and replicate m. Sj represents
the effect due to strain j. Mk represents the effect due to medium k. Tl represents the effect due to culture time
l. (SxM)jk represents the effect due to strain j × growth medium k interaction. (SxT)jl represents the effect due
to strain j × culture time l interaction. (MxT)kl represents the effect due to growth medium k × culture time l
interaction. (SxMxT)jkl represents the effect due to strain j × growth medium k × culture time l interaction. Rm
represents the effect due to biological replicate l. θjklm represents the technical variation due to sample handling
and injection in the mass spectrometer. εjklm is the residual error. Parameters were estimated by maximizing the
restricted log-likelihood (REML method). Protein abundance changes were detected by ANOVA.
For both methods (XIC and Spectral Counts), the obtained p values were adjusted for multiple testing by the Benjamini-Hochberg approach114. The abundance of a given protein was considered significantly variable when
the adjusted p value was <0.05.
Data analysis.
Descriptive analysis of the protein abundances was performed using Principal Component Analysis (PCA) and heatmap representations. Heatmaps were constructed using hierarchical clustering based on Euclidean distances. For proteins that were quantified with both methods (XIC and Spectral Counts), only the values obtained by XIC-based approach were used in the heatmap constructions since the latter is a finer quan-titative approach compared to the Spectral Counts-based method. Among the dataset, 5 samples of SL, 2 grown on glucose (one harvested at 48 h and one at 72 h) and 3 grown on glycerol (harvested at 36, 48 and 72 h), as well as one sample of SC grown on glucose at 48 h were excluded from the analysis because they showed inconsistent LC-MS/MS results. This decision was motivated by the significantly lower number of peptides identifies in the six samples compared to most of the other samples (mainly < 40,000 peptides, Fig. S1A) as well as PCA results (Fig. S1B-E). The PCA performed, based on protein abundance estimated from peptide intensities (Fig. S1B), and spectral counts (Fig. S1C), showed that these six samples were separated from the other groups. The fact that the independent replicates of the 42 remaining samples were grouped together (Fig. S1D-E) suggested that an exper-imental problem had affected the protein content of the excluded samples. Temporal proteomic profiles were constructed using the relative protein abundances obtained from XIC and Spectral Counts approaches of those proteins showing significant abundance variation, these values were scaled using self-organizing tree algorithm (SOTA) clustering. Proteins quantification, statistical methods and data analysis were conducted in R 3.3.2112,using the following packages: ade4, clValid, ggplot2, lattice, lme4, made4, nlme and reshape2115.