HAL Id: tel-02518925
https://tel.archives-ouvertes.fr/tel-02518925
Submitted on 25 Mar 2020
HAL is a multi-disciplinary open access
archive for the deposit and dissemination of sci-entific research documents, whether they are pub-lished or not. The documents may come from teaching and research institutions in France or abroad, or from public or private research centers.
L’archive ouverte pluridisciplinaire HAL, est destinée au dépôt et à la diffusion de documents scientifiques de niveau recherche, publiés ou non, émanant des établissements d’enseignement et de recherche français ou étrangers, des laboratoires publics ou privés.
Essays in Generational, Labor and Development
Economics
Dalal Moosa
To cite this version:
Dalal Moosa. Essays in Generational, Labor and Development Economics. Economics and Finance. Université Panthéon-Sorbonne - Paris I; Université catholique de Louvain (1970-..), 2019. English. �NNT : 2019PA01E037�. �tel-02518925�
Universit´e Paris 1 Panth´eon-Sorbonne Universit´e catholique de Louvain ´
Ecole doctorale ´Economie Panth´eon Sorbonne Economics School of Louvain
URF02 ECGE3DP
Paris-Jourdan Sciences ´Economiques Institut de Recherches ´Economiques et Sociales
(PjSE) (IRES)
Thesis to obtain a Ph.D. in Economics
Docteur en sciences ´economiques (Paris 1)
Docteur en sciences ´economiques et de gestion (UCLouvain)
Publicly presented and defended on the 3rd of October, 2019
Dalal Moosa
Essays in Generational, Labor and Development Economics
Under the direction of:
Hippolyte d’Albis (Professor, Paris School of Economics - CNRS)
Bruno Van der Linden (Professor, Universit´e catholique de Louvain - FNRS) Members of the jury:
Muriel Dejemeppe (Professor, Universit´e catholique de Louvain) Najat El Mekkaoui (Associate professor, Universit´e Paris-Dauphine) David N. Margolis (Professor, Paris School of Economics - CNRS)
Henri Sneessens (Professor emiretus, Universit´e catholique de Louvain and Universit´e de Luxembourg)
To Hisham, my anchor in rough waves, my bliss.
Acknowledgments
This thesis has been in my care and despair for longer than I would like to admit. Luckily, however, I have not been the only dedicated guardian. In fact, I would not have been able to move an inch forward without the input, guidance and generous time provided to me by my two thesis advisors, Dr. Hippolyte d’Albis and Dr. Bruno Van der Linden, and my jury member Dr. David Margolis.
Even beyond this immense generosity, the persistent follow-up and vested interest in my progress from the very beginning by the EDEEM committee has continuously given me perspective on the work that I do. Throughout this time and in particular towards the later stages of the thesis, it was the feedback and advice that I have received from my jury members, Dr. Henri Sneessens, Dr. Muriel Dejemeppe and Dr. Najat El Mekkaoui that helped push me towards the finish line.
Still, I cannot imagine having completed two of the three chapters of this thesis without my brilliant Ph.D. colleagues and co-authors, Nhung Luu and Alexandre Ounnas. They have not only enriched my technical knowledge but also shown me how to be relentless in the face of intellectual and emotional adversity.
To have endured this endeavor and dared to enjoy it, I cannot thank my friends enough. The Ph.D. journey is, to a large extent, an emotional journey, a wobbly roller coaster that friends can help steady. For this, I am eternally grateful to my friends Dr. Sulin Sardoschau and future-Dr. Pauline Mourot, whose company and heart-felt conversations in cafes and beautiful Parisian apartments had soothed my soul and sparked my intrigue.
I am immensely grateful to the UC Louvain community, and especially those at IRES, including but not exclusively Riccardo Turati, Annalisa Frigo, Elisa Rizzo, and so many others for whom I am forever grateful. I have spent two wonderful years working, learning and engaging with kind, intelligent and compassionate young economists and friends.
But this journey through the doctoral research began before the Ph.D. program itself, during those first two years of doing a Master’s degree at the University of Paris 1 – Panth´eon-Sorbonne, studying with Grese Rexhipi in the 5`eme arrondissement and sharing our first French experiences together.
Even though much of this journey has been far away from my home and out of their sight, my family and friends in Bahrain have shared with me so much of this adventure and struggle. My parents, Hassan and Mariam, were and always will be the base on which I have built my life. So much of who I am comes from them: the values, the happiness, the vulnerabilities and the strengths. During the last and most difficult year of this Ph.D., their guiding words and unconditional love steadied my pace. It was also the love, friendship and jokes of my brothers, Yasser and Kamal, that have pulled me out of my bubble so many times. I could not have been more proud of the men they have become, and in so many ways I aspire to be more like them. While I do not have sisters within my nucleus family, my eternal girlfriends, Layla Haidar, Zainab Assiri, Seddiqa Shaker and Noora Al-Musallam, have enriched my life with a type of sisterhood that has refined the way I think and love, and has always made me feel safe and confident.
Finally, and I save the best for last, I would not have endured this journey or reached the end of it without the unrelenting support of my husband, Hisham Shehab, whose faith in me had never waned, and whose partnership brought me courage and relief more times than I can count. It is this partnership that makes this thesis taste so sweet. Throughout the years that we have been together, I have learned so much from him: his wit, his work ethic and his creativity have inspired me and pushed me to work harder and longer – many times while fighting over the only desk that our apartments had. Whatever claim I have to this thesis is also his.
Contents
General introduction and summary 1
1 Intrahousehold transfers, inheritance and implications on inequality 7
1.1 Introduction . . . 8
1.2 Motivating facts: Evidence from the National Transfer Accounts . . . 11
1.3 The model . . . 17
1.3.1 Model set-up . . . 17
1.3.2 Equilibrium in the economy . . . 20
1.3.3 Transitional dynamics and steady state . . . 22
1.3.4 The intrahousehold transfers-inheritance ratio and wealth inequality . 29 1.4 Comparative statics . . . 33
1.5 Discussion . . . 36
1.6 Concluding remarks. . . 38
1.7 Appendix . . . 40
2 The demographic boom and the rise of informal employment: The case for Egypt 51 2.1 Introduction . . . 52
2.2 The institutional context and motivating facts . . . 56
2.3 The model . . . 68
2.3.1 A simple static framework under pure competition. . . 68
2.3.2 General set-up. . . 71
2.3.3 Timing of events . . . 74
2.3.4 Demographics, effort and matching . . . 75
2.3.5 Workers’ value functions . . . 77
2.3.6 Production . . . 78 2.3.7 Equilibrium conditions . . . 83 2.4 Numerical Analysis . . . 84 2.4.1 Calibration . . . 85 2.4.2 Simulations . . . 100 2.5 Concluding remarks. . . 120 2.6 Appendix . . . 122
3 Exploring heterogeneity of micro and small enterprises in Morocco 141 3.1 Introduction . . . 142
3.2 Data and descriptives . . . 146
3.2.1 The MSE Survey . . . 146
3.2.2 Descriptive statistics . . . 149
3.3 Empirical strategy . . . 152
3.3.1 Defining top performers . . . 152
3.3.3 Exploiting the formality and informality of firms . . . 158
3.4 Results . . . 160
3.4.1 Identification of groups . . . 161
3.4.2 Characteristic differences between the groups. . . 169
3.4.3 Formal and informal firms . . . 179
3.4.4 Choice of formality/informality . . . 191
3.5 Robustness check: Expanding top performance identification . . . 197
3.6 Discussion . . . 210 3.7 Concluding remarks. . . 211 3.8 Appendix . . . 214 Bibliography 274 A short summary 275 Un r´esum´e 277 Un r´esum´e ´elabor´e 279
List of Figures
1.1 Received private transfers by type as a percentage of GNI. . . 13
1.2 Ratio of intrahousehold transfers to inheritance . . . 14
1.3 Net intrahousehold transfers by broad age-group (billion real euros) . . . 15
1.4 Received inheritance by broad age-group (billion real euros) . . . 16
1.5 Gini coefficient of wealth in France . . . 16
1.6 Inequality conditional on choices of γ and λ . . . 25
1.7 Dynamics of wealth inequality, xt . . . 28
1.8 Intrahousehold transfers-to-inheritance ratio in the model and in the data . . 33
1.9 Case 1: x∗ > 1. Response function of wealth indicator x t to a gain in γ (left) and to a gain in λ (right) . . . 34
1.10 Case 2: x∗ < 1. Response function of wealth indicator x t to a gain in γ (left) and to a gain in λ (right) . . . 34
1.11 Change in the inequality regime: λ is shifted from 0.9 to 0.99 for 1 period. . 36
1.12 Received intrahousehold transfers and inheritance per capita of typical recip-ient (in real euros) . . . 40
1.13 Aggregate and per capita private consumption by type for 0-19 year-olds (in real euros) . . . 40
1.15 Age profile of received inheritance for selected years (in real euros) . . . 41
1.16 Received inheritance per age-group capita (in real euros) . . . 42
2.1 Share of the cohort in overall population at various age-groups . . . 57
2.2 Data vs model predictions of low- and high-skilled populations in 2006: New entrants only in age group 0 . . . 92
2.3 Data vs model predictions of low- and high-skilled populations: New entrants in age group 0 and older . . . 94
2.4 Model vs data non-formality rates (%) . . . 98
2.5 Model vs data formal wages . . . 99
2.6 Model vs data non-formal wages . . . 99
2.7 New entrants by skill level (relative to the 1998 population) . . . 102
2.8 Selected age groups of high-skilled workers (as a share of the total high-skilled population at the time) . . . 103
2.9 Evolution of selected age groups of low-skilled workers (as a share of the total low-skilled population at the time) . . . 103
2.10 Aggregate non-formality (as a share of the total skill-specific population at the time). . . 104
2.11 Aggregate and age-specific non-formality rate for high- (a) and low-skilled (b) respectively (as a share of the total skill-specific population) . . . 104
2.12 Labor market tightness, job finding and vacancy-filling rates for high- and low-skilled respectively . . . 106
2.13 Aggregate productivity for high-skilled (a) and low-skilled (b) in private for-mal firms (in Egyptian pounds) . . . 106
2.14 Formal (a) and informal (b) wages for selected age groups (in thousands of Egyptian pounds) . . . 107
2.15 Discounted lifetime value of a vacant position by level of skill . . . 107
2.16 Stock of vacancies and the inflow of new vacancies - investments (as a share of 1998 population) . . . 108
2.17 Intermediate goods’ prices relative to that of the final good (taken as the numeraire) . . . 108
2.18 Evolution of new entrants by skill level (relative to the 1998 population): counterfactual without the demographic boom . . . 109
2.19 Evolution of aggregate non-formality rates (low-skilled on the right vertical axis): counterfactual without the demographic boom . . . 110
2.20 Age groups composition in the counterfactual and baseline scenario for high-skilled (a) and low-high-skilled (b): counterfactual without the demographic boom 110
2.21 Labor market tightness, job finding and vacancy-filling rates for high-skilled (a) and low-skilled (b): counterfactual without the demographic boom. . . . 111
2.22 Intermediate goods’ prices for the formal sector relative to that of the final good (taken as the numeraire): counterfactual without the demographic boom 111
2.23 New entrants (relative to the 1998 population): counterfactural of same skill composition . . . 112
2.24 Aggregate non-formality rates: counterfactual of same skill composition . . . 113
2.25 Labor market tightness, job finding and vacancy-filling rates for high-skilled (a) and low-skilled (b): counterfactual of same skill composition . . . 114
2.26 Intermediate goods’ prices relative to that of the final good (taken as the numeraire): counterfactual of same skill composition . . . 114
2.27 Aggregate non-formality rates: counterfactual of easing fixed cost constraints 116
2.28 Labor market tightness, job finding and vacancy-filling rates for high-skilled (a) and low-skilled (b): counterfactual of easing fixed cost constraints . . . . 117
2.29 Intermediate goods’ prices relative to that of the final good (which is taken as the numeraire): counterfactual of easing fixed cost constraints . . . 117
2.30 Number of entrepreneurs . . . 118
2.31 Aggregate non-formality rates: counterfactual of increasing entrepreneurs . . 118
2.32 Labor market tightness, job finding and vacancy-filling rates for high-skilled (a) and low-skilled (b): counterfactual of increasing entrepreneurs . . . 119
2.33 Stock of vacancies (as a share of the 1998 population): counterfactual of increasing entrepreneurs . . . 119
2.34 Intermediate goods’ prices relative to that of the final good (which is taken as the numeraire): counterfactual of increasing entrepreneurs . . . 119
2.35 Total population . . . 122
2.36 Total fertility rate (births per woman) . . . 122
2.37 Share of low-skilled workers in various states in 2006 . . . 130
2.38 Share of high-skilled workers in various states in 2006 . . . 131
2.39 New entrants over the period 1966-2014 for low- and high-skilled (hare of 1998 population*) . . . 134
2.40 Smoothed median wages in 1998 for low-skilled workers in the government, private formal and informal sectors (monthly, real Egyptian pounds) . . . 139
2.41 Smoothed median wages in 1998 for high-skilled workers in the government, private formal and informal sectors (monthly, real Egyptian pounds) . . . 140
3.1 Predicted probability of being a top performer by firm category . . . 166
3.2 Distribution of value-added by firm category . . . 166
3.3 Distribution of the value of assets by firm category . . . 167
List of Tables
1.1 Calibrated parameter values . . . 33
2.1 Number of working-age population by sex, education groups and selected age groups (million persons) . . . 59
2.2 Proportion of waged-workers by sector, age-group and educational level (men; in percent) . . . 62
2.3 Proportion of informal employment by cohort and education level (men; in percent) . . . 63
2.4 Real net wages of men in working-age in Egyptian pounds (2012 prices) . . . 64
2.5 Proportion of male workers (15-64 years old) transitioning between labor mar-ket states, by survey round (in percent) . . . 67
2.6 Calibration age-groups . . . 84
2.7 Calibrated parameters and job finding rates by age-group and skill level . . . 90
2.8 Calibrated parameters for the demographic boom by age-group and skill level 93
2.9 Calibrated parameters . . . 100
2.10 Social security contributions in Egypt . . . 124
2.11 Household numbers by survey round . . . 125
2.13 Cross-sectional participation rates for men (15-64 years old) . . . 128
2.14 Calibrated steady-state values . . . 134
2.15 Parameter values used for the final calibration . . . 135
3.1 Descriptive statistics of the entrepreneur . . . 150
3.2 Descriptive statistics of the enterprise . . . 151
3.3 Probability of being a top performer (Benchmark double-criteria) . . . 163
3.4 Distribution of firms . . . 166
3.5 Difference in characteristics between groups . . . 174
3.6 Formality within the groups of MSEs . . . 181
3.7 Distribution of formal and informal firms . . . 182
3.8 Difference in characteristics between groups of formal and informal firms . . 185
3.9 Firm categories and share of informality, by formal/informal equation . . . . 192
3.10 Difference in characteristics between formal and informal potential gazelles . 194 3.11 Distribution of firms . . . 198
3.12 Difference in characteristics between groups (robustness check) . . . 199
3.13 Difference in characteristics between groups of formal and informal firms (ro-bustness check) . . . 204
3.14 Population in Morocco by census year (in persons). . . 214
3.15 Illustrative example of identifying potential gazelles and “others” . . . 217
3.16 Proportions by types of registration and keeping records . . . 219
3.17 Probability of being a top performer (Definition: top 10% of value-added per worker) . . . 220
3.18 Distribution of firms (Definition: top 10% of value-added per worker) . . . . 221
3.19 Probability of being a top performer (Definition: number of workers) . . . . 222
3.20 Distribution of firms (Definition: Number of workers) . . . 223
3.21 Probability of being a top performer (Definition: inverse double-criteria) . . 224
3.22 Distribution of firms (Definition: Inverse criteria) . . . 225
3.23 Motivation for starting a business by the previous status with respect to the labor market. . . 225
3.24 Sector regressions (compared to Manufacturing) in the conditional mixed process226 3.25 Probability of being a top performer (simple probit model) . . . 227
3.26 Difference in characteristics between groups (top performer as 10% of value-added per worker). . . 228
3.27 Difference in characteristics between groups (top perform as 3 workers or more)232 3.28 Difference in characteristics between groups (top performer as the inverse of the benchmark criteria). . . 235
3.29 Results of conditional mixed process for formal and informal firms . . . 239
3.30 Probability of being a top performer (robustness check) . . . 247
3.31 Sector regressions, compared to Manufacturing (robustness check) . . . 249
3.32 Results of conditional mixed process for formal and informal firms (robustness check) . . . 250
3.33 Difference in characteristics between formal and informal potential gazelles (robustness check) . . . 257
General introduction and summary
This doctoral thesis explores topics in three varying areas. Each topic stems from an interest that was cultivated by growing up in my home country, Bahrain, living and learning in Europe and the U.S. and witnessing the Arab Spring throughout. In many ways, the research questions tackled in this thesis are personal, enriched by the intellect and dedication of my colleagues. As my own knowledge and understanding of economics evolved throughout the years, so have these chapters.
The diversity of this thesis, however, is not only in the topics examined, but also in the methods used to answer their research questions. Whereas the first chapter uses a purely theoretical approach with analytic solutions, and the second calibrates and simulates a the-oretical model, the third and final chapter relies only on empirics. While this was not a deliberate decision, this diversity has greatly increased my own understanding of economics, and hopefully enhanced the quality of the research in the process.
Chapter 1, titled “Intrahousehold transfers, inheritance and implications on inequality,” explains a change in the composition of private intergenerational transfers over time. Ev-idence from the National Transfer Accounts (NTA) of France during the period 1979-2011 shows that while these transfers have remained relatively stable as a share of Gross National Product, their composition has changed: from more intrahousehold transfers in the 1980s to more inheritance in the new millennium. This has consequently decreased the intrahousehold transfers-to-inheritance ratio over time.
My co-author, Nhung Luu, and I explain this trend utilizing a three-period overlapping generations (OLG) model, where individuals go through childhood, working-age and old age. Individuals can fall under one of two dynasties that capture an important heterogeneity in the model: an “altruistic” dynasty that prefers to bequeath and consequently saves and transmits inheritance to those in working-age, and an “egoistic” one that does not. Those that bequeath do so out of a “joy of giving” motive. However, both dynasties, transmit
intrahousehold transfers, flowing from working-age to childhood, which in turn increases the human capital accumulation of the child and impacts future labor income. However, the human capital of the individual is not only a function of the intrahousehold transfers that he/she receives, but also the economy-wide human capital, which includes that of the other dynasty. This allows for a link between the two dynasties and emphasizes the fact that these two private intergenerational transfers have different roles to play.
The evolution of the economy can be expressed as a function of wealth inequality, which we define as the ratio of the altruistic dynasty’s physical capital to that of the egoistic one. Wealth inequality, therefore, can be understood as one of two cases: (1) the altruistic dynasty holds more capital than the egoistic one, meaning inequality is greater than 1, or (2) the egoistic dynasty holds more capital than the altruistic one, meaning inequality is less than 1.
Solving this framework analytically allows us to make several propositions. Firstly, there is a unique steady-state value of inequality in the long-run such that capital saved by both dynasties is positive. However, whether this long-run inequality is greater than or less than one depends on the parameters of the model, and in particular the preference to bequeath and the share of intrahousehold transfers in the accumulation of human capital.
Secondly, there exists a threshold of bequest preference and of the share of intrahousehold transfers in human capital accumulation such that the long-run inequality is greater than 1, meaning that the altruistic dynasty holds more physical capital than the egoistic one. Otherwise, the opposite is true.
In the short-run, the decrease in the intrahousehold transfers-to-inheritance ratio that we see in the data can be attributed to a rise in wealth inequality between the two dynasties. Wealth inequality in France during the same time has in fact been rising, and the data shows that people that bequeath tend to have more capital than those that do not.
This chapter, therefore, argues that one potential explanation of the change in the com-position of private intergenerational transfers in France is a process of increasing wealth inequality that is currently lower than that of the steady-state, given certain parameter values. However, we also argue that this is influenced by both the preference to bequeath and the role of intrahousehold transfers in human capital accumulation, and that a regime change of inequality is possible depending on these parameters.
examines the role that the demographic boom can play in the prevalence of informal em-ployment, with the context of Egypt in mind. In the past couple of decades, Egypt has seen a rise in informal employment, defined as lacking social security, that was particularly higher for the young, and did not spare the better-educated. This demographic boom also came with a change in the skill composition of the workforce towards higher education.
Co-authored with Alexandre Ounnas and Bruno Van der Linden, we introduce a multi-sectoral model that consists of three distinct sectors: (1) an exogenous government sector that is preferred by all workers, in line with the literature on Egypt, (2) a private formal sector that incurs search-and-matching frictions, in addition to sluggish vacancy creation and taxes and, (3) a perfectly competitive informal sector that can absorb all those that want to work but are not employed by either of the first two sectors. The private formal and informal sectors together produce an aggregate consumption good and are consequently linked to each other.
Workers in the model belong to overlapping generations, and are either high- or low-skilled, determined exogenously. Each age has a certain survival probability, and all workers exit the market at a later stage. Workers can be in one of three states: (1) being employed in the government sector, (2) being employed in the private formal sector or, (3) being non-formal, which is a state that combines both informal work and home production.
We show that a temporary demographic boom of better-educated workers, like the one that Egypt has witnessed throughout the years, can have long-run effects on non-formality rates. These non-formality rates interact with output and prices.
The numerical analysis shows four main channels through which this size and compositional change operate. The first channel is a pure compositional effect, which shifts the population shares towards younger workers for which the prevalence of non-formality is higher. As these demographic boom generations exit the market, this channel disappears. The second channel comes as a congestion effect that originates from the search-and-matching assumption of the private formal sector. Large inflows of high-skilled workers decrease labor market tightness and the job finding probability. This can have long-lasting effects that do not necessarily go back to pre-boom levels. The third channel relates to production, where more high-skilled workers raise their output in the production function, and consequently lower the prices of their high-skilled intermediate goods, which in turn lowers the private formal wage and reduces incentives to join the private formal sector. The fourth and final channel is the adjustment of vacancy creation, which is influenced by the fixed cost that entrepreneurs
incur to open a vacancy.
Moreover, the results show that non-formality rates peak as the demographic boom gener-ation gets older. This may indicate a potential “scarring effect,” where young workers that experience higher non-formality rates at entry suffer from long-term negative effects related to this initial state.
We contrast this dynamic adjustment with several scenarios. We show that in the absence of the demographic boom, the economy-wide non-formality rate would have been slightly higher, but the non-formality rate of the high-skilled would have been markedly lower. In contrast, the non-formality rate of low-skilled workers would have been higher.
Simulating a demographic boom without a change in the skill composition would, on the other hand, have increased the economy-wide non-formality rate significantly, driven largely by the higher non-formality rate of the low-skilled. The change in the skill composition in favor of the high-skilled, therefore, was arguably an important element in reducing the average rate of non-formality in Egypt over the years, given the fact that the high-skilled face lower non-formality rates in general.
Finally, when we allow for more vacancy creation in the economy, the results show that the economy-wide non-formality rates would have been significantly lower, and in particular for the high-skilled.
This chapter shows, therefore, that a demographic boom and a change in the skill composition of the workforce due to better educated new entrants can have long-lasting effects on the labor market, and in particular on the non-formality rate. It also shows how these effects come into play and how easing vacancy creation could have had a significant impact in the reduction of non-formality.
Finally, Chapter 3 is titled “Exploring heterogeneity of micro and small enterprises in Mo-rocco,” and is single-authored. It examines the diversity of micro and small enterpries (MSEs), which constitute a significant share of firms in the country and employ the vast majority of the labor force.
To characterize this heterogeneity, I utilize and expand upon the empirical method pro-posed in similar literature. MSEs in Morocco are grouped intro three categories: (1) “top performers,” which excel in a chosen criteria, (2) “potential gazelles,” which have similar entrepreneur and enterprise characteristics to the first group but are not performing as well,
and (3) “others,” which differ in most, if not all, aspects and look more like survival-oriented firms. To group these firms, I use a relatively unique survey that includes more than 5,000 micro and small enterprises in the country, conducted in 2004.
To identify top performers, I choose a benchmark double-criteria of firms that have the highest number of workers and the highest value-added per worker, making up about 13% of the firms in the sample. I run a probit model on top performance using a number of predetermined and arguably exogenous regressors. However, recognizing that the sector of economic activity, which is one of the regressors, is potentially endogenous, I also regress sector choice on a number of variables and allow for the error term of this specification to be correlated with that of the top performance probit. This allows for the idea that there may be some unobservables that affect the probability of firms in one sector to be top performers, more than firms in other sectors. These steps can be captured through a conditional mixed process.
From the predicted probabilities of this empirical strategy, I identify the group of potential gazelles as one that has the same average predicted probability of being a top performer as the group of top performers. On the other hand, the group of “others” makes up the rest of the observations. This process means that, on average, the group of potential gazelles have similar predetermined characteristics (the regressors) to the group of top performers. I then descriptively compare the three groups of firms based on various aspects: what relates to the entrepreneur, the enterprise, access to credit, management practices, network, and finally access to infrastructure.
The results show that the group of top performers tend to do favorably on almost all as-pects, when compared to potential gazelles and to “others.” Their entrepreneurs are better educated. Their enterprises are older, hire more workers, pay their workers wages that are on average higher and have in general better financial outcomes. A higher share of these top performers, compared to the other two groups, have access to credit, especially from formal institutions. They tend to keep records of their business activities. They tend to provide their workers with written contracts, paid vacations and training. Moreover, a higher share of them report being part of business associations, firm clusters and have links with other businesses. They also appear not to struggle when it comes to access to infrastructure. Potential gazelles, which make up about a fifth of the firms, while similar in a number of entrepreneur and enterprise characteristics to top performers, appear to choose their sectors differently, and appear to be constrained along the lines of access to credit (and the type of
credit), as well as linking with other businesses (what is deemed as “network”).
Moreover, they tend to pay their workers less wages on average, not only when compared to top performers but also to “others,” which may indicate a propensity to retain earnings for business growth. They also appear to struggle in the other two areas that relate to management and access to infrastructure. However, despite these constraints, they still perform better than the group of “others” in almost all areas. These results are largely similar when the definition of top performance is changed using other criteria.
Going beyond the overall sample, I then exploit the existence of formal and informal firms in the survey. Defining formal firms as those that have a tax identification number, I run four regressions simultaneously that are inspired by the empirical strategy mentioned before. The first regression replicates the specification of top performance but this time restricted only to formal firms; the second regression replicates it for informal firms only; the third regression accounts for sector selection as mentioned above, while the fourth accounts for the choice to be formal or informal (i.e. the switching model). I group the firms based on their formality/informality status into top performers, potential gazelles and “others,” as previously mentioned.
The results show that while sector selection was important when looking at the overall sam-ple, it is insignificant when segregating the sample by formality/informality. This indicates that sector choice affects top performance because formal and informal firms choose their sectors differently.
While the characteristic differences between formal categories of firms are largely similar to what is seen in the overall sample, heterogeneity is much less apparent among informal firms. It is as if there is a small number of informal firms, an upper echelon, that appear to be able to compete with formal firms, but the rest of these informal firms are very different and more disadvantaged.
These results highlight some key policy implications. Firstly, not all top performing firms are necessarily formal, but sector choice differs between formal and informal firms. Secondly, potential gazelles, if properly identified, can especially benefit from better access to credit and to networks, but also to infrastructure and to better management practices. Thirdly, there is a significant share of MSEs in Morocco that could benefit from social protection programs as opposed to business development, especially those that are informal, since they appear significantly disadvantaged.
Chapter 1
Intrahousehold transfers, inheritance
and implications on inequality
Nhung Luu and Dalal Moosa
Abstract
Evidence from the National Transfer Accounts (NTA) during the period 1979-2011 shows a notable change in the composition of private transfers between generations in France, from more intrahousehold transfers to more inheritance. We explain the change in this composition through an overlapping generations model where two dynasties have different preferences to bequeath and where these two private transfers occur at different points in time and serve different purposes. In the short-run, the change in the composition can be attributed to a rise in wealth inequality. Using simple numerical illustrations, we show that an increase in either of the two key parameters of the model (the preference to bequeath and the elasticity of intrahousehold transfers in human capital accumulation) can lead to an increase in wealth inequality and consequently a change in the composition of transfers. In the long-run, wealth inequality persists in the economy, but the inequality regime can switch in favor of one dynasty over another depending on these parameters.
1.1
Introduction
Research interest in private transfers between generations over the past few decades has focused largely on two types of financial transfers: (1) bequest, which are post-mortem, and (2) sizeable inter-vivo gifts, often made by living individuals to younger generations at later points in life, such as the transfer of real-estate ownership. Both of these transfers tend to be between households, meaning interhousehold, and are often lumped under the term “inheritance” - a term we also adopt in this paper.
Inheritance has been argued to play an important role in wealth accumulation. It has been estimated to contribute to about 80% of the stock of wealth in the U.S. in the 1970s (Kotlikoff and Summers (1981)),1 and up to two-thirds of private wealth in France by 2010, with a
rising share in other European countries such as Germany, Britain and Sweden post World War II (Piketty and Zucman (2015)).
We argue, however, that despite the importance of inheritance, there is a significant share of private intergenerational transfers that has received much less attention in the literature, which are intrahousehold transfers. These are transfers made within the household, often from older generations, such as parents, to younger ones, especially offspring during their childhood and teenage years. They include expenditure on children’s food, clothing and even for shelter.
New data from the National Transfer Accounts (NTA) highlights the nontrivial size of these intrahousehold transfers in France over time. Moreover, thanks to the long series of inheri-tance data in the country, the NTA database uniquely combines these flows, giving for the first time a comprehensive view of private intergenerational transfers over time, which we exploit in this paper.
The results show an interesting trend. While the sum of these two transfers has remained relatively stable as a share of national income between 1979 and 2011, the composition has changed: from a dominant share of intrahousehold transfers in the 1980s and 1990s to a less dominant one in later years, leading to a decrease in the ratio of intrahousehold transfers to inheritance over time.
A change in fertility rates is unlikely to explain this trend for two reasons. Firstly, while total
1This share was estimated at only 20% byModigliani(1988
) due to the different treatment of areas such as durable goods, children’s university fees and accrued interest on the stock of wealth (Gale and Scholz (1994))
fertility rate (TFR) has decreased from the 1960s to today, it was relatively stable during the period of interest, at about 1.8-2.0 children per woman. Secondly, the data shows that there was a general increase of received intrahousehold transfers per per young person, namely 0-19 year olds, that typically receive these transfers. This means that parents tended to increase transfers per child even when they had fewer children - a trend observed in the literature as well. However, despite the increase in per capita transfers for this typical age-group, inheritance increased much faster. This result remains the same even when we account for the rise in the population of those that typically make (and receive) inheritance, i.e. the older generations. This implies that even when we account for a demographic change, the trends remain relatively the same and the ratio of intrahousehold transfer to inheritance increases over time (Refer to Figure 1.12 in the Appendix).
Moreover, a change in inheritance tax is also unlikely to explain this trend. In fact, inheri-tance tax has increased significantly in France since the 1960s (Piketty(2011)), which would have theoretically discouraged inheritance rather than increased it.2
In this paper, we argue that the change in the intrahousehold transfers-to-inheritance ratio can be explained by a difference in individuals’ saving behaviors in the context of rising inequality between agents. To make this argument, the paper introduces an overlapping generations model that includes both of these private transfers at the same time. We allow for heterogeneous preferences to bequeath, with one “altruistic” dynasty that transmits inheritance and another that does not. Moreover, we also allow for differences in the role that each of these two transfers play. Inheritance is modeled as additional income received during the middle of life, in line with the empirical evidence from the NTA, while intrahousehold transfers come to support children’s consumption, modeled through the production of human capital - a set-up similar toBecker and Tomes(1986). These various sources of heterogeneity affect agents’ savings behaviors. Inequality, seen as the ratio of capital accumulated by each of the “altruistic” and “egoistic” agents, can be shown to play a key role in the evolution of intrahousehold transfers-to-inheritance ratio in the short- and long-run.
The link between inequality and inheritance is not new. In fact, inheritance has been argued, from early on, to contribute to an increase in wealth inequality (Stamp (1926), Wedgwood
(1929), Blinder (1976) and Harbury and Hitchens (1979)). Davies (1982) found that in-heritance transferred from parents to children can have a “disequalizing” effect on current wealth, measured through an increase in the Gini coefficient for Canada. Gokhale et al.
2Further discussion on the role of taxation in the theoretical model and the latest change of the wealth
(2001) highlighted that bequest can propagate wealth inequality, even when accounting for a number of things such as skill heterogeneity, assortative mating and social security. More-over,De Nardi(2004) showed through a quantitative general equilibrium model for both the U.S. and Sweden that bequests help explain the emergence of large estates and wealth ac-cumulation, and consequently the inequality seen at the time. Davies and Shorrocks (2000) argued that bequest is a crucial element in accurately measuring wealth distribution and inequality.
These findings can be explained by the fact that when inheritance is treated as a luxury good, individuals and households with higher lifetime incomes tend to have higher savings rates and consequently leave more wealth to their offspring, who, in turn, tend to do the same for the following generations. In the long-run, wealth becomes accumulated and transmitted across generations through bequest, leading to persistent inequality.
At the same time, the link between intergenerational transfers, human capital and impact on inequality is also not new. Ishikawa (1975), for instance, argued that accounting for intergenerational transfers for education and bequest can lead to strongly or weakly stratified societies in the long run, with the rich accumulating capital through inheritance and higher education, and the poor having little of either. Becker and Tomes (1986) argued that the degree of intergenerational mobility, and consequently the rise and fall of families, depends on endowments transmitted from parents and investment opportunities for each generation.
Chanda (2008) argued that human capital investments can crowd out physical capital due to a rise in returns to education, as seen in the US, which can potentially reduce inequality. This paper recognizes these various elements. Its contribution is threefold. Firstly, it intro-duces new evidence from the National Transfer Accounts on the trend of inheritance and intrahousehold transfers in France in the period 1979-2011, emphasizing the change in the composition of these private intergenerational transfers over time. As far as we know, this trend has not been previously noted in the literature. Secondly, it explains this trend by using an overlapping generations model that mixes these two transfers at the same time, allowing them to serve different purposes and linking them to inequality, all of which have also not been combined in the OLG literature as far as we know. Thirdly, in setting up this framework and its consequences on the intrahousehold transfer-to-inheritance ratio, it also shows the conditions in which inequality is inverted between agents, with the richer becoming poorer and vice versa. This, too, is a novel feature of the paper.
purpose of these two intergenerational transfers can lead to an increase in wealth inequality and a decrease in the ratio of intrahouseholds transfers to inheritance in the short run. We show that given these differences, long-run inequality exists, but, more importantly, a change in the inheritance preference beyond a certain threshold and a change in the returns to intrahousehold transfers in human capital accumulation can lead to notable changes in long-run wealth accumulation and consequently the richness/poverty of agents.
The rest of the paper is structured as the following. Section 1.2 introduces the National Transfer Accounts (NTA) database and displays the main motivating facts for this research. Section1.3delves into the model set-up and its results regarding steady-state inequality and the dynamics of intrahousehold transfers-to-inheritance ratio, which help us explain what we see in the data. Section 1.4 shows some comparative statics. Section 1.5 further discusses these results and their assumptions. Finally, Section 1.6 concludes.
1.2
Motivating facts: Evidence from the National
Trans-fer Accounts
The National Transfer Accounts (NTA), launched in the early 2000s, disaggregates economic flows seen in the System of National Accounts (SNA) into various ages. In doing so, it allows for a better understanding of how people earn, consume, share and save their income across time, on a macroeconomic level. This can be useful in shedding more light on intergenera-tional (re)allocations and various transfers.
Based on lifecycle theory, the NTA quantifies the lifecycle deficit (or surplus) for each age, which is the difference between consumption and labor income. Children, for example, have lifecycle deficits because they do not earn any labor income, whereas working-age adults often have lifecycle surpluses. At each age, an individual can bridge (reallocate) this deficit (surplus) through three main channels: (1) public transfers, both cash and in-kind; (2) private transfers, within and between households (which exclude the inheritance flows introduced in the paper); and (3) asset-based reallocations such as financial income and savings (NTA Manual (2013)). This can be seen through the NTA Identity below:
Ca,t−La,t= Ta,t+public−Ta,t−public
� �� �
net public transfers
+ Ta,t+private−Ta,t−private
� �� �
net private transfers
+ A+a,t−A− a,t
� �� �
where a denotes age, t denotes time, + stands for received and − stands for given. Net transfers and reallocations are the difference between what is received and what is transferred. Public transfers in the NTA includes what individuals give in terms of taxes and what they receive in various subsidies and social security support, for instance. Private transfers include what is transmitted for purposes such education, healthcare, imputed rent3 and
all other types of consumption. Asset-based reallocations are largely intertemporal and can be divided into capital income and property income, both public and private.4 These
various flows are calculated using administrative records, household surveys and various other surveys that may be country- and time-specific (United Nations (2013)).
Due to the growing use of the NTA methodology across countries, the database can offer some unique perspectives on how people earn, consume, and reallocate their resources (d’Albis and Moosa(2015) and Lee and Mason(2011)). In France, for example, the NTA data show that the age profile of per capita consumption, in real terms, has not changed drastically between 1979 and 2011, while the age profile of labor income shifted towards higher ages, in line with increasing years of education (d’Albis et al. (2015)).
However, more relevant to the purposes of this paper is the magnitude and trend of private transfers, which have often been difficult to quantify on an aggregate level prior to the NTA. These private transfers, more specifically, include two categories: (1) Intrahousehold transfers, i.e. those given and received within one household, which often mean a family; (2) Interhoushold transfers, i.e. between households, which include “regular” and “occasional” cash transfers, as well as “in-kind” transfers. Some of these transfers are estimated using survey data, but the majority are calculated as a residual after estimating the consumption of the individuals in the household and their incomes.
For children, who are the primary recipients of these transfers as will be shown below, these transfers come to bridge the gap between their private consumption and their (lack of) labor income. In France, the sweeping majority of children’s private consumption are in areas other than private education expenditures and private healthcare (refer to Figure 1.13 in Appendix 1.7). Consequently, these transfers effectively serve to support children’s food, shelter, clothing and everything else.
3Imputed rent is the use or consumption of owner-occupied housing. In the NTA it is calculated through
the rental price of similar property at the time.
4While public capital income is quite negligible, public property income includes things such as public
debt, sovereign wealth funds income and, in the special case of the U.S., student loan programs. Private capital income includes housing and consumer durables, while private property income includes consumer debt, land and subsoil minerals.
The data show that “interhousehold” transfers as captured by the NTA are generally small, making up at most a tenth of the total intra- and interhousehold transfers during the period 1979-2011. For ease of reference, they are dropped from the following analysis, where we focus on intrahousehold transfers and inheritance flows.
The NTA France database was also able to provide age-profiles of bequest and inter-vivo gifts, referred to here as “inheritance”, utilizing estimates from a series of works on France by Thomas Piketty (Piketty (2011), Piketty et al. (2014) and Piketty (2014)). While they can also be categorized as “interhousehold”, they are not typically included in the NTA database for various reasons, including a lack of data. The availability of this data for France allows us to expand the analysis and incorporate more holistically all (monetary) intergenerational flows.
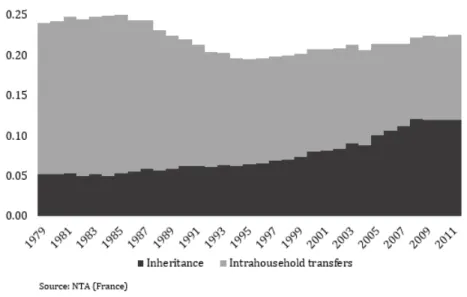
The trend and composition of these two types of private transfers show several important trends. The first is that the sum of these flows has remained a relatively stable share of Gross National Income in France, from about 25% in 1979 to a little over 22% in 2011, with a small dip in the late 1990s, as shown in Figure 1.1.
Figure 1.1: Received private transfers by type as a percentage of GNI
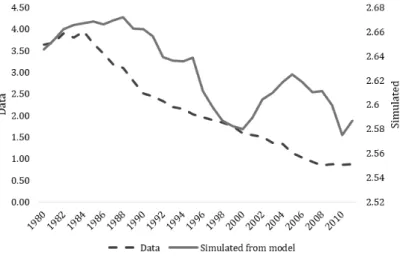
The second is that despite their relatively stable share, the composition of these transfers has changed over time, with a decrease in the share of intrahousehold transfers in overall private transfers. Consequently, the ratio of intrahousehold transfers-to-inheritance has declined, from about 3.6 in 1979 to less than 1 in 2011, as seen in Figure 1.2. This is a ratio of great interest to the purposes of this paper as it captures the change in the composition over time,
which we can explain through the theoretical model.
Figure 1.2: Ratio of intrahousehold transfers to inheritance
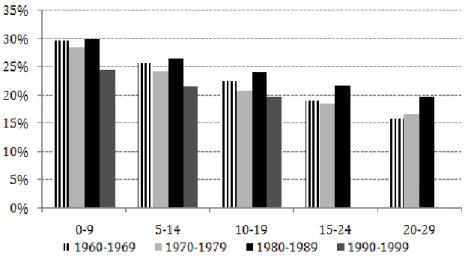
The NTA data also point to the directionality of intrahousehold transfers and inheritance. The working-age population, which is defined conservatively here as those 20-59 years old, is an important net giver of intrahousehold transfers, contributing an average of 93% between 1979 and 2011. Net recipients of these transfers are the younger age groups, mostly those that 0-19 years old, as shown in Figure 1.3. This directionality does not change if we look at net transfers in terms of per capita of each group to account for demographic changes of the groups (as shown in Figure 1.14).5 The oldest age group, 60+ is a minor net giver of
intrahousehold transfers.
5
If we define the working-age group as those 30-59 years old, or even 20-49 years old, for instance, the same conclusion holds.
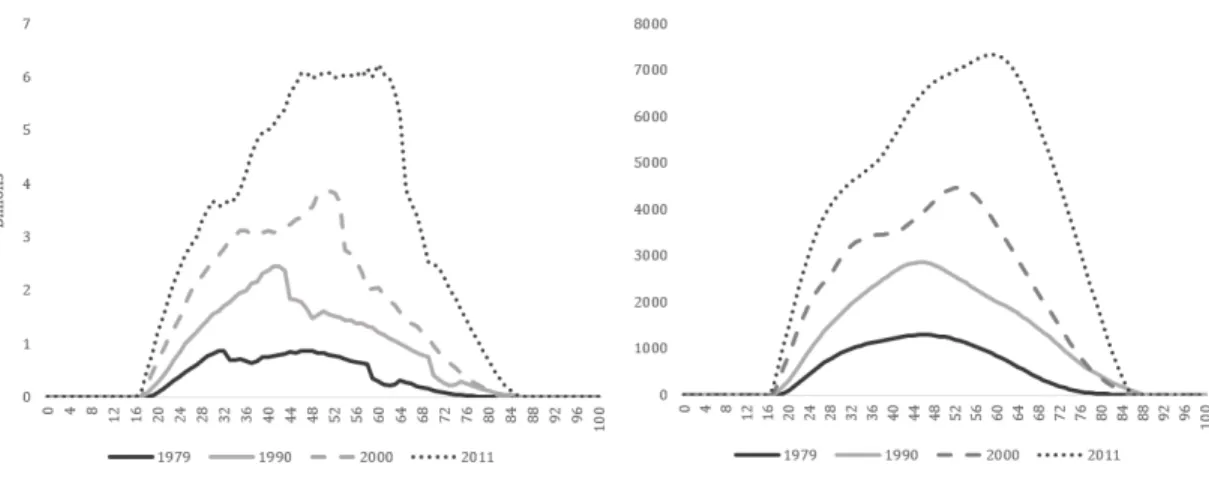
Figure 1.3: Net intrahousehold transfers by broad age-group (billion real euros)
Source: NTA (France)
Inheritance, on the other hand, has been mostly received over the years by both the “working-age” population, in addition to a smaller share received by the oldest generation that is 60+ years old, as shown in Figure 1.4. In fact, over the years, the working-age population has received an average of about 80% of inheritance. The NTA profiles also show that the highest value of received inheritance has not only increased over time, but has also been delayed over time. This means that individuals are now receiving more money at later ages (the age profile of inheritance can be seen in Figure 1.15 in Appendix 1.7). This is in line, of course, with rising life expectancy. This does not change if we look at flows in terms of per capita of the recipient (as shown in Figure 1.16 in Appendix 1.7).6
6
Figure 1.4: Received inheritance by broad age-group (billion real euros)
Source: NTA (France)
The final stylized fact that we make use of relates to the evolution of wealth inequality in France over time. Data from the World Inequality Database (WID) show that the Gini coefficient of wealth inequality has increased during the period that we consider in this paper, from 0.66 in 1979 to 0.7, with some variation in between, as shown in Figure1.5. The share of wealth by the top decile and the top percentile of the population has increased. This is a fact that we exploit in the theoretical model in the following section, where we link private intergenerational transfers to wealth inequality.
1.3
The model
We consider an economy of overlapping generations in discrete time, akin toDiamond(1965). Economic growth is endogenous and driven by human capital accumulation. Generations are linked to each other through altruism for various transfers, and they make up “dynasties.” Production, on the other hand, is made through a representative firm, which operates in perfect competition and produces with constant returns to scale. Below, we set-up the model and show its main conclusions.
1.3.1
Model set-up
1.3.1.1 The individual
Each individual in this model lives for three periods: childhood, adulthood and old-age. For ease of notation, we assume that children are born at time (t − 1). However, decisions are taken by adults for their children and their old-age at time (t).
There exists in each period two types of dynasties in the economy indexed by i = {1, 2}, which differ in their desire for bequest. Dynasty i = 1, which makes up a fixed proportion p of the population, where p ∈ (0, 1), is egoistic and, therefore, does not make any bequest, whereas dynasty i = 2, with a proportion 1 − p of the population, has a desire to bequeath. This heterogeneity in the desire to bequeath is also found in the data, pioneered by Laitner and Juster(1996), who found this heterogeneity when examining a sample of pension holders in the U.S. Kopczuk and Lupton (2007), using a similar method but a different dataset, also found this heterogeneity, with about three-quarters of the elderly population having a bequest motive that caused them to reduce their consumption and transfer inheritance to the following generation.7
We assume, for further simplicity, no population growth, and thus population size is nor-malized to 1 over time.
Besides decisions pertaining to consumption and savings, individuals also make decisions regarding two kinds of intergenerational transfers. The first are transfers in the form of inheritance, denoted (b), which are made at old age to the middle age-group (adulthood).
7Based upon their suggestion, in the following simulation part, we will choose p = 0.3 which represents
The second are intrahousehold transfers made by adults for children, denoted (m). These transfers are used solely for the development of children’s human capital, and they should be positively correlated with the child’s future labor income.
We assume, however, that the human capital of the individual does not only depend on these parental intrahousehold transfers, which are specific to dynasty i, but also on the average stock of human capital in society. This assumption is in line with the “external effect” argued originally by Lucas Jr (1988) and later integrated into models as in Tamura
(1991) and Bovenberg and van Ewijk (1997). These models suggest that the average stock of human capital in society does not only affect the individual’s own human capital, but also by extension the productivity of all factors of production.8 It is also in line with the idea
that individuals do not start with a clean slate, or zero human capital, when they are born, but that they are endowed from the beginning with a certain level of human capital that is best approximated by the average human capital in the economy (see, for example, Glomm and Ravikumar (1997) andde la Croix and Michel (2007)).
Therefore, the human capital, H, of an adult at time t of dynasty i can be expressed as a function of the previous period’s average human capital and the intrahousehold transfers received at childhood, as the following:
Hi,t = mλi,t−1Ht−11−λ, λ ∈ (0, 1) (1.1)
where λ is the elasticity of human capital accumulation with respect to intrahousehold trans-fers - a crucial parameter in our model.
For every efficient unit of labor, an adult receives a wage wt that entails a gross labor income
of wtHi,t, as well as bequest from the older generation, βi,t. From this inflow of income,
he/she decides to consume ci,t, to save si,t and to invest in children mi,t. At old age, the
individual allocates from his/her capitalized savings, Rt+1si,t, how much to consume, (di,t+1),
and how much to bequeath to the adult generation, bi,t+1.
We denote Vti the utility of an adult of dynasty i and assume that it is a logarithmic function.
The individual, therefore, maximizes the utility function, Vi
t, as the following:
max
ci,t,mi,t,di,t+1,bi,t+1
ln(ci,t) + θ ln(mi,t) + β ln(di,t+1) + βγiln(bi,t+1) (1.2)
8
Note also that the average stock of human capital in society is found empirically to be significant and positive for productivities and incomes across countries (Benhabib and Spiegel(2005)).
where θ captures the preference to give intrahousehold transfers, β captures time preference, and γi captures the intergenerational degree of altruism of dynasty i. We assume that
γ1 = 0 for the egoistic dynasty, and γ2 = γ ∈ (0, 1) for the altruistic dynasty. Note that
this formulation expresses the inheritance motive as a “joy of giving,” as proposed by Yaari
(1964). This is a common expression for altruism in the literature due to its tractability (Abel and Warshawsky (1987)).
The budget constraints for a type i individual are as follows:
ci,t+ si,t+ mi,t ≤wtHi,t + bi,t (1.3)
di,t+1+ bi,t+1≤si,tRt+1 (1.4)
where Rt and wt are the rate of return on capital and wage per effective labor unit,
respec-tively. We assume that at time 0, si,0 and Hi,0 are given.
From the first-order conditions we can derive optimal consumption, savings, intra-household transfers and inheritance for type i at time t as follows:
ci,t = 1 1 + θ + β(1 + γi) (wtHi,t + bi,t) (1.5) mi,t = θ 1 + θ + β(1 + γi) (wtHi,t+ bi,t) (1.6) di,t+1= βRt+1 1 + θ + β(1 + γi) (wtHi,t+ bi,t) (1.7) bi,t+1= βγiRt+1 1 + θ + β(1 + γi) (wtHi,t + bi,t) (1.8)
Given differences in the preference to bequeath, optimal inheritance for each dynasty can be more clearly expressed as the following:
b1,t+1= 0 (1.9a)
b2,t+1=
βγRt+1
1 + θ + β(1 + γ)(wtH2,t + b2,t) (1.9b)
Note that given the logarithmic utility function, optimal inheritance and intrahousehold transfer will always be an interior solutions. This means that the set-up of the model does not allow for negative bequest and transfer.
The savings function for each dynasty can be derived as follows: s1,t = β 1 + β + θwtH1,t (1.10) s2,t = β(1 + γ) 1 + θ + β(1 + γ)(wtH2,t+ b2,t) (1.11)
Due to our logarithm utility function, it is no surprise that the optimal level of our control variables is always proportional to the agent’s wealth, (wtHi,t+ bi,t). Additionally, note that
that:
β(1 + γ)
1 + θ + β(1 + γ) > β 1 + β + θ
which implies that the rate of savings of the altruistic household is always higher than that of the egoistic one.
1.3.1.2 Firms
Production in the economy, denoted by F (Kt, Ht), occurs through a representative firm that
operates according to constant returns to scale and uses two inputs: the aggregate stock of capital in the economy, Kt, and the aggregate stock of human capital, Ht, expressed as the
following:
Yt= KtαHt1−α (1.12)
where α is the output elasticity of capital in the production function. To simplify the analysis, we assume that capital is fully depreciated after each period t.
We define new variables ˜Yt ≡ HYtt and ˜Kt ≡ KHtt the output and capital per effective worker,
respectively. Then in intensive form, the production function can be written as ˜Yt = ˜Ktα. In
equilibrium, factors are paid their marginal products:
Rt= α ˜Ktα−1 (1.13)
wt = (1 − α) ˜Ktα (1.14)
1.3.2
Equilibrium in the economy
Given an initial capital for each dynasty Ki,0 and an initial human capital for each dynasty
and quantities for dynasty-i variables {ci,t, di,t, si,t, mi,t, bi,t, Hi,t}∞t=0, together with aggregate
variables {Yt, Ht, Kt}, such that:
(i) Households behave optimally, given by Equations (1.5)-(1.11). (ii) Firms maximize their profit, given by Equations (1.13) and (1.14). (iii) All markets clear.
The capital market clearing condition requires that the aggregate savings owned by members of both dynasties at time t are equal to the physical capital stock available at time t + 1:
K1,t = s1,t−1 (1.15a)
K2,t = s2,t−1 (1.15b)
Kt= pK1,t + (1 − p)K2,t = ps1,t−1+ (1 − p)s2,t−1 (1.15c)
The human capital market clearing condition requires that the aggregate human capital owned by both dynasties equals the human capital stock of the economy at time t:
Ht = pH1,t+ (1 − p)H2,t = pmλ1,t−1Ht−11−λ+ (1 − p)mλ2,t−1Ht−11−λ (1.16)
Finally, the goods market clearing condition, which results from the individual budget con-straints, requires that what is produced is consumed, shared or saved in the economy,9 such
that: p�c1,t+ d1,t+ m1,t + s1,t � + (1 − p)�c2,t+ d2,t + m2,t+ s2,t � = Yt (1.17)
From Equations (1.13) - (1.16), we can obtain the dynamic system which governs the equi-librium paths in the neighborhood of the steady state (K1, K2, H1, H2). We can easily see
that this is a four-dimensional dynamic system with four pre-determined variables: 1 + θ + β β K1,t+1= wtH1,t (1.18) 1 + θ + β(1 + γ) β(1 + γ) K2,t+1− γ γ+ 1RtK2,t = wtH2,t (1.19) H1,t+1 = Ht1−λ( θ βK1,t+1) λ (1.20)
9Note that the market clearing condition is essentially an economy-wide budget constraint. This
in-cludes all what is spent, saved and transferred to other generations, including intrahousehold transfers and inheritance in this model.
H2,t+1 = Ht1−λ( θ β(1 + γ)K2,t+1) λ (1.21) where: Ht = pH1,t+ (1 − p)H2,t (1.22) Rt = α( pK1,t+ (1 − p)K2,t pH1,t+ (1 − p)H2,t )α−1 (1.23) wt= (1 − α)( pK1,t+ (1 − p)K2,t pH1,t+ (1 − p)H2,t )α (1.24)
1.3.3
Transitional dynamics and steady state
In order to examine the evolution of the economy in the short-term as well as its steady state in the long-term, we will transform in what follows all variables to the intensive form, i.e. per efficient unit of labor Ht. We will then denote the new variables with the symbol
(∼) to mark this transformation.
We define a new variable xt ≡ ˜ K2,t
˜
K1,t that captures the ratio of the capital intensity held by
altruistic and egoistic dynasty, respectively, where ˜K2,t ≡ KH2,tt and ˜K1,t ≡ KH2,tt . We view
capital, K, as the only form of measurable physical wealth in our model. Consequently, we exploit xt in later sections to measure wealth inequality in the economy. When this ratio is
greater than 1, then wealth inequality appears in the sense that the altruistic family owns more capital than the egoistic one. When the ratio is less than 1, inequality still exists, but the egoistic family owns more capital than the altruistic one. Consequently, inequality increases when x moves further away from 1, in either the positive or the negative direction. By dividing all variables of Equations (1.18)-(1.21) by the aggregate level of human capital, we can rewrite the equilibrium system in the intensive form which will then allow us to characterized the dynamic system of four dimensions (K1,t, K2,t, H1,t, H2,t) to the dynamics
of only xt.10
In this setting, we are interested in two particular parameters, λ and γ, which capture the share of intrahousehold transfer in the production of human capital accumulation and the preference for inheritance, respectively. We, therefore, characterize the transitional dynamics of wealth inequality xt as:
xt+1 = G(xt; λ, γ) (1.25)
where G(xt; λ, γ) ≡ (1 + β + θ)(1 + γ) 1 + θ + β(1 + γ) � ( xt 1 + γ) λ+ γα (1 + γ)(1 − α)xt p + (1 − p)(xt/(1 + γ))λ p + (1 − p)xt � and x0 = ˜ K2,0 ˜ K1,0 is given at time 0.
1.3.3.1 Steady state solution
Let xt+1 = xtin Equation(1.25). Since the equilibrium is fully characterized by the dynamics
of x, the number of steady states in the economy is equal to the number of solutions of x computed from (1.25). Letting x = G(x; λ, γ) gives us:
x = (1 + β + θ)(1 + γ) 1 + θ + β(1 + γ) � ( x 1 + γ) λ+ γα (1 + γ)(1 − α) p + (1 − p)(x/(1 + γ))λ p + (1 − p)x x � � �� � ≡G(x;λ,γ) (1.26)
Simplifying Equation (1.26) gives us: 1 + θ + β(1 + γ) (1 + β + θ)(1 + γ) = xλ−1 (1 + γ)λ + γα (1 + γ)(1 − α) p + (1 − p)(x/(1 + γ))λ p + (1 − p)x � �� � ≡RHS(x) (1.27)
To determine the number of solutions of x, in what follows, we are going to study the shape of the function RHS(x) given by (1.27). Clearly,
∂RHS(x) ∂x = xλ−2 (1 + γ)λ � �� � >0 (λ − 1) � �� � <0 +(1 − p)x λ−1(p + (1 − p)x) (1 + γ)λ(p + (1 − p)x)2 � �� � >0 (λ − 1) � �� � <0 < 0
Hence, RHS(x) is a monotonically decreasing function of x. Moreover, notice that
lim
x→0+RHS(x) = +∞
Since the LHS function in (1.27) is independent of x. We can then conclude that there exists a unique positive steady state value denoted by x∗ such that
1 + θ + β(1 + γ)
(1 + β + θ)(1 + γ) = RHS(x
∗
This allows us to make the following proposition. Proposition 1 The steady state value x∗ is unique.
This implies that, in steady state, capital in intensive form saved by each dynasty is positive. Since this x∗ also serves as our wealth inequality measurement, this proposition also means
that inequality exists in the long-run.
We are now in the position to study the key features of x∗. Recall that if x∗ > 1, i.e. K˜2
˜ K1 > 1,
we obtain a long-run wealth inequality that is driven by the altruistic dynasty. Alternatively, in the case x∗ < 1, the long-run inequality is induced by the egoistic family. Thus, to study
the value of x∗ compared to 1, i.e. with complete equality, we compare the value of the
function G(1; λ, γ) to the value of 1 when x = 1. Note that G(1; λ, γ) > 1 infers that x∗ > 1
while G(1; λ, γ) < 1 means that x∗ < 1.
From (1.26), we can compute G(1; λ, γ) as the following: G(1; λ, γ) = (1 + β + θ)(1 + γ) 1 + θ + β(1 + γ) � ( 1 1 + γ) λ+ γα (1 + γ)(1 − α)(p + (1 − p)( 1 1 + γ) λ)� (1.28)
Firstly, depending on our parameter choices of γ and λ, G(1; λ, γ) can be greater or smaller than 1. Thus, we are going to determine the particular values of ¯λ and ¯γ such that G(1; ¯λ, ¯γ) = 1.
Secondly, notice that the function G(1; λ, γ) is a decreasing function of λ. Solving G(1; ¯λ, ¯γ) = 1 gives us at most one solution of ¯λ. The solution ¯λ lies in between the interval (0, 1) if the following conditions are satisfied:
lim
λ→0G(1; λ, γ) > 1
lim
λ→1G(1; λ, γ) < 1
We can see that the first condition always holds since: lim λ→0G(1; λ, γ) = (1 + β + θ)(1 + γ) 1 + θ + β(1 + γ) � �� � >1 � 1 + γαp (1 + γ)(1 − α) � � �� � >1 > 1
The second condition holds if: lim λ→1G(1; λ, γ) = 1 + β + θ 1 + θ + β(1 + γ) � 1 + γα 1 − α(p + 1 − p 1 + γ) � < 1
Simplifying it gives us the condition on γ compared to the critical value11 defined by ¯γ as follows: γ > ¯γ ≡ 1−α 1 − p α β 1+β+θ −p −1
Therefore, we obtain the following scenarios:
(1) If γ < ¯γ, then λ < ¯λ for all λ ∈ (0, 1) and G(1; λ, γ) > 1.
(2) if γ ≥ ¯γ, then we can determine the value of G(1; λ, γ) conditional on λ :
G(1; λ, γ) = ≥1, if λ ≤ ¯λ < 1, if λ > ¯λ
Figure (1.6) summarizes graphically these conditions. Notice that ¯λis a decreasing function12
of γ.
Figure 1.6: Inequality conditional on choices of γ and λ
γ λ ¯ γ x∗ > 1 x∗ < 1 x∗ > 1
We then introduce the following proposition.
Proposition 2 There exists a threshold of bequest preference, ¯γ, and of the share of intra-household transfers in human capital accumulation, ¯λ, where G(1; ¯λ, ¯γ) = 1. Under the
condition that γ > ¯γ and λ > ¯λ, long-run inequality exists such that the egoistic family
11Note that ¯
γ is independent of λ. The condition to have ¯γ ∈ (0, 1) is 1+2p < 1−αα β
1+β+θ < 1. Using
conventional parameter choices such as α = 0.3, β = 0.6, θ = 0.3 and p = 0.3, we obtain ¯γ = 0.6, which is clearly between (0, 1).
accumulates more wealth than the altruistic family: x∗ < 1 and K˜2 ˜ K1 < 1
Otherwise, inequality in steady-state exists where the altruistic dynasty possesses more wealth than the egoistic dynasty:
x∗
> 1 and K˜2 ˜ K1
> 1
This suggests that only if the degree of altruism (γ) is not too large, the altruistic dynasty would be able to accumulate higher long-run wealth than the egoistic dynasty, meaning x∗
> 1. This is is similar to the findings of Michel and Pestieau (2005), who argued that long-run wealth is only held by the most altruistic families.
Let us now discuss some intuitions of the findings. Understanding Proposition2necessitates understanding the effect of γ. From Equations (10), (11), (14a) and (14b) we can see that the steady state accumulated wealth of dynasty i, ˜Ki, depends particularly on bequest preference
γ, on inheritance given at time t and on the on their human capital accumulation as follows: ˜ Ki = β(1 + γ) 1 + θ + β(1 + γ)(w ˜Hi+ ˜bi) = β(1 + γ) 1 + θ + β(1 + γ)(w ˜m λ i + ˜bi)
To explain how these factors influence long-run capital for each dynasty, we can simplify this function to the following:
˜
Ki = f (γ, ˜bi, ˜mi)
The impacts from a higher inheritance preference on ˜Ki can be untangled as follows:
∂ ˜Ki ∂γ = ∂f ∂γ ���� >0 + ∂f ∂˜bi ∂˜bi ∂γ � �� � >0 � �� � Inheritance Ef f ect + ∂f ∂m˜i ���� >0 ∂m˜i ∂γ ���� ? � �� � Income Ef f ect
One can see that an increase in the inheritance preference γ triggered two different effects which are called the inheritance effect and the income effect. Obviously, the inheritance effect in response to an increase in the degree of altruism has to be positive as people tend to leave more bequest for their offspring. We write: ∂˜∂fb
i
∂˜bi