HAL Id: hal-03036494
https://hal.archives-ouvertes.fr/hal-03036494
Submitted on 2 Dec 2020HAL is a multi-disciplinary open access archive for the deposit and dissemination of sci-entific research documents, whether they are pub-lished or not. The documents may come from teaching and research institutions in France or abroad, or from public or private research centers.
L’archive ouverte pluridisciplinaire HAL, est destinée au dépôt et à la diffusion de documents scientifiques de niveau recherche, publiés ou non, émanant des établissements d’enseignement et de recherche français ou étrangers, des laboratoires publics ou privés.
A simple fluorescence microplate assay to monitor
RNA-DNA hybrid unwinding by the bacterial
transcription termination factor Rho
Isabelle Simon, Marc Boudvillain
To cite this version:
Isabelle Simon, Marc Boudvillain. A simple fluorescence microplate assay to monitor RNA-DNA hy-brid unwinding by the bacterial transcription termination factor Rho. Marc Boudvillain. RNA remod-eling proteins, 2209, Humana press, pp.143-161, inPress, Methods in Molecular Biology, �10.1007/978-1-0716-0935-4_10�. �hal-03036494�
1 Authors’ manuscript
A simple fluorescence microplate assay to monitor RNA-DNA hybrid unwinding by the
bacterial transcription termination factor Rho.
Isabelle Simon1,2 and Marc Boudvillain1,3
1Centre de Biophysique Moléculaire (UPR 4301), CNRS, rue Charles Sadron, Orléans,
France.
2Ecole doctorale Santé, Sciences Biologiques et Chimie du Vivant (ED 549), Université
d’Orléans.
3Corresponding author: marc.boudvillain@cnrs.fr
2
Abstract
Transcription termination factor Rho contributes to shape the transcriptomes of many bacteria and is essential in a large subset of them. Although the transcription termination function of Rho is not always easy to reconstitute and to study in vitro, assays based on the
ATP-dependent RNA-DNA hybrid unwinding activity of the factor can prove useful to dissect Rho mechanisms or to seek new antibiotics targeting Rho. However, current in vitro assays of Rho helicase activity are time-consuming, as they usually require radiolabeling of the hybrid substrates and analysis of reaction products by gel electrophoresis. Here, we describe a fluorescence-based microplate assay that informs on Rho helicase activity in a matter of minutes and allows the multiplexed analysis of conditions required for primary biochemical characterization or for drug screening.
3
1. Introduction
Transcription termination factor Rho is a homo-hexameric, ring-shaped protein factor that has major regulatory functions in bacteria (reviewed in: [1-3]). The molecular mechanisms
underlying the biological functions of Rho are complex and involve multiple rearrangements of the Rho ring structure and of its network of interactions with the RNA substrate (see Chapter 9 in this volume and [4,5]), as well as intricate interplays with the transcription and translation machineries and a variety of cofactors [1-3]. Several biochemical assays have been developed over the years to characterize the Rho factor, from basic RNA binding and ATPase assays [6,7] to more sophisticated transcription termination assays [8-11]. Monitoring of the ATP-dependent RNA-DNA hybrid unwinding activity of Rho [12] is also a method of choice to characterize the factor in vitro [13,14]. This helicase activity derives from oligonucleotide “roadblock” displacement upon directional translocation of the Rho factor along single-stranded RNA substrates [15-17]. It thus represents a good compromise to probe the
molecular motor features of Rho (as in termination assays) under conditions where the nucleic acid substrate and reaction setup or ingredients can be easily manipulated and varied (as in RNA binding and ATPase assays). For instance, RNA-DNA substrates having complex, multipartite architectures or bearing specific chemical modifications can be used in the helicase assay to probe Rho stepping mechanism [18-20], a task that is not possible with the other biochemical assays.
In most Rho helicase experiments, a RNA-DNA hybrid substrate is first modified with a
32P label (most often on the “tracking” RNA strand) and then purified by polyacrylamide gel
electrophoresis (PAGE). Then, the substrate is mixed with Rho and ATP in a suitable reaction buffer and reaction aliquots are withdrawn and quenched at various times. The reaction aliquots are then analysed by PAGE to reveal the fractions of single-stranded RNA products formed upon Rho-directed hybrid unwinding as a function of time [14]. In a variant of this
4
protocol, the 32P label is replaced by a fluorochrome (usually on the DNA oligonucleotide
strand) in order to analyze the PAGE gel with a fluorescence imager [13]. Although the method is very efficient (see Note 1), it is burdensome, time-consuming, and does not allow frequent record of the helicase activity over time nor sample multiplexing. To address these limitations, we have developed a new assay of Rho helicase activity that is based on the development of a fluorescence signal upon unwinding of a tripartite RNA-DNA hybrid labelled with a fluorophore-quencher pair (Figure 1A). The modality of detection and assay conditions were designed for use with a multiplate fluorescence reader, thereby allowing either continuous or end-point monitoring of Rho helicase activity as well as sample
multiplexing suitable for quick biochemical investigations (see Note 1) and, potentially, for drug screening.
2. Materials
Only RNase-free, milliQ-grade deionized water should be used to prepare buffers and to make dilutions. All solutions (and water stocks used for dilutions) should be sterilized by filtration with single-use 0.2 µm pore size filter units. We also recommend using high-quality
microtubes, preferably ones intended for low non-specific binding of nucleic acids and proteins.
2.1. Preparation of the RNA strand by transcription
1. Benchtop centrifuge and vortex mixer.
2. Dry bath incubator with shaking capability (e.g. Eppendorf Thermomixer).
3. Saran sheets and blade.
4. 5 mL syringe equipped with a glass-wool plug and a 0.2 µm syringe filter.
5
6. N,N,N,N′-tetramethylethylenediamine (TEMED).
7. 25% (w/v) ammonium persulfate (APS) in water; fresh solution stored at 4°C.
8. 10X TBE buffer: 0.89 M Tris-base, 0.89 M boric acid, and 20 mM EDTA.
9. 1X TBE buffer obtained by diluting the 10X TBE buffer stock.
10. Phenol:chloroform:isoamyl alcohol (25:24:1) mix, pH 6.7.
11. Diethyl ether.
12. Ethanol absolute (≥ 99.8%) stored at -20°C.
13. 0.5 M EDTA solution adjusted to pH 7.5 with NaOH.
14. 1X M10E1 buffer: 10 mM MOPS, 1 mM EDTA, pH 6.0.
15. 3 M sodium acetate solution adjusted to pH 6.5 with acetic acid.
16. Elution buffer: 0.3 M sodium acetate in 1X M10E1 buffer.
17. UV spectrophotometer (preferably one able to measure absorbance from 1 µL
samples).
18. Formamide.
19. Control formamide buffer: formamide supplemented with 0.01 % (w/v) xylene cyanol
and 0.01 % (w/v) bromophenol blue.
20. 100 nM DNA template stock in 1X M10E1 buffer (see Note 2).
21. 5X Transcription buffer: 400 mM HEPES pH 7.5, 112 mM MgCl2, 100 mM DTT, 5
mM spermidine, 0.05% (v/v) Triton X-100 (see Note 3).
22. 20µ/µL Superase-IN (Thermo Fisher Scientific).
23. 100 mM rATP, rCTP, rGTP, and rUTP stock solutions.
24. 12.5 µM T7 RNA polymerase (if using a commercial preparation, follow
manufacturer’s instructions to adjust enzyme amounts in transcription reactions).
25. Denaturing 6% acrylamide solution. Mix 4.5 mL of a commercial 40%
6
TBE, and adjust the volume to ~25 mL with deionized water. Heat in a microwave oven to melt urea. (see Note 4). Adjust the volume to 30 mL with deionized water.
26. X-ray intensifying screen or a fluor-coated TLC plate.
27. Hand-held 254 nm UV lamp.
2.2. Preparation of the RNA-DNA hybrid substrate
1. Items 1-17 from section 2.1.
2. 100 µM stock solutions of oligodesoxyribonucleotides Oligo1 (bearing an Alexa488
fluorochrome at its’ 5’ end), Oligo2 (bearing a Dabcyl quencher at its 3’end) and Oligo4 (Table 1) (see Note 5).
3. Purified RNA transcript from section 3.1.
4. 5X Helicase buffer: 750 mM potassium acetate, 100 mM HEPES pH 7.5, 0.5 mM
EDTA.
5. 1X Helicase buffer obtained by dilution of the 5X buffer stock in sterile deionized
water.
6. Native 6% acrylamide solution. Mix 4.5 mL of a commercial 40%
acrylamide:bis-acrylamide [29:1 ratio] solution with 3 mL of 10X TBE buffer and adjust the volume to 30 mL with deionized water. (see Note 4).
7. 25% (w/v) Ficoll 400 in sterile deionized water.
8. Control Ficoll buffer: 25% Ficoll 400 solution supplemented with 0.01 % (w/v) xylene
cyanol, and 0.01 % (w/v) bromophenol blue.
9. Fluorescent gel imager (e.g. Typhoon FLA 9500 from GE Healthcare) and associated
software for gel image analysis (e.g. Imagequant TL software from GE Healthcare).
7
1. Items 1 and 2 from section 2.1.
2. Purified RNA-DNA hybrid from section 3.2.
3. 100 µM stock solution of oligodesoxyribonucleotide Oligo3 (Table 1) (see Note 6).
4. 2.8 µM Rho hexamer stock solution in Rho storage buffer (50% glycerol, 100 mM
KCl, 0.1 mM EDTA, 0.1 mM DTT, 10 mM Tris–HCl, pH 7.9). Preparation of the Rho protein from Escherichia coli is detailed in volume 587 of the series [14].
5. 5X helicase buffer: 750 mM AcK, 100 mM HEPES pH 7.5, 0.5 mM EDTA, 0.5
mg/mL BSA (see Note 7 and Note 8).
6. 1X helicase buffer obtained by diluting the 5X helicase stock buffer with water.
7. 8X initiation mix: 8mM rATP and 8 mM MgCl2 in 1X helicase buffer.
8. 8X control mix: 8mM rADP and 8 mM MgCl2 in 1X helicase buffer.
9. Low adsorption, black 384-well microplates (e.g. NBS microplates from Corning) (see
Note 9).
10. 16.5 mM Bicyclomycin inhibitor solution in 1X helicase buffer.
11. Fluorescence microplate reader equipped with micro-injectors (see Note 10) and
associated software.
2.4.Gel-shift helicase assay
1. Items 5-9 from section 2.1.
2. Item 9 from section 2.2.
3. 10% (w/v) sodium dodecyl sulfate (SDS) in water. Store at room temperature.
4. 2X Quench buffer: 8% (v/v) Ficoll 400, 1% (w/v) SDS, 40 mM EDTA, 0.3 M sodium
acetate.
5. Control helicase buffer: 4% (v/v) Ficoll 400, 0.5% (w/v) SDS, 20 mM EDTA, 0.15 M
8
6. Helicase PAGE solution: 8% (v/v) acrylamide and 0.5% (w/v) SDS in 1X TBE buffer.
Mix 6 mL of a commercial 40% acrylamide:bis-acrylamide [19:1 ratio] solution with 1.5 mL of 10% SDS solution and 3 mL of 10X TBE buffer, and adjust the volume to 30 mL with deionized water (see Note 4).
7. SDS run buffer: 1X TBE buffer containing 0.5% (w/v) SDS.
3. Methods
3.1. Preparation of the RNA strand by transcription
Our standard RNA strand used for assembly of the RNA-DNA hybrid substrates is 129 nucleotide (nt)-long (see substrate C in ref. [19]) and is prepared by in vitro transcription of a linear DNA template obtained by PCR amplification (see Note 2). The DNA template
contains a pT7 promoter for the bacteriophage T7 RNA polymerase followed by sequences encoding a strong Rut (Rho utilization site) site [21,22] and the reporter region recognized by the fluorophore- and quencher-labelled oligonucleotides (Figure 1A). [Figure 1 near here]
1. Slowly melt on ice the 5X transcription buffer, the DNA template solution, and the
stocks of rNTPs. Homogenize each solution by gentle vortexing before use.
2. In a 1.5 mL microtube, mix 111 µL of water, 50 µL of 5X transcription buffer,
12.5µL of each the rATP, rCTP, rGTP, and rUTP stock solutions, 1µL of
SUPERase-IN, and 25 µL of the 100 nM DNA template stock. Incubate the mixture for 5 minutes at 37°C.
3. Add 10 µL of T7 RNA polymerase and incubate the mixture for 2h at 37°C under
shaking (300-400 rpm).
4. After 2h, add another 10 µL of T7 RNA polymerase and incubate the mixture for 1h
9
5. To stop the reaction, add 12 µL of 0.5 M EDTA and 28µL of 3 M sodium acetate.
6. Add 150 µL of phenol:chloroform:isoamyl alcohol extraction mix. Vortex and
centrifuge for 5 min at 18,000 g to separate the organic and aqueous phases. Transfer the top phase (aqueous) to a new microtube.
7. Add 300 µL of diethyl ether, vortex quickly and centrifuge for 1 min at 18,000 g.
Remove and discard the top ether phase. Repeat this procedure once (see Note 12).
8. Add 900 µL of ethanol, vortex, and incubate overnight at -20°C to precipitate RNA.
9. Centrifuge for 30 min at 20,000 g, then remove and discard supernatant. Add 150 µL
of ice-cold ethanol, vortex vigorously and centrifuge for 15 min at 20,000 g.
10. Remove ethanol, carefully avoiding the RNA pellet (which should be visible at this
stage). Leave the microtube open in a dry bath (in a fume hood) for at least 10 min at 30°C to dry the pellet.
11. Dissolve the RNA pellet in 20 µL of M10E1 buffer and incubate for 10 min at 30°C
under shaking (300-400 rpm). The pellet should not be longer visible. Otherwise, incubate for a few minutes longer.
12. Assemble PAGE gel plates and spacers according to the manufacturer instructions.
We use custom-made 20 x 20 cm gel plates with 0.8 mm spacers and a 10-teeth comb.
13. Use tape or any other suitable mean to seal hermetically the bottom of the gel plates.
14. Mix 25mL of the denaturing 6% acrylamide solution with 60 µL of 25% APS and 30
µL of TEMED. Pour the mixture between the plates, carefully avoiding formation of air bubbles, and insert the comb.
15. Once the gel has polymerized (15-20 min at room temperature), remove the comb
and wash the wells with 1X TBE buffer using a 10 mL syringe. Install the gel into a vertical electrophoresis unit and fill the top and bottom tanks with 1X TBE buffer.
10
Set the power supply at 25W and perform a pre-electrophoresis run for 30 min (see
Note 13). Turn power off.
16. Add 20µL of formamide to the RNA sample from step 11 and heat the mixture at
90°C for 1 min. Prepare a control sample by mixing 5 µL of control formamide buffer with 5µL of M10E1 buffer. Flush diffusing urea from gel wells using a syringe
filled with 1X TBE. Load the RNA and control samples in well-separated wells.
17. Run the gel at 25W until the bromophenol blue in the control sample reaches the
bottom of the gel (see Note 14).
18. Remove the plates and carefully wrap the gel in saran sheets (see Note 15), limiting
formation of bubbles and wrinkles as much as possible.
19. Place the gel on a fluor-coated TLC plate and visualize the transcript band with a 254
nm lamp by UV shadowing (Figure 1B).
20. Cut the gel piece corresponding to the correct-size RNA shadow with a clean scalpel
blade and transfer the piece to a 2 mL microtube. Use a pipette tip or tissue grinder to crush the gel piece in small fragments and add 1mL of elution buffer. Incubate for 1 h at 30°C under shaking (500 rpm).
21. Briefly centrifuge at 2,000 g before transferring the supernatant into a 5 mL
microtube kept on ice (see Note 16).
22. Add 1mL of elution buffer to the tube containing the gel fragments and incubate for
1 h at 30°C under shaking (500 rpm) (see Note 17).
23. Briefly centrifuge at 2,000 g and transfer supernatant to the tube from step 21. To
remove gel debris, filter the solution with a 5 mL syringe equipped with a glass-wool plug and a 0.2 µm filter.
11
25. Centrifuge for 30 min at 20,000 g. Discard supernatant (watch for pellet, which may
be barely visible and stick poorly to the tube) and add 500 µL of ice-cold ethanol. Briefly vortex and centrifuge for 15 min at 20,000 g. Discard supernatant.
26. Leave the microtube open in a dry bath (in a fume hood) for at least 10 min at 30°C
to dry the pellet. Dissolve pellet in 50µL of M10E1 buffer.
27. Use a UV spectrophotometer to determine RNA concentration from the absorbance
at 260 nm. We assume that ε260nm = number of nucleotides x 104 L/mol/cm. Typical
yields range between 200 and 500 pmoles of purified RNA from a 250µL transcription.
28. Store the RNA solution at -20°C.
3.2. Preparation of the RNA-DNA hybrid substrate
Oligonucleotides and hybrid substrates containing the Alexa488 or Dabcyl moieties are fragile and should be handled with care (see Note 5). In order to detect unambiguously the position of RNA-DNA hybrid species in PAGE gels, we also prepare a variant of the tripartite RNA-DNA substrate (Figure 1A) devoid of Dabcyl quencher (Figure 1C).
1. In a 1.5 mL microtube, mix 50 pmoles of RNA (from section 3.1, step 28), 3 µL of 5X
helicase buffer, 0.8 µL of 100 µM Oligo1 and 0.8 µL of either Dabcyl-labelled Oligo2 or unlabelled Oligo4 (100 µM each). Adjust final volume to 12.5 µL with water.
2. Heat the mixture for 2 min at 90°C in a dry bath. Remove the tube from the dry bath
and incubate for 15 min at room temperature.
3. Assemble PAGE gel plates using 0.4 mm spacers and comb (see Note 18) as described
in steps 12-13 of section 3.1.
4. Mix 15mL of native 6% acrylamide solution with 35 µL of 25% APS and 35 µL of
12
5. Once the gel has polymerized, remove the comb and flush the wells with a 10 mL
syringe containing 1X TBE. Install the gel into an electrophoresis unit and fill the top and bottom tanks with 1X TBE. Set the power supply at 140V and perform a pre-electrophoresis run for 30 min. Turn off the power.
6. Add 2.5 µL of 25% Ficoll-400 to each sample and load samples into well-separated
gel wells (see Note 19). In a separate well, load a control sample made by mixing 5 µL of M10E1 buffer with 1 µL of control Ficoll buffer. The gel wells should be flushed
with 1X TBE right before loading of the samples.
7. Run the gel at 140V for approximately 4 h, until the bromophenol blue in the control
sample is at the very bottom of the gel.
8. Remove and replace one of the plate by a Saran sheet, and create marks with pieces of
tape or a permanent marker pen on the saran sheet. (see Note 20).
9. Scan the gel with a fluorescence imager using settings adequate for detection of
Alexa488 fluorescence (see Note 21). Print le gel image at real size.
10. Use the tape or pen marks (Figure 1C) to position the gel on the printed image. Use a
clean scalpel blade to cut the gel band corresponding to the correct hybrid substrate, carefully avoiding the band right below (corresponding to an hybrid substrate lacking Oligo 2; Figure 1C) Transfer the gel piece in a 2 mL microtube.
11. Add 1 mL of elution buffer and incubate for 1h at 18°C (see Note 22) under shaking
(500 rpm).
12. Briefly centrifuge and transfer the supernatant into a 5 mL microtube kept on ice.
13. Add 1 mL of elution buffer to tube containing the gel piece. Incubate for 1h at 18°C
(see Note 17 and Note 22) under shaking (500 rpm).
14. Briefly centrifuge and transfer the supernatant into the tube from step 12. Mix and
13
and add 1.5 mL of ethanol per tube (see Note 16). Vortex and incubate overnight at -20°C.
15. Centrifuge for 30 min at 20,000 g and discard supernatant. Add 500 µL of ice-cold
ethanol, vortex, and centrifuge for 15 min at 20,000 g. Discard supernatant.
16. Leave the microtubes open at room temperature (in a fume hood) until the pellets are
dry. Resuspend each pellet in 10µL of 1X helicase buffer (see Note 23).
17. Pool sample aliquots and determine hybrid concentration from absorbance at 260 nm,
neglecting the effect of oligonucleotide hybridization on the extinction coefficient: ε260nm = number of nucleotides (all strands) x 104 L/mol/cm.
18. Store hybrid solution at -20°C (see Note 24).
3.3. Helicase microplate assay
The following protocol has been developed with a Synergy H1FD instrument (Biotek) equipped with a temperature controller, two microinjectors, and 485/20 nm (excitation) and 530/25 nm (emission) filters for Alexa488 detection, but should be easily adapted to any similar fluorescent microplate reader.
1. Switch on the microplate reader and set the temperature chamber to 37°C. Program the
instrument method for the experiment at hand (see step 7 or step 16, below). Clean the microinjector circuits with 1 mL of ethanol and then 1mL of deionized RNase-free water.
2. Warm the 8X initiation mix and the 8X control mix in a dry bath set to 37°C before
loading each mix in separate injector reservoirs (see Note 25).
3. In a 1.5 mL microtube, prepare a 241 µL reaction mixture containing 5.8 nM
14
helicase buffer. Transfer 80 and 160 µL aliquots to two new microtubes (Samples 1 and 2) (see Note 27). Add 1.3 µL of 1X helicase buffer in Sample 1.
4. Prepare a 1400 nM dilution of the Rho enzyme stock in 1X helicase buffer (see Note
28). Add 2.6 µL of the Rho dilution to Sample 2.
5. Load 35µl sample aliquots in a defined order in the wells of a 384-well microplate. For
instance, load Sample 1 aliquots in wells 1 and 2 and Sample 2 aliquots in wells 3-6. In this way, each condition will be tested in duplicate in a single experiment.
6. Add 5 µL of 1X helicase buffer in wells 1 and 2 (‘no Rho’ control replicates).
7. Install the microplate in the instrument and run the following method (temperature set to
37°C throughout): shake (orbital) the microplate plate for 5 min at 180 rpm. Then, use microinjectors to dispense 5µL of 8X control mix in wells 3 and 4 (ADP control
replicates) and 5µL of 8X initiation mix in wells 5 and 6 (unwinding reaction replicates). Record Alexa488 fluorescence from each well every 20 s for at least 30 min (Figure
2A). Set the instrument to normalize fluorescence output I(t) according to:
𝐼(𝑡) =𝐼𝑡− 𝐼0 𝐼0
where It and I0 are, respectively, the fluorescence signals recorded at times t and 0. Also
set the instrument to average the replicate signals obtained for each condition (Figure
2B).
8. Repeat steps 1-7 several times, preferably on different days, to appreciate the experimental variation (Figure 2C) (see Note 29).
[Figure 2 near here]
The above protocol can also be used to assess the effect of drugs or cofactors on Rho helicase activity. The additional reagent can be added directly into the master mix (step 3
15
above) or in individual reaction samples. In the latter case, the protocol can be modified, as follows (example provided for testing the effect of the bicyclomycin [BCM] inhibitor):
9. Perform steps 1 and 2 above.
10. In a 1.5 mL microtube, prepare a 426 µL master mix containing 6.6 nM fluorescent
hybrid, and 525 nM unlabelled trap oligonucleotide in 1X reaction buffer. Transfer one 142 µL aliquot and four 71 µL aliquots to five 1.5 mL microtubes (Samples 3 to 7).
11. Add 18.6 µL of 1X helicase buffer to Sample 3.
12. From the BCM inhibitor stock, prepare two serial BCM dilutions in 1X helicase buffer.
Adjust dilutions to the concentration range to test (e.g. 1000 and 100 µM stock dilutions to obtain final BCM concentrations in samples of 100 and 10 µM, respectively).
13. Add 9.3 µL of one of the BCM serial dilutions to samples 4 and 5 and 9.3 µL of the
other serial dilution to samples 6 and 7.
14. Prepare a 1400 nM dilution of the Rho enzyme stock in 1X helicase buffer (see Note
28). Then, add 2.7 µL of Rho protein in sample 3 and 1.3 µL in samples 4 to 7.
15. Load 35µl sample aliquots in a defined order in the wells of a 384-well microplate. For
instance, load Sample 3 aliquots in wells 1 to 4 and Samples 4 to 7 in wells 5 to 12 (two wells per sample).
16. Install the microplate in the instrument and run the following method (temperature set to
37°C throughout): shake (orbital) the microplate plate for 5 min at 180 rpm. Then, use microinjectors to dispense 5µL of 8X control mix in wells 1 and 2 (ADP control replicates) and 5µL of 8X initiation mix in wells 3 to 12 (helicase reaction replicates). Record and report Alexa488 fluorescence for all wells as described in step 7, above.
17. Repeat steps 9-16 several times with distinct serial dilutions of BCM to cover the inhibitory concentration range adequately (Figure 3A).
16
18. Repeat the procedure over the full inhibitory concentration range to appreciate the experimental variation. With this procedure, we estimated an apparent IC50 of ~15 μM
(Figure 3A), which is in reasonable agreement with previous measurements performed with a more classical helicase assay (IC50 = 49 μM) [23].
3.4 Gel-shift assay
To verify that the development of the Alexa488 fluorescence signal observed with the multiplate assay truly derives from Rho helicase activity (the assay cannot distinguish Rho-directed RNA-DNA hybrid unwinding from unwanted side reactions such as RNA
degradation), one may control endpoint reaction products by PAGE (see Note 1). PAGE analysis may be performed occasionally (when problems are suspected; see Note 29) or on a more regular basis (as part of a quality control procedure). To facilitate data analysis,
experiments with a control RNA-DNA hybrid substrate devoid of Dabcyl (prepared by using Oligo4 instead of Oligo2 from Table 1; see section 3.2, step 1) may be performed in parallel (Figure 3B). [Figure 3 near here]
1. Prepare 0.5 mL microtubes (one per sample to be analyzed) containing 6 µL of 2X
quench buffer. To each tube, add 6 µL of the sample to be analyzed (see Note 30). For instance, a control “t0” sample may come from the Master mix of section 3.3, step 3 (slightly increasing the overall master mix volume to account for this aliquot
withdrawal) while other samples may correspond to end-point reaction aliquots taken from microplate wells after section 3.3, step 7. Store on ice.
2. Assemble PAGE gel plates as described in steps 12-13 of section 3.1 using 0.8 mm
spacers and a 15-teeth comb.
3. Mix 25 mL of 8% helicase PAGE solution with 60 µL of 25% APS and 60 µL of
17
4. Once the gel has polymerized, remove the comb and flush the wells with a 10 mL
syringe containing SDS run buffer. Install the gel into an electrophoresis unit and fill the top and bottom tanks with SDS run buffer. Set the power supply at 140V and perform a pre-electrophoresis run for 30 min. Turn off the power.
5. Flush gel wells with SDS run buffer and load samples from step 1. Also load 5µL of
control helicase buffer in a well-separated well (positions of the xylene cyanol and bromophenol blue dyes are used to assess gel migration) (see Note 31).
6. Run the gel at 140V until the xylene cyanol in the control sample is at ~5 cm from the
bottom of the wells (it takes ~1h).
7. Replace one of the glass plates with saran sheet. Scan the gel with a fluorescence imager
using settings adequate for detection of Alexa488 fluorescence (see Note 21).
4. Notes
1. Only PAGE analysis of helicase reaction products allows the precise calculation of substrate unwound fractions as function of time and the verification of the integrity of the substrate(s) and reaction products (an important point with fragile RNA components and the risk of degradation by chemicals, RNases, etc.). The fluorogenic assay presented herein should thus be considered as a complementary tool allowing much quicker, early-stage exploration of samples or conditions but not being necessarily suitable for the thorough, late-stage characterization of ‘hits’.
2. The DNA template is prepared by standard PCR amplification procedures [9] and can be purified with a commercial silica-based PCR purification kit.
3. DTT is used to prevent formation of disulfide bonds inhibiting T7 RNA polymerase but is not stable over time. We recommend using fresh transcription buffer or to supplement old batches with additional DTT.
18
4. The PAGE solutions can be prepared in advance or in larger volumes and stored for a few days at room temperature protected from light.
5. Oligonucleotides and hybrids bearing the Alexa488 moiety should be protected from light to limit risks of photobleaching. Dabcyl is a collisional quencher requiring close
molecular interaction (aromatic stacking) with the fluorophore; its quenching efficiency is not strongly wavelength-dependent.
6. Oligo3 is used as a “Trap” competitor in helicase reactions and should have the same sequence than the Alexa488-labeled Oligo1 oligonucleotide.
7. The composition of the helicase buffer may be varied but ionic strength should be sufficient (> 50 mM monovalent salt) to stabilize the RNA-DNA helices within the hybrid substrate.
8. BSA is used as a non-specific protein competitor and contributes to limit the potential adsorption of reactants to microtube walls.
9. We prefer black microplates for their higher signal to noise ratio. We like Corning 384-well microplates #3575 for their consistent, low protein and nucleic acid adsorption properties and for their suitable 20-80 µL working volume range.
10. Make sure that the microplate reader injectors and the microplate holding chamber are RNase-free. Use standard procedures or commercial RNase decontamination reagents to clean the instrument parts as well as surrounding working area if needed.
11. This step is optional but usually improves the yield of RNA transcripts.
12. The tube can be left open in a fume hood for a few minutes before proceeding to the next step (potential traces of ether will thus be eliminated by evaporation).
19
14. In a 6% denaturing gel, bromophenol blue migrates as a ~25 nt-long RNA strand while xylene cyanol dye migrates slightly slower than our standard 129-nt long RNA transcript (Figure 1B).
15. Use only UV-transparent plastic wrap (e.g. SaranTM wrap). Some commercial plastic
wraps contain UV absorbers that can perturb detection of RNA bands by UV-shadowing. 16. Precipitation can also be performed in 5 mL microtubes (dispatching 1.25 mL sample
and 3.75 mL ethanol per tube) if a high-speed bench centrifuge with an adequate rotor is available (e.g. Eppendorf 5425 centrifuge and FA-10X5 rotor). The hybrid substrate pellets are then more easily detected from their larger sizes and label-dependent colors (dark orange with the Alexa488-Dabcyl pair or yellowish with only Alexa488).
17. Incubation overnight at 4°C is an alternative option.
18. The hybrid substrates can also be purified on a 0.8 mm polyacrylamide gel using a larger volume (25mL) of acrylamide solution for gel preparation. However, elution from the gel band is less efficient and requires crushing of the gel band into small pieces as well as syringe filtration as in section 3.1, steps 20-23. Final yields are usually lower.
19. We use a comb with 1.5 cm wide teeth for our 0.4 mm wide gels and load sample volumes of 20 µL or less per well. The number of wells used per sample or the width of comb teeth (or gel width, but see Note 18) should be adjusted according to the case at hand.
20. For samples containing Alexa488, we prefer red indelible markers. To facilitate batch-to-batch comparisons, we mark the positions of the xylene cyanol and bromophenol blue dyes from the control sample whenever possible.
21. Detection settings will depend on the imaging system. In any case, make sure to use high-grade acrylamide and chemicals and to clean thoroughly the imaging system between scans (see manufacturer’s instructions) to limit background fluorescence.
20
22. Although the tripartite RNA-DNA hybrids are reasonably stable and do not
spontaneously dissociate under standard Rho helicase conditions (see sections 3.3 and 3.4), we prefer to use low temperatures (<20°C) for gel band elution.
23. The composition of the elution buffer can be adapted to suit downstream utilizations but should be of sufficient ionic strength to stabilize the RNA-DNA helices.
24. Always keep light-sensitive fluorescent samples in opaque, dedicated tubes or cover standard microtubes with aluminum foil.
25. We use the control mix injector to run control (ADP) samples alongside normal (ATP) samples. Alternatively, the control mix may contain a non-hydrolysable nucleotide (e.g. AMP-PNP) or no nucleotide at all.
26. Although experiments can be performed with a lower RNA-DNA hybrid concentration (~1 nM) with the Synergy H1FD instrument, the signal-to-noise ratio is significantly improved with 5 nM hybrid and more appropriate to subsequent analysis of the reaction end products by native PAGE, if needed (see section 3.4).
27. A 6-well experiment can be performed with a master mix of 241µL mix. The number of experiments that can be ran in parallel will depend on microplate reader performance, and experimenter needs. For continuous monitoring of helicase reaction kinetics, we usually do not perform more than two 6-well experiments at once with the Synergy H1FD instrument.
28. The Rho stock should be diluted ex tempore to limit enzymatic inactivation. All Rho concentrations are expressed in hexamers.
29. The fluorescence signals of the ‘no Rho’ and ADP control samples should be stable over time (a slight decrease due to photobleaching is acceptable) (Figure 1A). If that is not the case, you should check the integrity of the hybrid substrates using the helicase PAGE assay (section 3.4).
21
30. With our standard helicase buffer, a small precipitate of potassium dodecyl sulfate usually appears in the reaction aliquots. We do not eliminate this precipitate before loading the samples on the gel as it does not affect electrophoresis.
31. Fluorescence from the bromophenol blue and xylene cyanol dyes can obscure analysis of samples if the control lane is not far enough from sample gel lanes.
AKNOWLEDGMENTS
This work was supported by a PhD scholarship from Région Centre-Val de Loire to I.S., and by CNRS core funding and grant ANR-15-CE11-0024-02 from the French Agence Nationale de la Recherche to M.B. We gratefully acknowledge Annie Schwartz and Cédric Nadiras for helpful discussions, advice during the early stages of this project, and critical reading of this manuscript.
22
FIGURE LEGENDS
Figure 1: Preparation of the RNA-DNA hybrid substrates for the fluorogenic Rho helicase
assay. (A) Schematic of the 2-step protocol described in text. (B) Representative image of the UV-shadows observed upon UV illumination of the RNA preparative PAGE gel. (C)
Representative image obtained after Typhoon FLA9500 fluorescence imaging of a PAGE gel used for RNA-DNA hybrid substrate preparation.
Figure 2: Detection of Rho-directed RNA-DNA hybrid unwinding with the fluorescent
microplate assay. Data in grey, black, blue, and red correspond to samples without Rho, with Rho and ADP, with Rho and ATP, and with Rho, ATP, and 100 µM BCM, respectively. (A) Representative graph showing raw fluorescence traces obtained with sample replicates from the same experiment. (B) Graph showing the evolution of the averaged normalized
fluorescence signals as a function of time (see section 3.3, step 7). Data points were fitted to an equation describing biphasic kinetics (pseudo-first order burst followed by linear steady-state phase), as described previously [22,24]: 𝐹(𝑡) = 𝐴(1 − 𝑒𝑘𝑒𝑥𝑝 𝑡) + 𝑘
𝑙𝑖𝑛𝑡, where F(t) is
the fraction of unwound product, A is the amplitude of the exponential phase, and kexp and klin
are the rate constants of the exponential and linear phases respectively). (C) Box plot showing the distribution of normalized fluorescence intensities values recorded at t = 30 min (5 to 7 independent experiments per tested condition).
Figure 3: Inhibition of Rho helicase activity by BCM. (A) Graph showing BCM inhibition
“endpoint” data (taken after 30 min of helicase reaction) obtained with the fluorescence multiplate assay (section 3.3). The data points were fitted to a standard sigmoid inhibition equation: IBCM = (F0− Fmax ×
[BCM]n
[BCM]n+ [IC
23
intensity (at 30 min of reaction) as a function of BCM concentration, F0 is the fitted value of
IBCM at 0 µM BCM, Fmax is the maximal fraction of the signal that is sensitive to BCM, n is an
empirical parameter that defines the shape of sigmoid curve, and IC50 is the half-maximal
inhibitory concentration [23]. (B) Representative 8% PAGE gel showing Rho helicase reaction products obtained under different reaction conditions with a tripartite RNA-DNA hybrid substrate (Figure 1A) containing the unlabeled Oligo4 (less, left) or Dabcyl-labeled oligo2 (Dabcyl-plus, right) strand. Note that the presence of the Dabcyl quencher prevents fluorescence detection of the Dabcyl-plus RNA-DNA hybrid species in the gel.
24
REFERENCES
1. Boudvillain M, Figueroa-Bossi N, Bossi L (2013) Terminator still moving forward: expanding roles for Rho factor. Curr Opin Microbiol 16, 118-124
2. Ray-Soni A, Bellecourt MJ, Landick R (2016) Mechanisms of Bacterial Transcription Termination: All Good Things Must End. Annu Rev Biochem 85, 319-347
3. Roberts JW (2019) Mechanisms of Bacterial Transcription Termination. J Mol Biol,
4. Thomsen ND, Lawson MR, Witkowsky LB et al. (2016) Molecular mechanisms of substrate-controlled ring dynamics and substepping in a nucleic acid-dependent hexameric motor. Proc Natl
Acad Sci U S A 113, E7691-E7700
5. Thomsen ND, Berger JM (2009) Running in reverse: the structural basis for translocation polarity in hexameric helicases. Cell 139, 523-534
6. Richardson JP (1982) Activation of rho protein ATPase requires simultaneous interaction at two kinds of nucleic acid-binding sites. J Biol Chem 257, 5760-5766
7. Faus I, Richardson JP (1989) Thermodynamic and enzymological characterization of the interaction between transcription termination factor rho and lambda cro mRNA. Biochemistry 28, 3510-3517 8. Nadiras C, Delaleau M, Schwartz A et al. (2019) A Fluorogenic Assay To Monitor Rho-Dependent Termination of Transcription. Biochemistry 58, 865-874
9. Nadiras C, Schwartz A, Delaleau M et al. (2018) Evaluating the Effect of Small RNAs and Associated Chaperones on Rho-Dependent Termination of Transcription In Vitro. Methods Mol Biol 1737, 99-118 10. Zou LL, Richardson JP (1991) Enhancement of transcription termination factor rho activity with potassium glutamate. J Biol Chem 266, 10201-10209
11. Lau LF, Roberts JW, Wu R (1983) RNA polymerase pausing and transcript release at the lambda tR1 terminator in vitro. J Biol Chem 258, 9391-9397
12. Brennan CA, Dombroski AJ, Platt T (1987) Transcription termination factor rho is an RNA-DNA helicase. Cell 48, 945-952
13. D'Heygere F, Schwartz A, Coste F et al. (2015) Monitoring RNA Unwinding by the Transcription Termination Factor Rho from Mycobacterium tuberculosis. Methods Mol Biol 1259, 293-311
14. Boudvillain M, Walmacq C, Schwartz A et al. (2010) Simple enzymatic assays for the in vitro motor activity of transcription termination factor Rho from Escherichia coli. Methods Mol Biol 587, 137-154 15. Gocheva V, Le Gall A, Boudvillain M et al. (2015) Direct observation of the translocation
mechanism of transcription termination factor Rho. Nucleic Acids Res 43, 2367-2377
16. Steinmetz EJ, Platt T (1994) Evidence supporting a tethered tracking model for helicase activity of Escherichia coli Rho factor. Proc Natl Acad Sci U S A 91, 1401-1405
17. Schwartz A, Margeat E, Rahmouni AR et al. (2007) Transcription termination factor rho can displace streptavidin from biotinylated RNA. J Biol Chem 282, 31469-31476
18. Schwartz A, Rabhi M, Jacquinot F et al. (2009) A stepwise 2'-hydroxyl activation mechanism for the bacterial transcription termination factor Rho helicase. Nat Struct Mol Biol 16, 1309-1316 19. Soares E, Schwartz A, Nollmann M et al. (2014) The RNA-mediated, asymmetric ring regulatory mechanism of the transcription termination Rho helicase decrypted by time-resolved Nucleotide Analog Interference Probing (trNAIP). Nucleic Acids Res 42, 9270-9284
20. Schwartz A, Walmacq C, Rahmouni AR et al. (2007) Noncanonical interactions in the management of RNA structural blocks by the transcription termination rho helicase. Biochemistry 46, 9366-9379 21. Guerin M, Robichon N, Geiselmann J et al. (1998) A simple polypyrimidine repeat acts as an artificial Rho-dependent terminator in vivo and in vitro. Nucleic Acids Res 26, 4895-4900 22. Walmacq C, Rahmouni AR, Boudvillain M (2004) Influence of substrate composition on the helicase activity of transcription termination factor Rho: reduced processivity of Rho hexamers during unwinding of RNA-DNA hybrid regions. J Mol Biol 342, 403-420
23. D'Heygere F, Schwartz A, Coste F et al. (2015) ATP-dependent motor activity of the transcription termination factor Rho from Mycobacterium tuberculosis. Nucleic Acids Res 43, 6099-6111
25
24. Walstrom KM, Dozono JM, Robic S et al. (1997) Kinetics of the RNA-DNA helicase activity of Escherichia coli transcription termination factor rho. 1. Characterization and analysis of the reaction.
Biochemistry 36, 7980-7992
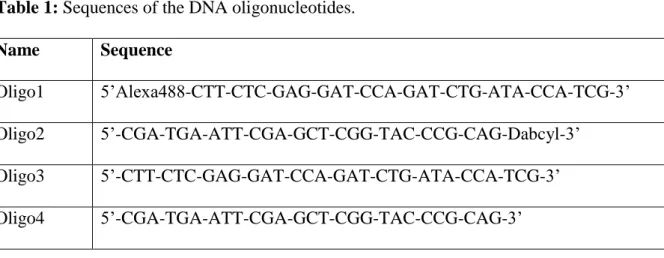
Table 1: Sequences of the DNA oligonucleotides.
Name Sequence
Oligo1 5’Alexa488-CTT-CTC-GAG-GAT-CCA-GAT-CTG-ATA-CCA-TCG-3’
Oligo2 5’-CGA-TGA-ATT-CGA-GCT-CGG-TAC-CCG-CAG-Dabcyl-3’
Oligo3 5’-CTT-CTC-GAG-GAT-CCA-GAT-CTG-ATA-CCA-TCG-3’
DNA template: +1 5’ RNA transcript: 5’ Alexa488 Dabcyl
Tripartite RNA-DNA hybrid:
72 nt 30 bp 27 bp Transcription Hybridization
a
reporter cassette T7 prom.b
Correct 3-piece substrate - Dabcyl Alexa488-labelled Oligo1 Pen mark Rut site 5’- GGACTTCTCCTCTGTCTCCTTCTTCCTTCTCCTCTGTCTCCTTCTTCC-3’ 10 20 30 40 Xylene cyanol RNA samplec
RNA shadow 5’ Control + Dabcyl Pen mark 2-piece hybrid(I-I
0
)/I0
signal
Time (min) ATP ADP ATP+ BCM ATP
b
c
0 1 2 3 4 0 10 20 30 0 1 2 3 4 (I-I0 )/I0 signal -Rho +Rho 0 2000 4000 6000 8000 0 10 20 30 Fluorescence (au) Time (min)a
Relative fl uo re sc en ce in te ns ity [BCM] (µM) 0 0.2 0.4 0.6 0.8 1 1 10 100 1000
a
RNA-DNA hybrid ADP ATP +BCMATP ADP ATP +BCMATPDabcyl-less substrate (min) 0 30 0 30 0 30 0 30 0 30 0 30 90°C