Publisher’s version / Version de l'éditeur:
Energy and Buildings, 38, July 7, pp. 824-835, 2006-07-01
READ THESE TERMS AND CONDITIONS CAREFULLY BEFORE USING THIS WEBSITE.
https://nrc-publications.canada.ca/eng/copyright
Vous avez des questions? Nous pouvons vous aider. Pour communiquer directement avec un auteur, consultez la
première page de la revue dans laquelle son article a été publié afin de trouver ses coordonnées. Si vous n’arrivez pas à les repérer, communiquez avec nous à PublicationsArchive-ArchivesPublications@nrc-cnrc.gc.ca.
Questions? Contact the NRC Publications Archive team at
PublicationsArchive-ArchivesPublications@nrc-cnrc.gc.ca. If you wish to email the authors directly, please see the first page of the publication for their contact information.
NRC Publications Archive
Archives des publications du CNRC
This publication could be one of several versions: author’s original, accepted manuscript or the publisher’s version. / La version de cette publication peut être l’une des suivantes : la version prépublication de l’auteur, la version acceptée du manuscrit ou la version de l’éditeur.
For the publisher’s version, please access the DOI link below./ Pour consulter la version de l’éditeur, utilisez le lien DOI ci-dessous.
https://doi.org/10.1016/j.enbuild.2006.03.012
Access and use of this website and the material on it are subject to the Terms and Conditions set forth at
Findings from a survey on the current use of daylight simulations in building design
Reinhart, C. F.; Fitz, A.
https://publications-cnrc.canada.ca/fra/droits
L’accès à ce site Web et l’utilisation de son contenu sont assujettis aux conditions présentées dans le site LISEZ CES CONDITIONS ATTENTIVEMENT AVANT D’UTILISER CE SITE WEB.
NRC Publications Record / Notice d'Archives des publications de CNRC: https://nrc-publications.canada.ca/eng/view/object/?id=92c05fe4-500b-47d0-9203-fb223b82c930 https://publications-cnrc.canada.ca/fra/voir/objet/?id=92c05fe4-500b-47d0-9203-fb223b82c930
http://irc.nrc-cnrc.gc.ca
Findings from a sur ve y on t he c ur re nt
use of da ylight sim ulat ions in building
de sign
N R C C - 4 7 7 0 2
R e i n h a r t , C . ; F i t z , A .
A version of this paper is published in / Une version de ce document se trouve dans: Energy and Buildings, v. 38, no. 7, July 2006, pp. 824-835 doi:10.1016/j.enbuild.2006.03.012
FINDINGS FROM A SURVEY ON THE CURRENT USE OF DAYLIGHT SIMULATIONS IN BUILDING DESIGN
Christoph Reinhart*, Annegret Fitz Institute for Research in Construction
National Research Council Canada, Ottawa K1A 0R6, Canada
ABSTRACT
This paper presents findings from a web-based survey on the current use of daylight simulations in building design. The survey was administered from December 2nd 2003 to January 19th 2004. 185 individuals from 27 countries completed the survey. The majority of respondents worked in Canada (20%), the United States (20%), and Germany (12%). Most participants were recruited through building simulation mailing lists. Their self-reported professions ranged from energy consultants and engineers (38%) to architects and lighting designers (31%) as well as researchers (23%). They worked predominantly on large and small offices and schools.
91% of respondents included daylighting aspects in their building design. Those who did not consider daylighting blamed lack of information and unwillingness of clients to pay for this extra service. Among those participants who were considering daylighting 79% used computer simulations. This strong sample bias towards computer simulations reflects that many participants had been recruited through building simulation mailing lists. Participants named tools’ complexity and insufficient program documentation as weaknesses of existing programs. Self-training was the most common training method for daylight simulation tools. Tool usage was significantly higher during design development than during schematic design. Most survey participants used daylighting software for parameter studies and presented the results to their clients as a basis for design decisions.
While daylight factor and interior illuminances were the most commonly calculated simulation outputs, shading type and control were the most common design aspects influenced by a daylighting analysis. The use of scale model measurements had rapidly fallen compared to a 1994 survey, whereas trust in the reliability of daylighting tools has risen. While participants named a total of 42 different daylight simulation programs that they routinely used, over 50% of program selections were for tools that use the RADIANCE simulation engine, revealing the program’s predominance within the daylight simulation community.
keywords: daylight simulations, RADIANCE, online survey
1. INTRODUCTION
In a rapidly changing world, design professionals rely more than ever on solid performance measures to support their design decisions. The role of computerized building design tools is to provide such information efficiently. Given the breadth of choices and concerns that a design team is confronted with, various design aspects constantly compete for the team’s attention. To remain competitive, design professionals must weigh the value of information gained through any one simulation tool against the invested time and financial resources, as well as against the value of comparable information that might be gained through the use of other or no tools. Because daylighting is a declared design feature of
*
virtually all “sustainable/green” buildings, and because it is difficult to evaluate its quality and quantity in a space through simple rules of thumb, daylighting software should have a high rate of acceptance and adoption within the market. This is the underlying notion for the development of daylight simulation tools.
The research described in this paper was motivated by the authors’ observation that despite the availability of simplified and detailed daylight simulation methods, none of these tools has yet penetrated the building design market to any great degree. The objective of this study therefore was to identify weaknesses of existing daylighting design software packages, better understand design practitioners’ needs, and accordingly provide guidance to software developers. The paper presents a review of previous surveys on the use of building simulation software followed by the findings of a web-based survey that particularly concentrated on daylight simulation software.
This work was carried out within the context of the International Energy Agency’s (IEA) research project ‘Task 31: Daylighting Buildings in the 21st Century’1. The project’s overall objective was to foster the use of daylight in commercial buildings through a better understanding of occupant needs’, more integrated lighting and shading controls, and improved daylighting design software. This study contributed to the latter work package.
2. REVIEW OF PREVIOUS SURVEYS
A number of surveys have been carried out in the past that were concerned with the use of building simulation tools during building design as well as barriers that prevent their wider usage.
In a 1985 survey of Japanese engineering firms Matsuo summarized some key requirements for building energy simulation tools to become widely used2. These requirements were moderate software costs, detailed user manuals, and default values for non standard data inputs. Matsuo provided no information of how many engineering firms were involved in the survey and how it was administered2.
In the same year Mason presented an overview on the usage of building simulation software in Australia and New Zealand3. The paper stated that the main barriers against a wider usage of such tools in these countries were the complexity of existing tools, missing front ends and inflexible simulation outputs. At that time the Australian and New Zealand building service community lacked the required computing skills, and trust in existing programs was low due to insufficient validation data. Mason did not report what methodology was used to compile this list of barriers.
In 1994 Aizlewood and Littlefair administered a mail-in survey that was concerned with the use of daylight prediction methods4. The survey was sent out to 323 UK designers and resulted in 64 valid responses from 33 architects, 9 local government officers, and 22 daylighting specialists. Over 50% of respondents carried out “site layout calculations” (shading analysis due to neighboring buildings). In the case of the architects, these calculations were made using simple formulas whereas 77% of daylighting specialists used scale models and/or computer simulations. Required improvements of daylight simulation tools were comparable to those expressed earlier for building simulation software, e.g. lower tool costs, ease of use, links to CAD programs, default input values, and better help file systems. A number of users expressed doubts as to how reliable existing programs actually were.
In 1996 Robinson administered a survey on the use of simplified versus detailed building energy performance simulation tools in professional design practice5. The survey was distributed to international consulting model subscription lists and yielded 69 valid
responses (including 12 architects and 22 engineers). The collected data suggested a tendency of engineers to use more detailed tools whereas surveyed architects preferred simplified tools. Both groups believed their simulation errors to be minimal, which was interpreted by Robinson as an indication that model validation had matured at that point. Surprisingly, detailed and simplified tools were reported to be used at similar stages in the design process, a finding that went against common belief that simplified tools are synonymous with pre-design tools whereas detailed tools are used at more mature design stages.
Also in 1996 Donn carried out a telephone and mail survey of 44 building simulation consultants in the United States and 80 developers, engineers, architects, and building designers in New Zealand6. The objective of the survey was to identify what criteria would make building simulation software “easier to use”. The questionnaire addressed issues such as desired improvements of existing tools, what training users got, and how they used the tools. Over 50% of US participants had received some training in the use of building simulation programs including initial help from a colleague. A third had actually attended a course. In contrast only 30% of New Zealand participants had received any training and only 10% had attended a course. Over 50% of US respondents regularly carried out parameter studies to demonstrate energy consequences of a design measure to clients. Improved interfaces, better documentation, better links to CAD software, customized defaults, and self checking routines were named as desired tool improvements. Quality control was a concern even though none of the surveyed professionals had any formalized quality assurance procedure in place.
In a follow up survey Donn collected responses from 56 New Zealand architects and 20 energy consultants7. The survey suggested that main barriers against the wider usage of design decision tools were: long learning curves due to the tools’ complexity, uncertainty about the accuracy of simulation results, time-consuming 3D model preparation and simulation times, and the absence of conclusive performance measures. As a consequence, the surveyed architects did not usually use design decision tools at all during schematic design and only rarely later in the design process.
De Wilde, Augenbroe and van der Voorden interviewed architects and building simulation consultants of two energy-efficient Dutch office buildings8. The focus of the interviews was on “understanding the decision moment concerning energy saving components with or without the intervention of the simulation consultant”8. The interviews revealed that energy-efficiency measures were often selected during schematic design based on experience from previous work and reference projects. Computational tools tended to be consulted at a later stage, not so much to support design choices for any particular technology, but rather for design optimization and verification after a technology had already been chosen. In a later study the authors administered a questionnaire to Dutch architects and energy consultants9. The questionnaires were different for architects and consultants and included multiple choice and open questions. 34 architects and 18 consultants returned valid responses. Most architects indicated that they did not use any simulation tools to select energy saving components but rather checklists and handbooks. Consultants also influenced the selection of technologies based on experience. Both groups agreed that the selection process mostly took place during schematic design.
In 1998 Lam, Wong and Henry conducted a survey on the usage of performance-based building simulation tools in Singapore10. The objective of the survey was to develop a better understanding of the extent to which these tools were used in Singapore as well as to identify barriers towards their wider adaptation. Within a one-month data collection period self-administrated questionnaires were mailed out to 584 firms in Singapore. 164 valid responses were returned. The survey showed that “daylighting and electric lighting software” was used by 25% of the surveyed engineering firms as opposed to 11% for the architectural firms. The latter group was mainly using rendering software for presentational purposes without further
reference to electric lighting or daylighting. The engineers mainly used software supplied by lighting manufacturers. Participants generally shared the notion that “daylighting software [such as RADIANCE11 and Lightscape12] should be used by specialists”10. For those who used lighting software the frequency of usage did not vary between schematic design and design development. A key reason for survey participants to use building performance software was a higher confidence in a design as a result of the simulations. The main reason for not using simulations tools was lack of client interest. Other reasons were lack of staff with the required skills, time constraints, and high software purchasing and maintenance costs.
In a recent study, Pilgrim, Bouchlaghem, Loveday and Holmes conducted an online survey for architects and engineers to identify remaining barriers to the use of simulation tools in the construction industry13. The survey web page was advertised to members of the Chartered Institution of Building Services Engineers and the Royal Institute of British Architects. 62 valid responses of all four survey sections were collected, mostly from HVAC engineers (46%) and structural engineers (40%). Participants thought that the lack of training opportunities, missing demand by clients, and the complexity of building simulation tools hinder their more widespread use. In agreement with De Wilde et al.’s observations, tools were mostly used for optimization and sizing of the building and its components. 25% of respondents used tools to confirm code compliance. 70% had taught themselves how to use the programs.
In six follow up interviews with building services engineers, Pilgrim et al. found that model validation was considered to be the most time consuming part of the simulation. Validation exercises ranged from reviewing input parameters to sensitivity studies. Participants expressed a need for tools to facilitate quality assurance procedures.
Two recent surveys were explicitly dedicated to the use of lighting simulation tools in building design:
Mamaari administered a survey on lighting simulation tools at the Light and Building 2002 fair in Frankfurt, Germany14. The survey aimed to define software-related needs of users in order to make this information available to software developers. 10 questionnaires consisting of 43 questions each were completed. The length of the questionnaire as well as the observation that many questions were not of interest to the surveyed audience were identified as the main reasons for this low response rate.
A working group of the Architectural Institute of Japan surveyed researchers, software developers and users of lighting simulation tools. The paper questionnaire consisted of three pages and 17 responses were collected. Again participants seemed to have had difficulties understanding the intent of the questions so that the knowledge gained through the survey was limiteda.
Summing up, previous surveys on the use of building simulation software were capable of identifying general trends and needs in the design community. Some requirements such as better software documentation and training opportunities have been high priorities for users since day one2,3. This is not surprising as self-learning remains the single most common training method for the users of tools today. Initial concerns regarding software costs and accuracy seem to be fading, probably as a result of government agencies providing free programs and researchers publishing real-world validation studies of building simulation engines. Simplified user interfaces with limited simulation capabilities but more ‘quality control’ over simulation input have been developed to satisfy the need for ‘easier-to-use’ programs. These simplified user interfaces are finally being used at least by some architects in addition to guidelines and handbooks5,7,9. On the other hand, the observed trend that
a
simplified, “early design” tools commonly end up being used at all design stages10 should prompt developers to clearly state the tools’ capabilities and limitations. Detailed simulation tools remain the domain of engineers. Quality assurance and consistency analysis of simulation input and output remain a concern for software users13.
Lighting simulation software is less frequently used by architects or engineers than other building simulation software. If used at all, engineers tend to concentrate on electric lighting manufacturer’s software while architects use rendering tools10. Physically-based daylight simulations still have the reputation of being somewhat exotic endeavours of the odd specialist. The latter finding confirms the subjective observation on which this research was originally based. It further reveals a surprising mismatch between an active daylight simulation research community (simulation engines such as RADIANCE have been available for over 15 years15 and their output and capabilities are constantly expanded) and the professional building design community which largely ignores these efforts.
3. DAYLIGHTING SURVEY
Based on the sobering low response rate of previous paper-based surveys on the use of daylight simulation tools, the authors decided to collect information through an online survey. The advantages of administering an survey online were:
• An online survey could be effectively distributed to a large number of design professionals worldwide, allowing the authors to build upon a network of national contacts from IEA Task 31 members.
• Paper, postage and printing costs, as well as survey administration time were reduced compared to mail surveys13. Results were readily available in electronic form for further analysis.
• One apparent difficulty of previous paper-based surveys on lighting simulation tools was that participants were sometimes daunted by the questionnaires14. An online survey could engage respondents, provide follow-up questions depending on answers (branching) and check for completeness of answers. Another benefit of branching was that it substantially reduced the length of the survey and therefore increased the number of valid responses.
On the flip side, the information one can derive from online surveys is limited compared to personal interviews. Even though branched online surveys emulate a basic conversation, they can only address very general issues and necessitate that the survey administrator can accurately ‘predict’ beforehand how participants are likely to respond. If multiple choice answers are phrased too limited or static, the survey might fail to understand the real meanings of some of the answers provided. Open ended questions or comment boxes partly reduce this risk by giving participants the opportunity to share or clarify their opinions.
The questionnaire focused on design practitioners who integrate daylighting in their building design. It aimed at understanding the barriers that prevent design professionals from using daylighting simulation software and understanding the process for those who do. To ensure the clarity and relevance of the questionnaire, the authors set up an online test version and requested comments and suggestions from peer IEA and NRC researchers. Based on the feedback, the questionnaire was revised and a final version was approved by the Ottawa Research Ethics Board of the National Research Council Canada as Protocol 2003-31. Data collected during the development phase was discarded before the main data collection phase.
The final questionnaire was created and administered using the Halogen eSurveyor software16 in combination with an Oracle database. It included four question types: multiple selections of specific categories, a single selection of a specific category, pull-down menus, and free text. Multiple selection questions usually included a textbox in which participants
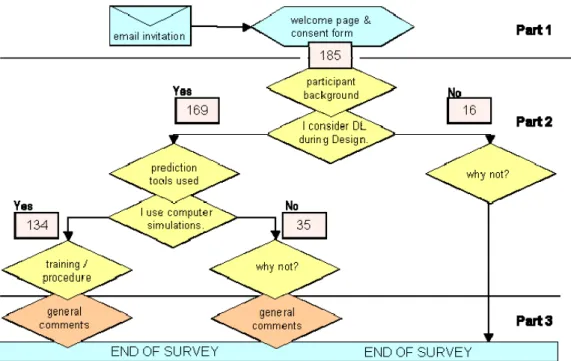
could provide information beyond pre-defined answers. The whole questionnaire was divided into three parts (Figure 1):
• A welcome web page explained the objective of the survey, informed potential participants of their rights to end their participation at any time and for any reason, and requested them to consent to the survey conditions. Incentive for individuals to participate in the survey was their “opportunity to influence future developments of daylight simulation tools”.
• Once individuals had consented to participate in the survey, the questionnaire began with some general inquiries concerning participants’ profession, types of projects they work on, and the country in which these projects are located. The first branching separated those participants who consider daylighting during their design from those who do not. For the latter, questions were geared towards understanding the reasons for not considering daylighting. Those considering daylighting were asked which tools they routinely used to implement daylighting, ranging from experience from previous projects to guidelines, spreadsheets, computer simulations, and scale model measurements. Follow up questions were provided that inquired which exact documents/methods were used by participants. The second branching separated those who do use daylighting simulation tools from those who do not. For the latter, a series of questions followed that aimed at understanding the barriers against using these tools. The former group was asked which tools they use, how they were trained, what quantities they usually calculated, which design criteria they applied and which building design aspects were directly affected by their daylighting analysis. Depending on the answers given, the questionnaire varied in length from 6 to 22 questions.
• At the end of the survey participants who consider daylighting during design were invited to provide their thoughts on what should be done to enhance the use of daylighting in buildings.
Participants were recruited through email invitations to selected mailing lists as well as to contact architects and consultants known to IEA Task 31 members. Noteworthy mailing lists that generated a high response rate were BLDG-SIMb (users of building energy simulation programs); RADIANCE Onlinec (RADIANCE users), and e-bulletins to the Ontario Association of Architects and the Royal Architectural Institute of Canada. Email invitations were further sent to registered users of a number of software packages including ADELINE, DAYSIM, ECOTECT, and SKYVISION. IEA Task 31 researchers were discouraged to participate in the survey to avoid any further bias in the responses. The authors are aware that the resulting survey sample had a strong bias towards users of building simulation software and can accordingly not readily be extrapolated to the building design community at large.
b
BLDG-SIM@gard.com (last accessed January 2006) c
Figure 1: Overview of the survey. Depending on their responses, participants followed one of three main branches: Consider daylighting (DL) during design and use computer simulations (CS); Consider DL but do not use CS; do not consider DL. The numbers in the rectangular boxes correspond to the number of participants that went through a particular survey branch.
4. SURVEY FINDINGS
Data collection lasted from Dec 2nd 2003 to Jan 19th 2004. A total of 193 individuals participated in the survey. 185 individuals completed the survey whereas 8 individuals chose to end their participation (close their web browser) somewhere along the way. Only the 185 valid responses were considered in the following analysis.
What information can be extracted from the collected data? As in Pilgrim’s earlier study, “the questionnaire is based on an open sample, and as such the results cannot be proven to be representative of any given population”13. But with nearly 200 responses collected, “patterns can be identified and cross-discipline analysis is possible”13.
Participants’ Background
Table 1 shows the professions participants chose from eight available categories. For the following analysis, these eight categories were reorganized into three professional groups,
designers, engineers and researchers. This simplified division was introduced to detect any
occupational differences in the use of daylighting design tools.
Table 1: Professions of participants.
Profession Professional Group
architect 33
lighting designer 19 designer 58 (31%) interior designer 1
energy consultant 22 engineer 71 (38%) engineer 39
researcher 39 researcher 43 (23%)
manufacturer 5 other 13 (8%)
other 27
Architects, interior designers, and lighting designers were binned into the designer group. Engineers corresponded to participants who chose “engineers” or “energy consultants” as their profession. Finally, researchers consisted of scientists and academics. Responses provided by the latter group was interpreted as indicators where future design practice might go. Selected individuals of the original “other” category could be binned under the three professional groups so that the regrouping resulted in 31% designers, 38% engineers, and 23% researchers (Table 1). Designers and engineers were the focus group for this survey since they provided first hand experience on the current use of daylight simulations during building design. Participants, that did not fall into any of the three professional groups, were excluded whenever cross-discipline aspects were investigated.
Respondents indicated that their projects were mostly located in 27 countries across the globe. The majority of respondents worked in Canada (20%) the United Stated (20%) and Germany (12%). Other countries with a relatively high number of participants were the UK (6%), Sweden (6%), Brazil (4%), Switzerland (4%), and Japan (3%).
Figure 2 shows that participants mostly worked on small and large office buildings as well as schools. This finding is not surprising, considering that energy savings from daylighting are most significant in building types in which (a) the times of occupancy and daylight availability largely coincide and (b) electric lighting makes up a significant proportion of the total energy use.
Figure 2: Buildings types participants mostly worked on.
Do you consider daylighting aspects during building design?
At the first main branching 169 participants (91%) responded that they do include daylighting aspects in their design (Figure 1). Again, this response is not surprising given that the survey specifically invited participants to comment on their use daylight simulations during building design.
Participants that did not include daylight aspects in their building designs.
Those few participants (16) who did not include daylighting into their design were asked to explain why not. They were given selections of predefined answers and free text fields. Six respondents were simply not involved in lighting or daylighting design. Three respondents carried out electric lighting computer simulations but stated that clients would
not pay for any daylighting analysis. Three others (all Engineers) did not know where to get the required information.
What kind of daylight prediction tools do you use?
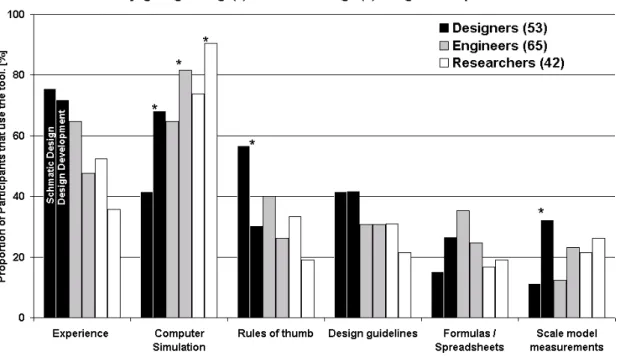
Those 91% of respondents that did consider daylighting during design were asked what prediction tools they routinely used during schematic design and design development. Options ranged from experience from previous work, design guidelines, rules of thumb, and formulas/spreadsheets, to computer simulations and scale model measurements. Participants could choose more than one prediction tool.
Figure 3 shows participants’ choices ordered by professional group. For each professional group and prediction tool two values are shown reflecting percentages of usage during schematic design and design development. The figure reveals that experience from previous design and daylight simulation tools were the overall prediction methods of choice. 135 individuals responded that they used computer simulation tools corresponding to 79% of all respondents who consider daylighting during building design. This strong sample bias towards the use of simulation tools reflects the participant recruitment process and that the survey was explicitly focusing “on the use of daylight simulations during building design”. Occupational differences followed the trends one would expect. The strongest cross-discipline differences existed for computer simulations. As in previous studies, engineers were more likely to use these tools than designers. On the flipside, designers more heavily relied on experience from previous work and rules of thumb than the other two groups7,9. The overall use of scale model measurements and spreadsheets was low, which again might be a consequence of the sample’s bias towards computer simulations.
Figure 3: Participants’ responses ordered by professional group. The two values for each professional group within each category indicate the responses for schematic design and design development. Value pairs that are marked with a star (*) are significantly different (Chi2 test p<0.05).
A star (*) in Figure 3 above a pair of columns for schematic design and design development indicates that the Chi2 test yielded that the two responses were significantly different (p<0.05). All three professional groups were significantly more likely to use computer simulations during later design stages (Designers Х2(1)=7.46*,p<0.01; Engineers Х2(1)=4.73*
,p<0.05; Researchers Х2(1)=3.98*,p<0.05). This finding reproduces de Wilde et
al.’s results for building simulation software in general9. Trust in rules of thumb significantly fell for designers during design development (Х2(1)=7.53*,p<0.01), indicating that this was the time when they required additional input through computer simulations. Scale models were rarely used. If used at all, they were significantly more likely to be used by designers during design development than during schematic design (Х2(1)=6.72*,p<0.01).
Depending on participant’s choices of prediction tools, follow up questions were provided. • Rules of Thumb: 69 textbox entries were completed with regards to what rules of
thumb participants used. Nearly 50% of all entries were related to how deep daylight can penetrate into a building through a vertical window. Other rules of thumb mentioned were preventing glare, high reflectance of surrounding surfaces, minimize east-west glazings, and the ratio of window area to floor area.
• Design Guides: The design guide or guides used by participants seemed to be mostly influenced by the country in which individuals worked: Over half of all participating Canadians and Americans who did use a design guide used the IESNA Lighting Handbook17. 35% of Canadians and 69% of Americans used the LBNL “Tips for Daylighting”18 document. Similarly, the Germans used the relevant German DIN Norms, DIN 503419 and DIN EN 1246420. UK participants used the CIBSE Guide A: Environmental Design21 (71%) along with the two North American documents mentioned above.
• Formulas/Spreadsheet: 56 respondents used formulas and spreadsheets as prediction tools in schematic design and design development. 28 individuals indicated that they used the Lumen Method from the IESNA handbook17, 4 used the split flux method, and 11 used their own internal methods. Another group of 10 participants further indicated that they used the Microsoft Excel template SkyCalc 22.
Participants that considered daylighting but did not use computer simulations tools.
Only 35 individuals indicated that they considered daylight but did not use computer simulation tools. Among these 35 individuals were only 2 researchers.
Figure 4 shows the reasons 17 designers and 12 engineers provided for not using daylight computer simulation tools. Primary reasons quoted were that they did not know which tools to use. This might be an indication that tool developers do still not sufficiently promote their tools within the design community. Other reasons quoted confirmed previous findings, i.e. lacking staff skills, unwillingness of clients to pay for the service, and long training times7. The only major difference between responses by designers and engineers was that 50% of the latter found tools too expensive. This might be an artifact arising from the small sample size of only twelve engineers. Only one individual expressed doubts as to whether current tools are reliable and meet practitioners’ needs. This is a very encouraging result for the developers of daylight simulation tools. It shows that –as for overall building simulation software– model validation has matured to a point at which overall trust in the capability of tools to yield correct results is high.
Figure 4: Responses given by 17 designers and 12 engineers why they were not using daylight simulation tools. Participants that do use computer Simulations tools.
The 134 participants that used computer simulation tools for daylighting design were asked to specify which exact tools they were using. They could pick one or more out of 19 widely used programs or manually specify other programs. Together with the other programs mentioned participants used a total of 42 different daylight simulation programs. This reveals how divided the daylight simulation developers community is. On the other hand, out of the 342 selections that were given for 42 daylight simulation tools, 138 selections were made for programs that exclusively use the RADIANCE backward raytracing simulation engine and 38 selections were made for tools that offer the usage of the RADIANCE engine together with other engines. In other words, over 50% of selections made were for RADIANCE-based tools. This reveals that despite the widely lamented7 complexity of the RADIANCE program, it is the design tool of choice for the majority of design professionals that use computer simulations.
Methods of training
Users of computer simulation software were asked which method of training they commonly use. Figure 5 shows the results for this survey together with findings from Pilgrim’s13 and Donn’s6 studies. Direct comparison of study results is difficult as questions might have been phrased differently in Donn’s study, and Pilgrim’s survey participants chose one training method only. Despite of these caveats, Figure 6 reveals that self-learning using program documentation has consistently been rated as the most common training methods for designers and engineers alike. This finding underlines the significance of program documentation and reiterates users’ calls for better help menus and documentation. Other training methods that were mentioned in free-text entries were the ADELINE telephone support line and online mailing lists.
Help from colleagues was more common in design than in engineering firms. There was no clear pattern in the attendance rate of formal training courses: While over 50% of designers had enjoyed some kind of formal training, the percentages for engineers were 3%,
22%, and 30% in Pilgrim’s, this, and Donn’s studies respectively. Donn found that less than 10% of New Zealand design professionals had attended a course compared to 30% of US consultants. These numbers hint that the rate of users receiving formal training depends on the existence of a local educational infrastructure.
Figure 5: Responses given by 35 designers and 53 engineers as to which method of training they primarily used. The data from this survey is complemented with data from Donn’s and Pilgrim’s studies.
Figure 6: Responses given by 35 designers and 53 engineers which outputs they produced using computer simulation programs.
Simulation Output
Figure 6 shows what output the three professional groups produced using daylight simulation programs. Interior illuminances under selected sky conditions and daylight factors were the frontrunners, being calculated by 65% to 77% of participants in all professional groups. This finding is not surprising as (a) these quantities can be directly calculated by most contemporary daylighting analysis tools, and (b) codes and guidelines tend to provide
minimum thresholds for these quantities. Therefore, performance evaluation becomes straightforward and design decisions can be based on these performance indices. Photo realistic images, interior luminances under selected sky conditions, and electric lighting use were also calculated by at least 49% of participants in all groups. Over a third of participants calculated glare indices.
The largest professional discrepancy existed in the frequency of daylight autonomy calculations (41% researcher compared to 17% engineers and 27% designers). Daylight autonomy is a relatively new, dynamic daylight performance metric, i.e. it is based on annual time series of indoor illuminances. It is defined as the percentage of the occupied times during the year when a minimum illuminance level is maintained at a work place by daylight alone23. Refinements to the method included the introduction of a manual blind control model to yield more accurate predictions of the annual daylight availability in a building24. Since this survey has been carried out, several other dynamic daylight performance metrics have been introduced25. The advantage of dynamic metrics over the static daylight factor is that they take local climate, facade orientation, and occupancy patterns into account. On the flip side, they are more difficult to calculate than the daylight factor as they are based on interior daylighting levels under a variety of different sky conditions.
In a follow-up question participants were asked how they were using the simulation outputs from Figure 6. While 94% of participants carried out comparative studies between different building design options only 33% used absolute values provided by the programs (Table 2). 74% included simulation results into client reports but only 39% used them to convince their clients of a specific design solution.
Table 2: How do you use those simulation outputs?
I use simulation results for comparative studies between different building design variants. 94% I use absolute values provided by the programs (e.g. to demonstrate code compliance). 33% I present them to clients in reports/presentations. 74% I use them to convince investors of a specific design solution. 39%
I use them to apply for incentive programs. 14%
In a second follow-up question those 92 participants that presented their simulation results to their clients were asked what they think their clients did with the results. 83% indicated that their clients “try to understand the underlying implications for the building” as opposed to 12% that stated that the “clients are not too interested in the underlying implications for the building”.
The last two answers combined reveal that instead of trying to convince clients of a particular design solution, the majority of participants surveyed tended to present their finding to their clients and let them choose a design option. This finding is in line with Donn’s study in which over 50% of US consultants regularly carried out parameter studies to demonstrate the energy consequences of a design measure to clients6.
One participant noted that payback period of lighting controls; as well as glare and contrast information were key decision criteria for clients. Another participant described an interactive process during which the client (designer) modified the design to reach a desired daylight factor distribution (calculated by the consultant).
57% of participants further indicated that clients “valued visualizations of design mostly for their aesthetic merit”. Lam’s earlier result10, that designers tend to use rendering software while and engineers use lighting manufacturer’s software, could not be reproduced in this survey.
Design aspects that are influenced by daylighting analysis?
All 169 participants (Figure 1) that considered daylighting during building design were asked what design aspects are influenced by their daylighting analysis (Figure 7). Shading type and control were the number one design aspects that were influenced by the daylighting analysis for all three professional groups followed by window size, glazing type and the choice of lighting controls. Building orientation, interior surface properties, and room dimensions followed. Designers gave the highest response rates in all categories showing that they are more involved in the design decision process than the two other groups.
Figure 7: Responses given by 53 designers, 65 engineers, and 42 researchers which buildings design aspects were usually affected by their daylighting analysis.
It might seem odd that fundamental design aspects such as building orientation and room dimensions were less frequently influenced by a daylighting analysis than shading and glazing type. The reason for this response pattern might be that decisions regarding orientation and building massing tend to be largely predefined by existing site conditions and client expectations. Thus they tend to be decided during schematic design when the designer still follows rules of thumb and experience from previous work (Figure 3). It is only later in the design process, when it comes to choosing shading controls, window size and glazing types, that there is time for a dedicated daylighting analysis. This interpretation of Figure 7 is consistent with de Wilde et al.’s and Pilgrim et al.’s observations9,13, that simulation tools tend to be used for sizing and optimization (in this case of facade/roof openings) rather than for the selection of a technology (a window/skylight for daylighting).
The 119 people who chose shading type and control as a design aspect influenced by their daylight analysis were offered a text box to enter specific shading design criteria they used. Responses ranged from just “blinds” as the do-it-all solution, to detailed considerations of the interplay of thermal loads, admitting daylight, avoiding glare, and the need of a view. “Appearance” was also regularly quoted as an important shading design criteria.
For museums, a common design criteria for the shading type and control was the predicted annual light exposure of the art work. In offices, an overall theme was the avoidance of direct glare but the different criteria quoted were less coherent than the rules of thumb used for maximum room depths. There seems to be a need for clear design guidelines describing how to choose appropriate shading systems in office buildings. One US architect summarized current practice as “common sense is the primary criteria [for choosing a shading type] together with an analysis of the heating consequences”.
General Comments
The final survey screen invited participants to comment on what could be done to enhance the use of daylighting in buildings. 86 responses were collected and are summarized below:
• user interfaces and documentation: 13 respondents expressed a need for more “intuitive” and “user-friendly design” tools as current tools are too specific and complicated. 7 respondents asked for better tutorials including examples and clear definitions of the simulation inputs required.
• performance indices for good daylighting: 12 participants mentioned the significance of the interactions between daylighting, electric lighting, control strategies and shading devices; 7 others thought that daylighting tools should address relationships such as the presence of daylight in buildings on occupants’ health and productivity. • general information: 11 respondents felt that a key to enhance the use of daylighting is
better information on the subject and its correlation to other building design criteria. • daylighting standard: 5 respondents believed that daylighting should become part of a
standard such as energy or building codes.
5. DISCUSSION AND CONCLUSION
With 185 valid responses, this survey gathered a reasonably accurate snapshot of the current use of simulation tools within the daylighting community. The high number of responses confirms that (a) online surveys are an effective way to gather responses from a large number of design professionals, and (b) that there exists a small but solid base of individuals that are using daylight simulation tools in actual design practice. These individuals are the “practitioners” whose needs and opinions are discussed in the following.
• weaknesses of daylighting software: The good news from this survey are that –as for building energy software– some designers have started using computerized daylight simulation tools. Initial concerns regarding software accuracy seem to be fading which might be a result of recent software validation studies23,26. On the other hand, the text-box comments provided by some participants indicated that some still found existing simulation tools difficult to use, requesting better software documentation, examples and definitions of input and output quantities.
The main barriers for not using daylight simulation tools were that participants did not know which tools to use, and that training opportunities were missing. This shows that software developers can still improve the visibility of their tools within the design community.
• practitioners’ needs: As for other building simulation software packages, self-learning is the most common training method for daylight simulation users. This explains their need for better software documentation. Telephone support lines and online discussion lists were mentioned by individuals as efficient training methods.
development than during schematic design for all three professional groups. This finding confirms results from earlier surveys on the use of design decision software.
Most survey participants used daylighting software for parameter studies and presented the results to their clients as a basis for design decisions. To facilitate this process, daylight simulation packages should help users to automatically carry out parameter studies and present the resulting relationships.
Daylight factor and interior illuminances under selected sky conditions were the two most widely used simulation outputs. The advantage of these outputs for practitioners is that existing guidelines provide minimum thresholds for these quantities, so that they can be easily used as daylight performance indicators during building design.
In contrast, there are currently no commonly acknowledged performance evaluation schemes for choosing a suitable shading device and control strategy even though shading type and control were consistently voted to be the most common design aspect influenced by a daylighting analysis. The strong interest in shading devices is not surprising, given that glare prevention is a recognized requirement for “good” daylighting. What is surprising is that existing tools do generally not feature automated routines to help users pick a suitable shading device. This suggests that the majority of surveyed users (who had a bias towards simulation programs) picked the shading device (the daylighting design aspect with the highest relevance to them) without any direct input from simulation programs.
Over 40% of surveyed researchers were using daylight autonomy as a simulation output. This high adoption rate might be the consequence of both the recent implementation of algorithms to efficiently calculate the daylight autonomy into a number of daylight simulation programs as well as the advantages of this quantity over the ubiquitous daylight factor. The high adoption rate in the research community might be an indication that daylight autonomy and other dynamic daylight performance metrics will become more widely used in the future by the overall daylighting design community.
• guidance for software developers: This survey shows that daylight simulations have come a long way. While in Aizlewood’s and Littlefair’s 1994 survey trust in the reliability of tools was still an issue, this concern has more or less vanished since, at least among individuals who routinely use daylight simulation software. Most users now seem to believe that tools can yield accurate results and that simulation errors stem from incorrect data input. This understanding might prompt users to put more emphasis on quality assurance procedures than in the past.
Another change since Aizlewood’s survey is that the use of scale models among daylight specialists seems to have fallen substantially. While in the former study 17 out of 22 specialists (77%) still used them, this number has fallen to 27% in this survey. The reasons for this decline might be that the advantages of scale models over simulation that were quoted in Aizlewood’s study (visualize the quality of lighting, photographic record, ability to model complex designs, easy changing of parameters) are less convincing today. Another explanation might be that the participants in this survey were more prone to use building simulation software than the overall design community. Whatever the reasons for this change, daylight simulation tools seem to have become an increasingly popular method for detailed daylighting analysis.
342 votes for 42 daylight simulation tools were given, revealing that the daylight simulation developer community is still very fragmented. On the other hand, 50% of the votes were based on RADIANCE compatible tools, revealing the
program’s predominance within the daylight simulation community.
Summing up, the use of daylight simulation programs largely resembles that of other building simulation programs. Simulations seem to have gained a competitive advantage over scale model approaches. A large number of different program interfaces is currently used, but the underlying simulation algorithms are concentrating on just a few approaches.
There is a need for more holistic performance indicators and design selection procedures to judge the quality and quantity of daylight in a building. Daylight autonomy is a first step towards characterizing the annual quantity of daylight. Programs that couple daylighting algorithms with thermal simulation tools ensure that electric lighting energy savings due to daylight are not studied in isolation from changes in total energy use. A “daylighting quality index” will still require more conclusive research into phenomena such as glare and health related impacts of (day)light on the human body27.
As suggested several times above, future surveys should concentrate on sampling a more random group of design professionals than this survey. Due to the sample bias that was introduced through the recruitment process, the results from this survey cannot necessarily be readily extrapolated to the design community at large.
6. ACKNOWLEDGEMENT
This work has been funded by the National Research Council Canada and Natural Resources Canada under the contract number B-3213, as well as the German Academic Exchange Office (DAAD) as scholarship PKZ: D/03/34481.
7. REFERENCES
1. International Energy Agency - Solar Heating and Cooling Programme, Task 31, ‘Daylighting Buildings in the 21st Century’, http://www.iea-shc.org/task31/ (last accessed Feb 2006).
2. Matsuo Y, "Survey of Simulation Technology in Japan and Asia", Conf. Proc. of the IBPSA ’85 Buildings Simulation, Seattle, USA, I, 22-30 (1985).
3. Mason M D , "Survey of Simulation Technology in Australia and New Zealand", Conf. Proc. of the IBPSA ’85 Buildings Simulation, Seattle, USA, I, 31-40 (1985).
4. Aizlewood M E and Littlefair P J., “Daylight prediction methods: A survey of their use”, Garston Watford, UK, British Research Establishment (1994).
5. Robinson D, "Energy model usage in building design: A qualitative assessment", Building Services Engineering Research and Technology, 17[2], 89-95 (1996).
6. Donn M, "A Survey of Users of Thermal Simulation Programs", Conf. Proc. of the IBPSA ’97 Buildings Simulation, Prague, III, 65-72 (1999).
7. Donn M, "Quality assurance simulation and the real world", Conf. Proc. of the IBPSA ’99 Buildings Simulation, Kyoto, Japan, III,1139-146 (1999).
8. de Wilde P, Augenbroe G, and van der Voorden M, "Invocation of Building Simulation Tools in Building Design Practice”, Conf. Proc. of the IBPSA ’99 Buildings Simulation, Kyoto, Japan, III, 1211-1218 (1999).
9. de Wilde P, van der Voorden M, Brouwer G, Augenbroe G, and Kaan H, "The Need for Computational Support in Energy-Efficient Design Projects in the Netherlands", Conf. Proc. of the IBPSA ’01 Buildings Simulation, Rio d Janeiro, Brazil, 513-520 (2001).
10. Lam K P, Wong N H, and Henry F, "A Study on the Use of Performance-Based Simulation Tools for Building Design and Evaluation in Singapore", Conf Proc. of the Building Simulation '99 in Kyoto, Japan, II, 675-682 (1999).
11. Ward G and Shakespeare R, “Rendering with RADIANCE. The Art and Science of Lighting Visualization”, Morgan Kaufmann Publishers (1998).
12. Lightscape simulation program, www.autodesk.com/siteselect.htm. (last accessed January 2006).
13. Pilgrim M, Bouchlaghem N, Loveday D, and Holmes M, "Towards the efficient use of simulation in building performance analysis: a user survey", Building Serv. Emg. Res. Technol., 24[3], 149-162 (2003).
14. Maamari F, “International survey on lighting simulation tools”, International Energy Agency, Report for IEA Task 31, Daylighting Buildings in the 21st Century.
15. Ward G and Rubinstein F, “A New Technique for Computer Simulation of Illuminated Spaces”, Journal of the Illuminating Engineering Society 1, 80-91 (1988).
16. Halogen eSurveyor software, distributed by Halogen, Canada,
www.halogensoftware.com (last accessed January 2006).
17. Illuminating Engineering Society of North America (IESNA), “The Lighting Handbook”, 9th Edition, IESNA New York (2000).
18. O'Connor J, Lee E, Rubinstein F, and Selkowitz S, “Tips for Daylighting with Windows”. Lawrence Berkeley National Laboratory, report # LBNL-39945, http://eetd.lbl.gov/btp/pub/designguide/copyright.html (1997).
19. Deutsches Institut für Normung e.V., "DIN 5034 Tageslicht in Innenräumen", DIN Norm, (1999).
20. Deutsches Institut für Normung e.V., "DIN EN 12464-1 Beleuchtung von Arbeitsstätten", (2003).
21. Chartered Institution of Building Services Engineers (CIBSE), "Guide A: Environmental Design ", CIBSE, (1999).
22. McHugh J, “SkyCalc Ver 2.0.”, distributed through the Heshong Mahone Group (www.h-m-g.com), CA, USA (last accessed January 2006).
23. Reinhart C F and Walkenhorst O, “Dynamic RADIANCE-based Daylight Simulations for a full-scale Test Office with outer Venetian Blinds”, Energy & Buildings 33[7], 683-697 (2001).
24. Reinhart C F, "LIGHTSWITCH 2002: A model for manual and automated control of electric lighting and blinds," Solar Energy, 77[1], 15-28 (2004).
25. Nabil A and Mardaljevic J, "Useful Daylight Illuminance: A New Paradigm to Access Daylight in Buildings", Lighting Research & Technology, 37[1], 41-59 (2005).
26. Mardaljevic J, “Validation of a Lighting Simulation Program under Real Sky Conditions”, Lighting Research & Technology 27[4], 181-188 (2000).
27. Webb A, “Considerations for lighting in the built environment: non-visual effects of light”, Energy and Buildings, (2006, in press).