Convection Enhanced Electrochemical Energy Storage
ByThomas J. Carney
B.S. Materials Science and Engineering, Leland Stanford Junior University, 2012
SUBMITTED TO THE DEPARTMENT OF MATERIALS SCIENCE AND ENGINEERING IN PARTIAL FULFILLMENT OF THE REQUIREMENTS FOR THE DEGREE OF
DOCTOR OF PHILOSOPHY AT THE
MASSACHUSETTS INSTITUTE OF TECHNOLOGY
SEPTEMBER 2018
C 2018 Massachusetts Institute of Technology. All rights reserved
Signature of Author:
Certified by:
S
Signature redacted
Depad it of Materials Science and Engineering July 20, 2018
ignature
redacted---Fikile R. Brushett Professor of Chemical Engineering
Certified by:
Signature redacted
J1/7
Thesis Supervisor
Jeffrey C. Grossman /\ / Professor of Materials Science and Engineering
Signature redacted
Accepted by: STECHNO.pSfP
13 Z018
p
Thesis Reader Donald R. Sadoway Prof sor of Materials Science and Engineering Chairman, Departmental Committee on Graduate StudiesMITLibraries
77 Massachusetts Avenue Cambridge, MA 02139
http://ibraries.mit.edu/ask
DISCLAIMER NOTICE
Due to the condition of the original material, there are unavoidable
flaws in this reproduction. We have made every effort possible to
provide you with the best copy available.
Thank you.
The images contained in this document are of the
best quality available.
Convection Enhanced Electrochemical Energy Storage
by
Thomas J. Carney
Submitted to the Department of Materials Science and Engineering on July 20, 2018 in Partial Fulfillment of the
Requirements for the Degree of Doctor of Philosophy in Materials Science and Engineering
ABSTRACT
Electrochemical energy storage will play a pivotal role in our society's energy future, providing vital services to the transportation, grid, and residential markets. Depending on the power and duration requirements of a specific application, numerous electrochemical technologies exist. For the majority of the markets, lithium-ion (Li-ion) batteries are the state-of-the-art technology owing to their good cycle life and high energy density and efficiency. Their widespread penetration, however, is limited by high production cost and inherent safety concerns. Understanding the solid-electrolyte interphase (SEI) which governs the performance and lifetime of these batteries is critical to developing the next generation Li-ion batteries. As an alternative to Li-ion, redox flow batteries store energy in solutions of electroactive species, which are housed in external tanks and pumped to a power-converting electroreactor. This configuration decouples power and energy, improving the safety and flexibility of the system, however, flow battery energy density is inherently lower than Li-ion and expensive ion-selective membranes are required for efficient operation. As a contrast to Li-ion and redox flow batteries, convection batteries harnesses the key benefits of Li-ion batteries and redox flow batteries while overcoming their individual limitations. By incorporating thick electrodes into the cell, the energy density is increased and the cost of the system is reduced. To overcome the diffusive losses in the thick electrodes, electrolyte is pumped through the electrodes, enabling uniform ion transport throughout the porous structure. However, thick electrodes can lead to large ohmic losses in the cell resulting in lower energy efficiency.
In this thesis, I discuss my work on understanding the SEI in Li-ion batteries, highlighting the thermodynamics of its origin, characterization of its structure, and strategies for future development. I then detail my work understanding redox active molecules from molecule characterization and mechanistic generation to redox flow cell level engineering. Finally, I highlight my work in the development of the convection battery technology explaining the synthesis of active materials, thick electrode design, and fabrication of the prototype convection cell architecture. Taken together, these projects highlight the theme of achieving low-cost electrochemical energy storage through various technical pathways.
Thesis Supervisor: Fikile R. Brushett Title: Professor of Chemical Engineering Thesis Reader: Jeffrey C. Grossman
ACKNOWLEDGEMENTS
I would like to acknowledge my advisor, Prof. Fikile R. Brushett, for his help, support, and guidance during my time as a graduate student. I would also like to thank Prof. Klavs Jensen and Prof. Jeff Grossman for serving on my thesis committee and providing valuable feedback during committee meetings.
I would like to thank Brian Smith of the EHS department for serving as the ChemE department safety coordinator and for helping to keep me safe during my Ph.D. I would also like to thank MIT facilities, especially our coordinator Gerry Hughes, for maintaining the research environment.
I had the privilege to work on multiple projects with numerous collaborators during my studies and am grateful for their contribution: Prof. Jeff Moore (University of Illinois Urbana-Champaign), Dr. Rob Darling (United Technologies Research Center), Mike Perry (United Technologies Research Center), and Dr. Javit Drake (Proctor and Gamble).
I would like to acknowledge the BMW Group: Dr. Simon Lux, Dr. Odysseas Paschos, Christoph Bauer, Dr. Filippo Maglia, Dr. Saskia Lupart, and Dr. Peter Lamp for their collaboration with the Li-ion work.
I am grateful for the support of the National Defense Science and Engineering Graduate Fellowship (NDSEG) and the MIT Energy Initiative which provided funding during my studies
My research was also supported by the Joint Center for Energy Storage Research, through which I had the opportunity to work with Dr. Kevin Gallagher, Dr. Lei Cheng, Dr. Chi Cheung, and Dr. Zhengcheng Zhang amongst others.
I am especially thankful for the Deshpande Center which provided funding, entrepreneurial training, and networking. It was a privilege to work with Leon Sandler, Karen Golmer, Amy Davis, and Cory Harris. I am grateful for the help, support, and guidance from my two catalysts: Dr.
Sameer Bharadwaj and Patrick Casey.
I am appreciative of my labmates in the Brushett group who could always be relied upon including Andres Badel, Jessie Hsiao, Jesse Hinricher, Emily Penn, John Barton, Steven Brown, Vincent Dieterich, AJ Fenton, Katharine Greco, Jeff Kowalski, McLain Leonard, Michael Orella, Kara Rodby, Kevin Tenny, Charles Wan, Miao Wang, Cedrik Wiberg, Dr. Jarrod Milshtein, Dr. Antoni Forner Cuenca, Dr. Sujat Sen, Dr. Liang Su, Dr. Kyler Carroll, Dr. Chaerin Kim, and Dr. Emily Carino.
I am grateful to the students I had the opportunity to supervise and to watch accomplish incredible things in the lab including Jeremiah Collins, Victoria Yao, Kiera Gavin, Katherine Stoll, Matthias Kornherr, and Grace Moore.
I am thankful for the support from my colleagues across MIT including Prof. Livia Giordano, Thomas Batcho, Jonathan Hwang, Pinar Karayaylali, Chris Kuryak, Dongwook Lee, Sokseiha Muy, Reshma Rao, Dr. John Bachman, Dr. Joe Elias, Dr. Binghong Han, Dr. Wesley Hong, Dr. David Kwabi, Dr. Kelsey Stoerzinger, Dr. Jonathon Harding, Prof. Yi-Chun Lu, Prof. Jin Suntivich, Dr. Hao-Hsun Chang, Dr. Nir Pour, Dr. Don Ha, Dr. Magali Gauthier, Dr. Marcel Risch, Dr. Zhenxing Feng, Dr. Chris Carlton, Dr. Yueh-Lin Lee, Dr. Tian Ming, Dr. Lei Wang, and Dr. Reza Kavian.
I am also extremely grateful to my family for their love and support throughout my graduate studies.
TABLE OF CONTENTS
A CK N O W LED G EM EN TS ... 5
TA BLE O F CO NTENTS ... 7
LIST O F FIG URES... 11
LIST O F TABLES... 16
LIST O F SCH EM ES ... 17
THE OPPORTUNITY FOR ENERGY STORAGE ... 19
THE SOLID ELECTROLYTE INTERFACE IN LI-ION BATTERIES... 23
COPYRIGHT NOTICE ... 23
OVERVIEW OF LI-ION INTERFACES ... 23
THERMODYNAMIC DRIVING FORCE FOR ELECTROLYTE STABILITY ... 24
THERMODYNAMIC CONSIDERATIONS OF THE ELECTROLYTE OXIDATION/REDUCTION ...
25
THE SEI LAYER ON THE NEGATIVE ELECTRODE ... 28
L ith ium m etal electrod e...2 8 G rap h ite electro d e ... 2 9 T in ele ctro d e ... 3 2 THE SEI LAYER ON THE POSITIVE ELECTRODE ... 34
L ay ered an d sp in el electrodes...34
L i-rich com p o un ds ... 3 6 CONCLUSION... 40
REDOX ACTIVE ORGANIC MOLECULES FOR FLOW BATTERIES... 43
COPYRIGHT NOTICE ... 43
O VERVIEW OF ORGANIC AQUEOUS REDOX FLOW BATTERIES... 43
ANTHRAQUINONE DISULFONIC ACID ... 44
B a ckg ro u n d ... ... . ... 4 4 Overview of experimental study...45
Chemical characterization ofA QDS derivatives ... 45
Electrochemical investigation of A QDS derivatives ... 52
Energy storage and cycling performance ofA QDS derivatives... 54
Summary ofAQDS behavior ... 61
FLOW BATTERY DEVELOPMENT WITH THE JOINT CENTER FOR ENERGY STORAGE RESEARCH.. 62
B a ckg r o u n d ... 62
O rg a n iza tio n ... 6 2 Aqueous redoxflow batteries ... 63
E lectro ly te G en om e ... 6 7 ExPERIM ENTAL SECTION ... 71
M ateria ls sy n th esis ... 7 1 Electrochemical characterization ... 72
M aterials characterization ... 74
CONCLUSION ... 75
C O N VE C T IO N BA TTER Y ... 77
O VERVIEW OF THE CONVECTION BATTERY ... 77
PRIOR RESEARCH ON CONVECTION BATTERIES ... 79
PRUSSIAN BLUE M ATERIALS DEVELOPM ENT ... 80
M aterial identification ... 80
X-ray diffraction characterization ... 81
THIN ELECTRODES ... 83
THICK ELECTRODE INVESTIGATION ... 85
Electrode fabrication ... 85
G en era tio n 0 cell ... 8 6 G en era tio n I cell ... 8 7 Three electrode cell development ... .... ... I ... .... ... I ... 91
Electrode pressure drop ... 94
N UM ERICAL M ODELING ... 95
B a ckg ro u n d ... 9 5 Numerical discretization of the interior ... 97
Numerical discretization of the boundary ... 98
R es u lts ... 1 0 0 TECHNO-ECONOM IC ANALYSIS ... 104
C ap ita l cost m o d el ... 104
L evelized cost m o d el ... ... 108
X -R ay d iff ra ction ... 112
Th in electrod ejabrication ... 1 12 Th ick electrodejabrication ... 113
P ressure drop exp erim ents ... 113
C ell a ss em b ly ... 1 14 CONCLUSION ... 114
O U TLO O K AND FUTURE W O RK ... 115
FUTURE REDOX ACTIVE MATERIAL DEVELOPMENT ... 115
CONVECTION BATTERY ELECTRODE DESIGN ... 115
LIST OF FIGURES
FIGURE 1. FLOW CHART COURTESY OF LAWRENCE LIVERMORE NATIONAL LABORATORY
HIGHLIGHTING THE 2017 ENERGY FLOW IN THE UNITED STATES AND POINTING TO THE NEED
FOR STORAGE TO IMPROVE SYSTEM EFFICIENCY AND REDUCE REJECTED ENERGY... 20
FIGURE 2. LEFT) THE POTENTIALS AND EXPECTED CAPACITIES BASED ON FULL EXTRACTION OF SELECTED LITHIUM STORAGE MATERIALS FOR LI-ION BATTERIES.20'2 ,9
RIGHT) THE DIFFERENCE BETWEEN ELECTRON ENERGY LEVELS ASSOCIATED WITH THESE
POTENTIALS AND THE HOMO/LUMO LEVELS OF THE ELECTROLYTE GOVERNS THE
THERMODYNAMIC STABILITY OF THE SEI AND DRIVING FORCE TO FORM THE SEI LAYER... 25
FIGURE 3. A) COMPUTED OXIDATION AND REDUCTION POTENTIALS USING DENSITY FUNCTIONAL
THEORY IN POLARIZABLE CONTINUUM MODEL (PCM-SMD) OF COMMON LI-ION BATTERY
SOLVENTS AND SOLVATED SALTS, CORRESPONDING TO EHOMO- -EVox AND ELUMO = -EVRED.
THE VALUES ARE CONVERTED FROM THE ABSOLUTE POTENTIAL SCALE TO THE LI/LIT
POTENTIAL SCALE BY SUBTRACTING 1.4 V.33 B) REACTIONS USED TO CALCULATE THE
REDUCTION AND OXIDATION POTENTIALS. C) IMPEDANCE OF SURFACE FILMS FORMED ON
LITHIUM FOIL UPON STORAGE FOR VARIOUS 1 M SALT-BASED ELECTROLYTES IN PC.7 D) IMPEDANCE OF SURFACE FILM ON LITHIUM FOIL UPON STORAGE FOR
1
M LIASF6 IN VARIOUSSOLVENTS37,112
SOLVENTS .3 7 1 . . . .... . . . 27
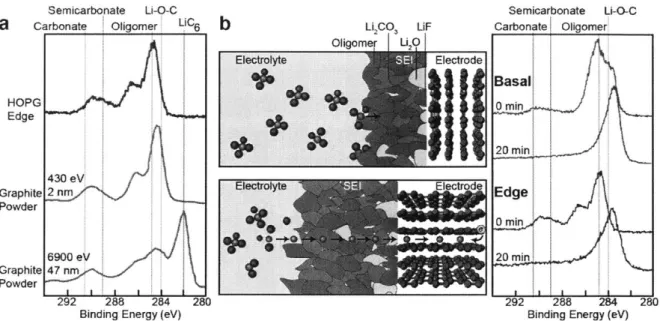
FIGURE 4. A) X-RAY PHOTOELECTRON SPECTROSCOPY OF A COMPOSITE GRAPHITE ELECTRODE. THE
DIFFERENT DEPTHS ARE OBTAINED BY TUNING THE INCIDENT PHOTON ENERGY. 1 4 9
B) LEFT,
SCHEMATIC OF THE SEI ON BASAL (TOP) AND EDGE (BOTTOM) PLANES. RIGHT, XPS C IS DATA
FROM HOPG BASAL AND EDGE ELECTRODES CYCLED IN
1
M LIASF6 IN 1:2 V/V EC:DEC, SHOWING THE PRESENCE OF MOSTLY OLIGOMERS ON THE BASAL PLANE AND OF A MIX OFCARBONATES, SEMICARBONATE AND OLIGOMERS ON THE EDGE. ... 30 FIGURE 5. A) AND B) ATOMIC ARRANGEMENT OF THE (100) AND (00 1) SURFACE, RESPECTIVELY. C)
C (LEFT) AND F (RIGHT) K-EDGE SOFT X-RAY ABSORPTION SPECTROSCOPY OF THE SEI ON
THE SN(100) AND (00 1) SURFACE. 16 2 THE SN(100) CONSISTS MOSTLY OF POROUS CARBONATE
WHILE THE SN(00 1) CONSISTS MOSTLY OF LIF. THE INSERT IS AN INSITUAFM IMAGE OF THE SN(100) AND (00 1) SURFACE AT 2.5 Vi AFTER CYCLING TWICE FROM 2.5 VLI TO 0.8 VLI.16 3 33
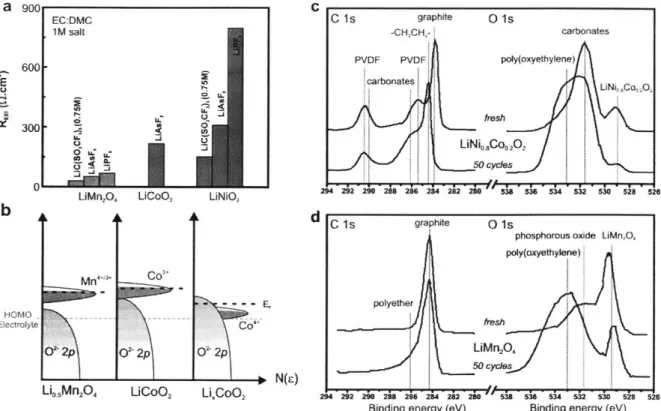
FIGURE 6. A) RESISTANCE OF THE SEI LAYER FOR LIMN204,56 LICO0217 5 AND LINIO25 6
AFTER FEW
OR 1:3 v/v EC:DMC (LICOO2). B) SCHEMATIC SHOWING THE REVERSIBLE REDOX COUPLE
MN3+/4+ FOR LIMN204 AND OF CO3'+/4+ FOR LICOO2.8'17 6 INCREASING THE TM OXIDATION DECREASES THE FERMI LEVEL OF LIxCOO2. C) AND D) C IS AND 0 1S SPECTRA FOR
LINIo.SCOO.202 AND LIMN204 RESPECTIVELY, FOR FRESHLY PREPARED SURFACES (NO
CONTACT WITH ELECTROLYTE) AND AFTER 50 CYCLES... 35
FIGURE 7. A) CHARGE/DISCHARGE CURVES OF LIxCOO2 (C/20 RATE),'7 8 LIxMNo.6NIo.202 (C/20),'79
LIxMNO3 (C/28),180 LIxRUo.5MNO.503 (C/20),94 AND LIxRuo.75SNo.2503 (C/b0).95 MATERIALS
EVOLVING OXYGEN RELEASE OR REVERSIBLE ANIONIC REDOX OF OXYGEN ARE REPRESENTED
BY STRAIGHT AND DASHED LINES RESPECTIVELY. B) SCHEMATIC OF OXYGEN EVOLUTION
OCCURRING DURING CHARGING AT HIGH POTENTIAL OF LICOO2 AND LIi.2MNo.6NIo.202
POSITIVE ELECTRODES. C) SCHEMATIC OF THE ANIONIC REVERSIBLE OXIDATION OCCURRING
DURING CHARGE AT HIGH POTENTIAL FOR L12RUi-xSNx03 SYSTEM... 36
FIGURE 8. A) ACTIVATION AND REACTION FREE ENERGIES FOR NUCLEOPHILIC REACTIONS OF
SUPEROXIDE WITH ORGANIC CARBONATES (EC, PC, DMC), SULFONATE ESTERS, ALIPHATIC ESTERS AND LACTONES (ESTERS/LACTONES), N,N-DIALKYL AMIDES AND N-ALKYL LACTAMS (AMIDES/LACTAMS), PHOSPHINATES, PHOSPHONATES, AND PHOSPHATES (P-CONTAINING), FLUORINATED ETHERS (F-ETHERS), ALKYL SULFONES (SULFONES), ALIPHATIC AND AROMATIC
NITRILES (NITRILES), SUBSTITUTED N-METHYLOXAZOLIDINONES (NMO) AND
DIMETHOXYETHANE (DME).190-1 92 B) COMPUTED PKA FOR N,N-DIALKYL AMIDE AND
N-SUBSTITUTED LACTAM SOLVENTS (LEFT), ALIPHATIC NITRILES AND DINITRILES SOLVENTS (CENTER) AND FLUORINATED ETHERS (RIGHT) IN DIMETHYL SULFOXIDE (DMSO).90,'93 C) REACTION PROFILES (FREE ENERGIES REPORTED IN EV) AND ATOMIC CONFIGURATIONS FOR NUCLEOPHILIC AND PROTON TRANSFER REACTIONS OF SUPEROXIDE WITH PC SOLVENT. 1 9 ... 39 FIGURE 9. 'H NMR SPECTRUM (400.00 MHz) OF 5 MG OF AQDS, AQDS-IER, OR AQDS-H2SO4
IN 1 ML OF A) D20 AND B) D6-DMSO VS. TMS. C) 'H NMR PEAK POSITION OF AQDS (NOTED
BY THE DIFFERENT SYMBOLS) IN D20 PLOTTED AGAINST THE LOG OF CONCENTRATION AND
FITTED TO A DIMER MODEL. AQDS-IER AND AQDS-H2SO4 LIE ON THE SAME TREND LINE.. 47 FIGURE 10. GAS CHROMATOGRAPHY ANALYSIS OF AQDS GAS RELEASED. AQDS POWDER WAS
LOADED INTO A HERMETICALLY SEALED CELL AND ATTACHED TO AN AGILENT TECHNOLOGIES 7890B GAS CHROMATOGRAPHY (GC) SYSTEM. A BASELINE (BLACK LINE) WAS TAKEN AFTER
ALLOW FOR COMPLETE DISSOLUTION OF THE AQDS AND STIRRED FOR 5 MIN. THREE
SEQUENTIAL 15 MIN GC RUNS WERE PERFORMED AND ARE OFFSET. THE Y-AXIS IS THE
UNCALIBRATED, UNADJUSTED SIGNAL INTENSITY (THERMAL CONDUCTIVITY DETECTOR LEFT,
FLAME IONIZATION DETECTOR RIGHT) FROM EACH RUN. A MAJORITY C02 PRODUCT WAS
OBSERVED WITH MINOR CO FORMATION. THE UNLABELED PEAKS CORRESPOND TO VALVE
SW ITCHES IN THE G C . ... 49
FIGURE 11. 13C NMR OF AQDS SHOWING WITH THE C02 ADDUCT PEAK (165.2 PPM) HIGHLIGHTED
BY THE *. (100.58 MHz, D20) 50 MG OF AQDS (BLACK LINE) AND 100 MG OF AQDS (GREEN LIN E) IN I M L OF D 20 . ... 50
FIGURE 12. AQDS PH TITRATION AND SIMULATION A) TITRATION CURVE OF 50 MM AQDS USING
0.1 M HCL. B) PREDICTED EQUILIBRIUM DISTRIBUTION OF THE PROTONATED VERSIONS OF
ANTHRAHYDROQUINONE... 51
FIGURE 13. TITRATION OF 50 MM OF AQDS-IER IN H20 WITH 0.1 M NAOH. A PKA OF 1.74 IS O B SER V ED ... 52 FIGURE 14. CYCLIC VOLTAMMETRY ANALYSIS OF AQDS DERIVATIVES... 52
FIGURE 15. PEAK TO PEAK SEPARATION (AEPP) OF THE OXIDATIVE AND REDUCTIVE PEAKS DURING
CYCLIC VOLTAMMETRY AT VARYING CONCENTRATIONS OF AQDS IN DIFFERENT
ELECTROLYTES AVERAGED OVER FIVE CYCLES (STANDARD DEVIATION <4 MV). FOR ALL
EXPERIMENTS, THE SCAN RATE IS 20 MV/S... 53
FIGURE 16. A) BULK ELECTROLYSIS OF 10 MM AQDS IN 0.5 M NA2CO3:NAHCO3 AT PH = 9.58. B) BULK ELECTROLYSIS OF 10 MM OF AQDS IN 0.1 M, 0.5 M, OR 1.0 M H2S04. C) BULK
ELECTROLYSIS OF 10 MM OF AQDS, AQDS-IER, AND AQDS-H2SO4 IN 0.5 M H2SO4. D) BULK ELECTROLYSIS OF 10 MM OF AQDS IN 0.5 M H2SO4 FOR 20 CYCLES AT
1
C. ALLEXPERIMENTS WERE CONDUCTED WITH ARGON CONTINUOUSLY BUBBLING IN SOLUTION. ... 55
FIGURE 17. BULK ELECTROLYSIS OF AQDS WITH IN SITU PH MONITORING. ... 56
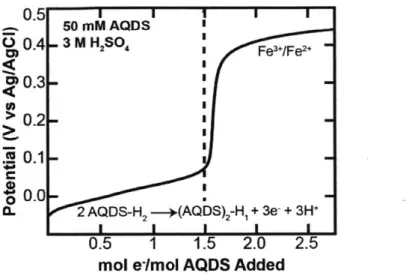
FIGURE 18. CHEMICAL TITRATION OF 50 MM OF REDUCED AQDS IN 3 M H2SO4 WITH 0.1 M
F E C L 3. ... 5 8
FIGURE 19. BATTERY PRICE FOR ENERGY ILLUSTRATED FOR TWO DIFFERENT CLASSES OF FLOW BATTERIES AS A FUNCTION OF AVERAGE OPEN-CIRCUIT CELL VOLTAGE. THE SHADED REGIONS
DENOTE THE RANGE OF POTENTIAL PRICES OWING TO THE UNCERTAINTY IN FUTURE
M+ REPRESENTS TAILORED POSITIVE ELECTROLYTE MOLECULES. THESE CALCULATIONS
ASSUME FUTURE STATE CONDITIONS WHERE FLOW BATTERIES ARE USED TO STORE LARGE QUANTITIES OF ELECTRICITY PRODUCED IN THE WORLD (>1% OF TOTAL ELECTRICITY
PRO D U CED ). ... 64
FIGURE 20. CYCLING DATA OF THE TIRoN-AQDS FLOW CELL SHOWING POTENTIAL VS. CAPACITY,
EFFICIENCIES, AND CAPACITY STABILITY. CELL TESTING CONDITIONS WERE ACTIVE SPECIES CONCENTRATION 50 MM, CURRENT DENSITY OF 10 MA/CM2, FLOW RATE OF 10 ML/MIN,
NAFION-1 17 MEMBRANE, SIGRACET 29 AA CARBON PAPER ELECTRODES (2.5 CM2), AND AN
ID FF FLOW FIELD . ... 67 FIGURE 21. A) ELECTRODES GREATER THAN 300 iM LEAD TO DIFFUSION LOSSES AND THE FULL
CAPACITY OF THE ELECTRODE IS NOT ACCESSED. B) THROUGH CONVECTION, DIFFUSION
LOSSES ARE OVERCOME AND A SUFFICIENT CONCENTRATION OF THE ACTIVE ION IS MAINTAINED THROUGHOUT THE ELECTRODE ENABLING GREATER POWER AND ENERGY
D EN SITY . ... 7 8
FIGURE 22. X-RAY POWDER DIFFRACTION PROFILE OF PRUSSIAN BLUE ANALOGUES. LEFT)
POSITIVE ELECTRODE MATERIALS AND RIGHT) NEGATIVE ELECTRODE MATERIALS. THE
MATERIAL ABBREVIATIONS CAN BE FOUND IN THE TEXT BELOW... 81
FIGURE 23. CYCLIC VOLTAMMETRY OF A THIN FILM OF PRUSSIAN BLUE ON A PLATINUM SUBSTRATE
IN 0.2 M KCL WITH PH = 5.1 .274,276 PRUSSIAN BLUE CYCLES BETWEEN PRUSSIAN WHITE AND PRUSSIAN GREEN DEPENDING ON THE OXIDATION STATE... 83
FIGURE 24. LEFT) THREE ELECTRODE CELL USED TO ELECTROCHEMICALLY EVALUATE THIN
ELECTRODES. RIGHT) THIN ELECTRODES OF CUR SHOW STABLE CAPACITY ACCESS AND ARE
ABLE TO ACCESS GREATER CAPACITY THAN PRIOR LITERATURE DATA. 265 84
FIGURE 25. LEFT) MEASURED REDOX POTENTIALS OF THE PRUSSIAN BLUE ANALOGUE ELECTRODES
MEASURED DURING HALF-CELL CYCLING. RIGHT) CAPACITY RETENTION OF THE MEASURED ANALOGUES AFTER 20 CYCLES... 84 FIGURE 26. LEFT) CHARGE-DISCHARGE PROFILE OF A THIN ELECTRODE TB-B/CUR CELL SHOWING
THE EFFECT OF CONVECTION IN 1 M NACL AT PH =2. RIGHT) FINAL DISCHARGE CAPACITY OF THE SAME CELL SHOWING CONVECTION INCREASES THE OVERALL CAPACITY... 85
FIGURE 28. A) A FLOW CHANNELS THROUGH THE THICK ELECTRODE. B) HIGH RESOLUTION IMAGE
SHOWING THE NANOPORES PRESENT IN THE THICK ELECTRODE. C) MICROSCALE PORES
PRESENT. D) LARGE MACROSCALE PORE PRESENT THROUGHOUT THE THICK ELECTRODE. ... 88
FIGURE 29. OUR PROOF-OF-CONCEPT CELL DEMONSTRATES STABLE EFFICIENCIES FOR OVER 1,500 CYCLES (CA. 10 MONTHS). THE MEAN AND STANDARD DEVIATION FOR THE EFFICIENCIES ARE SHOWN FOR THE LAST 100 CYCLES. IN THIS CELL, THE THEORETICAL CAPACITY OF THE 5-MM
THICK ELECTRODES IS 50 MAH/G INDICATING AN AVERAGE CAPACITY ACCESSED OF CA. 60%.
... 89 FIGURE 30. SEM IMAGE OF THE THICK ELECTRODE MICROSTRUCTURE BEFORE CYCLING. SEM
IMAGE OF THE THICK ELECTRODE MICROSTRUCTURE AFTER TWO WEEKS OF CYCLING AT C/3, SHOWING THE GROWTH OF A SURFACE FILM... 90 FIGURE 31. LEFT) CAPACITY ACCESSED DURING DISCHARGE VS CYCLE NUMBER FOR THE GEN 1
CELL. RIGHT) EFFICIENCY PLOT FOR THE GEN 1 CELL. NO DISCERNABLE EFFECT OF FLOW IS
O B SER V E D ... 9 1 FIGURE 32. PHOTOGRAPH OF THE THREE ELECTRODE CONVECTION BATTERY CELL. A AG/AGCL
REFERENCE ELECTRODE IS PLACED IN BETWEEN THE TWO PRUSSIAN BLUE ANALOGUE
ELECTRODE TO EVALUATE EACH ELECTRODE'S INDIVIDUAL PERFORMANCE... 92 FIGURE 33. LEFT) THE GEN 1 CELL IN A FULL CELL CONFIGURATION IS UNABLE TO ACCESS THE
FULL THEORETICAL CAPACITY OF THE CELL. RIGHT) IN A THREE ELECTRODE CELL
CONFIGURATION, WE ARE ABLE TO ACCESS THE FULL CAPACITY OF A THICK ELECTRODE
SIGNALING UNEVEN ACTIVE MATERIAL BALANCING PRESENT IN THE FULL GEN 1 CELL. THE
ELECTROLYTE FOR BOTH CELLS WAS I M NACL AT PH = 2... 93
FIGURE 34. LEFT) CHARGE-DISCHARGE PROFILES OF AN ELECTRODE WITH TWO 1/32" CHANNELS
SHOWING THE EFFECT OF FLOW INCREASING THE CAPACITY AND REDUCING THE
OVERPOTENTIAL OF THE CELL. RIGHT) CONVECTION INCREASES THE ACCESSIBLE CAPACITY OF THE STRUCTURE. ... 94
FIGURE 35. LEFT) EFFECT OF VARYING CHANNEL QUANTITY AND DIAMETER ON ELECTRODE
PERMEABILITY. RIGHT) AVERAGE PRESSURE DROP PER UNIT LENGTH ACROSS THE ELECTRODE FOR A FLOW RATE OF 10 ML/M IN... 95
FIGURE 36. NUMERICAL DIVISION OF THE BATTERY CELL REPRODUCED FROM THE LIONSIMBA
'83
FIGURE 37. DISCRETIZATION SCHEME USED FOR THE EXIT AND ENTRANCE TO THE CELL SHOWING
THE EXISTENCE OF GHOST POINTS. ... 98
FIGURE 38. LEFT) THE EFFECT OF ELECTROLYTE FLOW ON THE CAPACITY. RIGHT) CONCENTRATION
PROFILE OF A 5 x 10⁻⁴ M THICK ELECTRODE AT THE END OF DISCHARGE, 2 V. THE INITIAL
CONCENTRATION THROUGHOUT THE CELL AND TANK WAS
1
M AND THE APPLIED CURRENTDENSITY W AS 3 M A /CM 2 .. ... . . . .. . . .. . . .. . . .. . . .. . . .. . . . .. . . .. . . .. 101 FIGURE 39. LEFT) THE EFFECT OF ELECTROLYTE FLOW ON CAPACITY FOR ELECTRODES OF VARYING
THICKNESS. RIGHT) CONCENTRATION PROFILE FOR THE ELECTROLYTE AT THE END OF
DISCHARGE, 2 V. THE DISCHARGE CURRENT DENSITY iS 3 MA/CM2. ... . .. . . . .. . . .. . . . .. 102
FIGURE 40. CAPACITY INCREASED OBSERVED WHEN SWITCHING BETWEEN NO FLOW AND 1 X 10⁻⁵ M/S FOR DIFFERENT APPLIED CURRENT DENSITIES AND THICKNESS...
103
FIGURE 41. LEFT) OPTIMAL ELECTRODE THICKNESS THAT CAN BE ENHANCED BY CONVECTION
GIVEN AN OPERATIONAL CURRENT. RIGHT) OPTIMAL ELECTRODE THICKNESS THAT CAN BE ENHANCED BY CONVECTION FOR A GIVEN DISCHARGE TIME. ... 104 FIGURE 42. OUR TECHNO-ECONOMIC MODEL FOR THE TOTAL COST PREDICTS THE COST OF OUR
TECHNOLOGY TO BE 15-30% CHEAPER THAN LI-ION... 106
FIGURE 43. FUTURE LEVELIZED COST OF THE CONVECTION BATTERY TECHNOLOGY COMPARED TO
L I-IO N ... 1 10 FIGURE 44. FUTURE CONVECTION BATTERY ELECTRODE DESIGN BALANCES CAPACITY ACCESSED
AN D PRESSURE DROP ... 116
LIST OF TABLES
TABLE 1. HIGH RESOLUTION MASS SPECTROMETRY ANALYSIS OF THE M AND M+N PEAKS WHERE M
IS MOLAR MASS OF AQDS. BASED ON THE M/Z OBSERVED, AQDS AND AQDS-IER ARE TWO
MONOANIONS DIMERIZED (BLUE TEXT) AND AQDS-H2SO4 IS A MONOMER DIANION (RED
TEXT). THE BOLD SAMPLES ARE EXPERIMENTAL AND THE * ARE SIMULATED DATA USING C H EM D RA W 15... 48
TABLE 3. EXPERIMENTAL REDOX POTENTIALS OF MOLECULAR CANDIDATES MEASURED USING
CYCLIC VOLTAMMETRY FOR AQUEOUS ELECTROLYTES (PH = 10, 7, AND 3) AND NONAQUEOUS
ELECTROLYTES (PROPYLENE CARBONATE AND ACETONITRILE). ... 70
TABLE 4. PROFILE FITTING OF THE X-RAY POWDER DIFFRACTION PROFILES USING ICSD PATTERN
#00-052-1907 WITH SPACE GROUP Fm 3m . ... 82
TABLE 5. THE EFFECT OF 1 M SALT IN A PH = 7 ELECTROLYTE ON THE ENERGY EFFICIENCY AND CAPACITY ACCESSED OF THE GEN I CELL CYCLED AT C/3. ... 90
TABLE 6. THE EFFECT OF 1 M SALT IN A PH =2 ELECTROLYTE ON THE ENERGY EFFICIENCY AND
CAPACITY ACCESSED OF THE GEN 1 CELL CYCLED AT C/3. ... 91
TABLE 7. CORRELATION TABLE FOR DIFFERENT INSTALLATIONS (INDICATED BY THE DIFFERENT
COLUMNS) PROVIDED BY ENERGY SERVICE PROVIDERS FOR VARIOUS TECHNOLOGIES ... 105
TABLE 8. CRITICAL METRICS FOR COMPUTING THE CAPITAL COST OF THE CONVECTION BATTERY
COMPARED WITH ALTERNATIVE TECHNOLOGIES. ... 107
TABLE 9. KEY SYSTEM, BATTERY, AND FINANCE PARAMETERS USED IN MODELING THE LEVELIZED
C O ST . ... 10 9
LIST OF SCHEMES
SCHEME 1. SUMMARY OF PRETREATMENTS FOR AQDS EXAMINED IN THIS STUDY... 45
SCHEME 2. AN AQDS MONOMER WITH A C02 ADDUCT WILL BE HYDROLYZED AND DIMERIZE WITH
A VARYING LEVEL OF REDUCTION DEPENDING ON THE ELECTROLYTE. AQDS IN THE BUFFERED MILD-ALKALINE AND ACID ELECTROLYTE IS NOT EXPOSED TO THE ATMOSPHERE DUE TO
CONSISTENT SPARGING WITH ARGON. ... 59
SCHEME 3. A) A HYDROXYANTHRAQUINONE-ANTHRAQUINONE DIMER IN NEUTRAL TO BASIC PH REVERSIBLY STORES TWO ELECTRONS TO GIVE AN OVERALL ENERGY DENSITY OF ONE
ELECTRON PER MOLECULE OF AQDS. B) A SEMIANTHRAQUINONE-ANTHRAQUINONE DIMER IN
ACIDIC PH REVERSIBLY STORES THREE ELECTRONS TO GIVE AN OVERALL CAPACITY OF 1.5 ELECTRONS PER MOLECULE OF AQDS ... 60
THE OPPORTUNITY FOR ENERGY STORAGE
A grand challenge of the 21st century will be the evolution of the electrical power system (the
grid) to meet emerging energy demands while balancing environmental stewardship and cost-effectiveness. In 2018, 82% of the total energy consumed in the United States was derived from fossil fuel sources (i.e., oil, coal, and natural gas).' However, in the future, this dependence will not be feasible,2
as rising population and continuing economic growth in the developing world are projected to double global energy consumption by 2050.' Non-renewable fossil fuel reserves, which took millennia to accumulate, are finite and rapidly exhausting. Moreover, the continued and increasing generation of anthropogenic carbon dioxide (C02) from fossil fuel combustion will likely have negative implications for the global climate.4 Analysis by the Intergovernmental Panel on Climate Change (IPCC) indicated that, to stabilize the atmospheric concentration of C02 at
350-400 ppm (410 ppm as of May 2018),5 by 2050, global C02 emissions would need to be
reduced to a level of 20-50% of the 2000 emissions.6 Thus, a tremendous need exists for scientific and technological advances to address these challenges, sparking worldwide investment in low carbon / carbon neutral power generation, carbon capture and storage, and system-wide energy efficiency.7'8
Decarbonization of electricity generation will require the widespread integration of renewable, non-dispatchable energy sources (e.g. solar photovoltaic (PV), wind). However, the uncontrollable intermittency of these resources often leads to mismatches in electricity supply and demand and while these sources currently comprise a small fraction of the electricity generated in the US (Figure 1), this fraction is expected to grow. Energy storage technologies can smooth and meter the delivery of electricity from these variable resources as well as offset congestion issues within transmission and distribution infrastructure thus deferring costly investments. Indeed, increased energy storage assets can provide a range of high value services including grid stabilization and resiliency through backup power, introducing new revenue streams for a range of stakeholders,9 and reducing the amount of energy wasted (Figure 1). Tangible demand for energy storage is being created today by programs at the national, state, and local levels. Renewable portfolio standards have been established in many states within the US as well as several European and Asian countries which will require cost competitive energy storage technology, validated reliability and safety, equitable regulatory environments, and industry acceptance.9"0 Notably, California's Assembly Bill 2514 (AB2514) requires utilities to procure 1.325 GW of energy storage capability by 2020,
and to install this capability by 2024." Massachusetts's Department of Energy resources recently committed to procure 200 MWh of viable and cost-effective energy storage systems by 2020.12 While a range of storage technology options exist to meet grid needs, no single technology is suitable for all applications. Electrochemical energy storage, specifically rechargeable batteries, is well suited to address many of these future needs as their performance characteristics (e.g., high power/energy density, rapid response time, terrain independence) match storage demands (e.g., 1 kW to 10 MW over the duration of minutes to hours). Rechargeable batteries are also expected to play a major role in decarbonization of the automotive fleet, a necessity for meeting aforementioned C02 emissions targets, with the production of hybrid, plug-in hybrid, and all-electric vehicles.
Estimated U.S. Energy Consumption in 2017: 97.7 Quads Lawrne Lboretory
Figure 1. Flow chart courtesy of Lawrence Livermore National Laboratory highlighting the 2017 energy flow in the United States and pointing to the need for storage to improve system efficiency and reduce rejected energy.
Rechargeable batteries transform electrical energy into chemical energy (and vice-versa) through redox (reduction and oxidation) processes within a cell. These occur at negative (lower potential) and positive (higher potential) electrodes with a working ion, such as a lithium cation, transferring between the two electrodes to maintain electroneutrality. Batteries typically consist of
separated into enclosed cells (e.g., lithium-ion batteries) and flow cells (e.g., redox flow batteries). However, it should be noted that, despite the promise of storage, only about 2.5 % of total electric production in the US relies on grid energy storage with the principal barrier to widespread installation being the system cost." Currently, 96% of the energy stored on the grid is through pumped hydro due to its low cost of 200 $/kWh. 4
However, pumped hydro is geographically limited, has a large installation size and cost, and enacts a significant environmental toll.
Lithium-ion batteries (Li-ion) are the state-of-the-art battery technology for both transportation and grid applications due to their high energy density, good cycle life, and high charge / discharge efficiency.9 However, their production cost, scalability, and flammability hazard have hindered widespread penetration.9 Li-ion batteries operate by shuttling lithium cations from a negative electrode (e.g., graphite) to a positive electrode (e.g., transition metal oxides) during discharge, and from the positive electrode to the negative electrode during charge. The voltage difference between the two electrodes arises from the oxidation state change of the host material during insertion and removal of the lithium cations. Lithium is chosen as the intercalant because its low atomic weight leads to a high energy density battery. Recent grid-related efforts into alternative chemistries have focused on aqueous alkali-ion batteries (e.g., Aquion,15 although recently bankrupt) which provide a potentially safer and less toxic alternative to Li-ion albeit at the expense of energy density. Lead-acid (Pb-acid) batteries are also under investigation but limited depth of discharge, low energy density, large footprint, and electrode corrosion reduces useful life.9 As electrode size must scale with the reactor size in an enclosed architecture, the mixed power and energy scaling limits operational flexibility of all aforementioned batteries which can adversely impact economic viability, particularly for long duration applications.
As an alternative configuration for the grid, redox flow batteries store energy in solutions of electroactive species, which are housed in external tanks and pumped to a power-converting electroreactor. State-of-the-art flow battery technology is based on vanadium salts dissolved in an aqueous acidic electrolyte solution. In the positive electrolyte, vanadium cycles between the 4+/5+ state and in the negative electrolyte, vanadium cycles between the 2+/3+ state with hydrogen ions shuttling across the membrane to satisfy charge balance. In general, redox flow batteries possess several advantages over the enclosed cell including decoupled power rating (reactor size) and energy capacity (tank size), high active-to-inactive materials ratio (particularly at long durations), and improved safety characteristics. However, flow battery energy density is inherently lower than
that of enclosed batteries due to the additional electrolyte volumes required to solubilize the active materials. Moreover, expensive ion-selective membranes (e.g., Nafion) are required to prevent positive and negative electrolytes from mixing in the reactor, which would lead to loss of efficiency and storage capacity, but to allow working ions to be exchanged between the two solutions to maintain electroneutrality. Recent research has focused on developing new organic redox active materials to replace expensive vanadium (ca. 23 $/kg"6) as organics offer a wider design space in solubility, redox, and potential based on molecular functionalization. Thus, significant research is ongoing into new charge storage chemistries and cell configurations.
To overcome these limitations found in Li-ion and flow batteries, we have sought to develop a convective electrochemical energy storage device (convection battery) that enables thick electrodes, on the millimeter to centimeter scale, thereby increasing the active-to-inactive materials ratio in each cell, increasing the energy density, and reducing the cost of the system. To overcome the diffusive losses in the thick electrodes, electrolyte is pumped through the electrodes. This enables uniform ion transport throughout the porous structure, allowing for complete electrode utilization, minimization of side reactions, and facilitation of high power operation. Leveraging our previously-developed techno-economic model,'6 we predict the future state cost of our technology to be 15-30% cheaper than competitive technologies at scale. The convection battery can utilize different battery chemistries (e.g., aqueous, nonaqueous) and results in cost reduction and energy density increases as compared to the traditional configuration.
In this Ph.D. thesis, I will describe my research surrounding Li-ion batteries, redox flow batteries, and a novel energy storage concept (convection battery). My work in Li-ion batteries investigated the origin of the solid-electrolyte interface (SEI) and its role in battery operation. In redox flow batteries, I studied the reaction mechanisms of emerging organic redox active materials, translating computational results to experimental electrochemical properties, and prototyping aqueous redox flow cells. Drawing from Li-ion batteries and flow batteries, my advisor and I invented the convection battery, of which I investigated the theory, operation, materials synthesis, electrode formulation, techno-economic modeling, and numerical modeling. In summary, my Ph.D. has sought to explore various pathways to low-cost electrochemical energy storage to meet overall societal and environmental challenges.
THE SOLID ELECTROLYTE INTERFACE IN LI-ION BATTERIES
Copyright notice
Certain elements of the following chapter are reprinted (adapted) with permission from "Electrode-Electrolyte Interface in Li-Ion Batteries: Current Understanding and New Insights" by Magali Gauthier, Thomas J. Carney, Alexis Grimaud, et al. Journal of Physical Chemistry Letters, 2015, 6 (22), pp 4653-4672. DOI: 10.1021/acs.jpclett.5b01727. Copyright 2015 American Chemical Society.
Overview of Li-ion interfaces
Lithium-ion (Li-ion) batteries are an essential component of modern electronic devices. Li-ion batteries shuttle lithium cations (Li') and electrons between host structures with different lithium intercalation voltages. 17-2 Negative electrodes with lithium intercalation voltages close to 0 Vi (Li/Lie) accommodate lithium near the neutral valence state,2022 while positive electrodes with intercalation voltages greater than 3 VL accommodate Li' into the host structure. 21,23-26 The
electrochemical potential at which these redox reactions occur for most negative electrodes is below the reduction potential of the electrolyte,27-3 3 which leads to the reduction of the electrolyte
and to the formation of the well-known solid-electrolyte interphase (SEI).3" 0 A SEI that is
electrochemically stable, conductive to Li', and electronically insulating34'39 prevents further
electrolyte decomposition and lithium consumption during cycling and is essential to achieving a high coulombic efficiency and low impedance rechargeable battery.4 44 The formation of non-uniform SEI films on both lithium and graphite brought about by non-non-uniform lithium deposition/intercalation process can result in Li dendrites,45-47 which can cause an internal short circuit in the battery and lead to catastrophic failure.45 Dendrite formation can, however, be
mitigated using electrolyte solutions that form a more flexible SEI.48-50 The stability of the
electrolyte with positive electrodes also affects battery safety as exothermic reactions of charged positive electrodes with flammable electrolytes lead to substantial heat generation, triggering thermal runaway.i 54 The origin of the SEI on positive electrodes, its stability, and electrochemical properties are less understood than the SEI on negative electrodes.5 5 5 8 In addition,
for high intercalation potential electrodes, oxygen species can be released,5 9-2 further complicating and changing the SEI nature, properties, and impedance.13-7 Thus, while significant
work has been done to study and harness the SEI layer for Li-ion batteries,20,21,34-36,40,56,68-72 much remains to be understood at the fundamental level. Understanding the mechanisms of the SEI layer
formation, its chemical composition, electrochemical properties, and stability are crucial in developing stable and efficient Li-ion batteries.
Thermodynamic driving force for electrolyte stability
The location of an electrode's potential within the electrolyte stability window governs the driving force for electron transfer to or from the electrolyte and strongly affects the structure and composition of the SEI layer. Thus, understanding the origin of an electrode's potential is critical to understanding the SEI layer. The difference between the electrochemical potentials of the negative and positive electrodes (Pj and -, respectively) defines the thermodynamic cell voltage (Vherm.), as shown in Equation 1, where e is the electron charge.'8
e
*Vtherm = A- - (1)All voltages in this chapter will be given with respect to VU and energy level vs. EU, which refers to the voltage or energy level of the electrode against the Li/Lit couple respectively.
In the case of intercalation electrodes, the electrochemical potential corresponds to the Fermi level of the electrons in the electrode.18,73,74 For graphite, the most common negative electrode, the Fermi level lies in an itinerant band'8 close in potential to lithium (- 0.1
VL20
,7 2
). For the majority of positive electrodes, the Fermi level is located near the top of the valence band, which is determined by the redox couple of the transition metal (TM), the coordination through the Madelung potential, and the nature of the ligand.8
,7 3,74 In a molecular orbital framework, the electrochemical potential corresponds to the energy of the valence band formed by the mixing of the d band of the TM and the p band of the ligand. By lowering the position of the valence band in electron energy, the potential of lithium intercalation increases (Figure 2). Moreover, by changing the nature of the ligand and TM (Figure 2), average potentials can be varied from (0.5-1 VU) for nitrides using low valence state TM,7577 to values around 2 VLi for disulfides (e.g., 2.2
VLi for LiTiS27 8
) (Figure 2). Substituting sulfur for a more electronegative ligand such as oxygen additionally lowers the energy of the valence band and therefore increases the potential up to values as high as 4 VLi for oxides such as LiCoO221 (Figure 2) and substituted cobalt layered compounds like Li(Ni,Mn,Co)02 (NMC)79 80 and Li(Ni,Co,Al)02 (NCA).12,8
1 For some insertion,
layered, oxide electrodes, such as LiCoO2, upon delithiation, the Fermi level falls within the anion p band (overlap of the valence band with the top of the ligand p)8 (Figure 2), and the consequent
working potentials as high as 4.1 V and 4.7 Vi for Lii-xMn2O4 (Mn 4
/3') and LiMnI.sNio.5O4
(Ni4'/Ni2+), respectively (Figure 2).85 The potential of intercalation oxide compounds can be
further increased by utilizing a M-O-X bonding framework instead of a M-O framework, where X is an electronegative element. Using this principle, known as inductive effect, the valence band energy can be further tuned as in LiMPO4 polyanionic compounds, where potentials vary in the range 3.5-5 V (Figure 2). 26,86-89
To increase the capacity of layered intercalation compounds, researchers are now exploring new compounds such as Li-rich (or overstoichiometric) LiI+xMO2, described as either solid solutions59,90 or composites9 193 of layered LiMO2 and layered Li2MO3, and Li2MO3 compounds
which demonstrate working potentials above 4 VLi.94-9 6
LiC, V C C Li4.4Sn Li4A Si -- M/M "j i NILUMO MS NO Fe 2 -i& L i ,M N y N 3 000 > 'MS2 Li2S 2p 3
0V
0
o/3 e Ni 00 LU202--M*/ 4 n co LiMO2 6 -* N(c) 250 500 750 1000 1600 1800 4500 5000 LIXC6 LI3MN2 LIMO2Capacity (mAhlg)
Figure 2. Left) The potentials and expected capacities based on full extraction of selected lithium storage materials for Li-ion batteries.2021,26,72,73,75-78's-8 9,97-'o2 Right) The difference between electron energy levels associated with these potentials and the HOMO/LUMO levels of the electrolyte governs the thermodynamic stability of the SET and driving force to form the SET layer.
By changing the d band and anion p band, the Fermi level or the potential of intercalation materials can be tuned over a wide range of potentials (Figure 2). To avoid oxidation or reduction of the electrolyte, the potentials of the materials described above have to match the stability window of the electrolyte.
Thermodynamic considerations of the electrolyte oxidation/reduction
The difference between the Fermi level of the electrode and the HOMO (highest occupied molecular orbital) /LUMO (lowest unoccupied molecular orbital) levels of the electrolyte governs
the thermodynamic stability of the electrolyte on the electrode and the driving force to form the SEI layer.18"03 A negative electrode with a Fermi level higher in energy than the LUMO of the electrolyte will have a driving force to reduce the electrolyte (Figure 2, right).'8 A positive
electrode with a Fermi level lower in energy than the HOMO of the electrolyte will have a driving force to oxidize the electrolyte (Figure 2, right).18
The LUMO and HOMO levels of the electrolyte can be calculated from the first adiabatic electron transfer to and from the bulk of the electrolyte (Figure 3a,b).313 2,104-'07 Pure carbonate solvents commonly used in Li-ion batteries such as ethylene carbonate (EC), propylene carbonate (PC), and dimethyl carbonate (DMC) have LUMO levels that approach the Fermi level of the Lie/Li couple (Figure 3a).30'3"04 There is no significant difference between the LUMO levels of pure PC, EC, and DMC, indicating that changing the carbon chain attached to carbonate group does not affect the LUMO level, as the additional electron transferred is localized at the carbonate group (Figure 3b). When lithium cations are considered in the calculations, the LUMO energy levels of the electrolytes decreases by ~ 0.5 eV relative to pure solvents, rendering these electrolytes less thermodynamically stable against metallic Li and graphite. This decrease in stability can be explained by Li' interaction with the extra electron localized at the carbon center of the carbonate group of the solvent molecule.30 3"'0 4 However, these computational results only
consider Li' and solvent molecules but not counter-ions such as PF6-, C104- and BF4 . As will be demonstrated in the following section, salt anions have been experimentally determined to play an important role in the thermodynamic stability of electrolytes on the negative electrode108-1" and the impedance of SEI films 37,71,112 (Figure 3c,d). Species with elements unique to salt anions such
as fluorine-containing products (e.g., LiF) have been detected at the negative electrode surface.7
""
3' 4The computed HOMO energy levels of pure carbonate solvents (close to -7 eV vs. EU in Figure 3a) is beneath the Fermi level of commonly used positive electrode materials (-4 eV vs. EU in Figure 2), indicating electrode stability of the electrolyte against oxidation.'0 5 When a salt anion is added to the solvent, the HOMO level of the electrolyte can be increased by up to ~ 1.5 eV (Figure 3a), making the electrolyte less stable against oxidation. The thermodynamic stability trend of the electrolytes examined is in the decreasing order from PF6-, BF4-, and C04-, with the electrolyte solvents containing PF6- being the most thermodynamically stable against oxidation
(Figure 3). In this case, density functional theory (DFT) calculations indicate that a proton transfer between the solvent and the salt anion follows the oxidation of the electrolyte (Figure 3b).32",06
a
C
a
1
c1
M salt in PCLPF_1PC EC I C 0 10
P
PC + PC PC + + EC EC + + DMC DMC.+ +
~
1 42 Li Li+ Li+ Li4 Li- Li* Li4 -2 L....C..
w2
-2 0 =3-~' dOV; 4 PC EC DMC -4 %AsF PC PC C C ECE+CDMCM - LICIO4 6 PF B + BF, +- BF4 -6 7 DMC y E.P 10 0 2 4 6 8 10Storage Time (Days)
b AG AG -d G Sol+1e--+Sol V= e W1MLiPF-10 - PC E
0f
1:1 EC:DMC E a 3:1 EC:DECPC 2 M LiAsF, 2Me HF 1:1 EC:DMC
- + le- PC
a
DNIC107 E
AGV AG 3:1 EC:DEC
Sol -+ Sol+ 1e- V e =
--0 2 4 6 8 10
Storage Time (Days)
Figure 3. a) Computed oxidation and reduction potentials using density functional theory in Polarizable Continuum Model (PCM-SMD) of common Li-ion battery solvents and solvated salts, corresponding to EHOMO -eVox and ELUMO = -eVred. The values are converted from the absolute potential scale to the Li/Lie potential scale by subtracting 1.4 V.33 b) Reactions used to calculate the reduction and oxidation potentials. c) Impedance of surface films formed on lithium foil upon storage for various 1 M salt-based electrolytes in PC.71 d) Impedance of surface film on lithium
foil upon storage for 1 M LiAsF6 in various solvents.3 7,"'2
Although DFT calculations predict the electrolytes to be stable against oxidation below 5.5 VU, experimental studies show that carbonate-based electrolytes can be oxidized in the range
4.5-6.5 VLi.115-1 17 While the computed data reported in Figure 3 indicate clear trends, this simple,
solvent and the surface of the electrode.'07 It also disregards interactions that can exist between Li', anions, and the solvent together. Finally, this model does not take into account difference between the initial state and the transition state of the electron transfer process,118 which ultimately governs the actual rate of electrolyte decomposition and the SEI layer's composition.6 9
Oxidation or reduction of the electrolyte, described in Figure 3a,b, is only one pathway for the decomposition of the electrolyte. Chemical reactions, determined by thermodynamic and kinetics considerations, can follow upon or compete with the electron transfer and govern the formation of different chemical species and the SEI layer structure,119 as in the case of impurities.120-129
The SEI layer on the negative electrode
The composition and structure of the SEI on negative electrodes is heavily dependent on the material and surface orientation.
Lithium metal electrode
The SEI on lithium varies in chemical composition at different depths and is heavily influenced by the salt in the electrolyte. Peled first formally introduced the concept of a single layer SEI on alkali or alkaline earth metals (1979) and found its electronic and ionic properties were similar to a solid electrolyte, allowing the migration of Li' while electronically insulating.3 4 In 1983, Peled further refined the SEI to be a multilayer structure with a thin SEI compact layer close to the electrode with a thick porous secondary layer closer to the electrolyte. 30,3' In the 1990's, Peled et al. proposed the SEI on lithium to have mosaic-like structure3 5'3 9 based on impedance
measurements and previous multilayers models built through X-Ray Photoelectron Spectroscopy (XpS)11,132 and Fourier Transform Infrared Spectroscopy (FTIR)37
,71,121 studies by the Kanamura and Aurbach groups respectively. These authors showed that the SEI on lithium is a mixture of inorganic and organic electrolyte decomposition products 1,12124,32 arranged in multiple regions that formed by simple soaking of the electrolyte with the metal.34" 0 Near the electrolyte, the SEI
on lithium consists mainly of oligomer species (polyolefins) and semi-carbonates formed from the decomposition of the solvent molecules,37""11 while inorganic species like Li20, Li2CO3, and Li,
thermodynamically stable against lithium, are present closer to the Li surface.37,i Coupling several techniques, Aurbach's group studied the influence of several salts on the SEI formed on lithium soaked in electrolytes based on PC (Figure 3c,d).37,71,'2 Aurbach showed that changing the salt anion from C04- to PF6 can increase the total impedance by orders of magnitude (Figure
the impedance of lithium soaked with LiAsF6 and LiC104 stabilized more rapidly than LiPF6 and LiBF4 (Figure 3c)7 1, suggesting rapid formation of an electronically passivating SEI with AsF6-and CO4-. These results indicated that the decomposition of anions, which results in inorganic components in the SEI on lithium, strongly influences the impedance.7'
Graphite electrode
It is now well established that the SEI on graphite has a similar composition and microphase structure model to that on lithium foil, which was confirmed and refined in the past 20 years by Peled's group using XPS,70,133
,134
Aurbach's group using FTIR,3 7
,135
-139
and Ogumi's group using AFM (Atomic Force Microscopy) and STM (Scanning Tunneling Microscopy) 40-4 5. In the early 1990's, Dahn and coworkers38 were the first to propose ethylene carbonate (EC) as a solvent for graphite and to hypothesize the presence of a SEI layer on graphite electrodes. In contrast to PC, EC does not co-intercalate into the graphite and forms a stable SEI composed mainly of lithium ethylene dicarbonate146 which allows Li' diffusion into the SEI and thus reversible intercalation into the graphite electrode. While controversies over the chemical composition of the SEI remain within the community such as the presence of Li2CO31 4'14 7
or the distribution of LiF,148
there is general agreement on the multiphase structure of the SEI on graphite that we will described below. Examining a graphite composite electrode with micro-sized particles (containing both edge and basal planes) 49 using XPS, the Cls spectra (Figure 4a) confirm the presence of similar decomposition products to those detected on lithium metal and the 'mosaic' structure of the SEI. Close to the graphite, the SEI consists of inorganic compounds (Li20, Li2CO3, and Li-O-C), while the outermost surface of the SEI close to the electrolyte consists of lithium alkyl bicarbonates and oligomers (Figure 4a).149 Combined XPS and impedance analyses of the SEI on graphite have demonstrated that the organic species of the outer layer originate at higher voltages whereas inorganic components such as Li2CO3 and Li20 form below 0.3 VU." 0 The organic species have a higher ionic impedance than Li2CO3 and Li20, and thus, as the voltage is lowered with respect to Li, the impedance per unit thickness decreases due to the formation of more Li2CO3 and Li20.15 0
Semicarbonate Li-O-C Semicarbonate LI-O-C
a
Carbonate Oligomer LiC6b
Li 2 UF Carbonate OligomerOligomer Li Electrolyte Electrode Basal HOPG 0 min Edge 20 min 430eV
Graphite Electrolyte Electrod Edge
Powder 0 min 6900 eV 20 min Graphite 47 nm Powder 292 288 284 280 292 288 284 280
Binding Energy (eV) Binding Energy (eV)
Figure 4. a) X-ray photoelectron spectroscopy of a composite graphite electrode. The different depths are obtained by tuning the incident photon energy.149 b) Left, schematic of the SEI on basal (top) and edge (bottom) planes. Right, XPS Cl s data from HOPG basal and edge electrodes cycled in 1 M LiAsF6 in 1:2 v/v EC:DEC, showing the presence of mostly oligomers on the basal plane and of a mix of carbonates, semicarbonate and oligomers on the edge.
The SEI of the graphite composite electrode, the surface of which should be a mixture of basal and edge planes, has a similar chemical composition to the edge plane of the highly ordered pyrolytic graphite (HOPG) electrode,' 3 thus revealing that the SEI on graphite is mainly dominated by the formation of the SEI on the edge sites (Figure 4). Based on Peled's work, 3'1 33"134 the difference in composition and thickness between the SEI of the basal and edge plane orientations is shown in Figure 4b. On edge plane, the SEI consists of mostly inorganic compounds that originate from salt reduction, while the SEI on the basal plane is more organic due to solvent reduction.13,133,134 Comparing CIs XPS spectra of edge and basal plane after cycling, we can clearly see that the outermost surface of the basal SEI (Figure 4b, no Ar sputtering, 0 min) consists mainly of oligomers (- 65%) and a small amount of carbonates (- 13%), while the edge SEI consists of both carbonates and semicarbonates (- 32%), and oligomers (32%).13 In both cases, depth profiles (after Ar sputtering, 20 min) demonstrate that the distribution of products shifts from organic products to inorganic species like Li20, As, Li2CO3, and Li-O-C (LiOCH3 or LiOCH2CH3)
the electrode surface, the LiF atomic concentration in the edge SEI rises to almost 70% compared to 50% for basal SEI, confirming the predominance of salt decomposition on the edge."3 In addition, the SEI on the basal plane is 3-5 times thinner than on the edge plane (Figure 4b),13 4 however, thickness measurements of the SEI on HOPG by AFM show the SEI thickness on edge plane only slightly increases after the first cycle, while the SEI continues to grow on the basal plane upon cycling, denoting the stability and efficiency of the SEI layer on the edge plane.'40"4' While the charge transfer resistance, related to the intercalation of Li' into the material, significantly decreases when the fraction of edge planes increases, no significant difference in the impedance related to the SEI is observed."'
The origin of the difference in composition of the SEI between the basal and edge SEI has yet to be resolved conclusively, but could be based on the preferential availability of salt anions at the edge plane, which are weakly bonded to the solvated Li cations that intercalate into the graphite at the edge plane,33
as Li' solely intercalate through the edge.52
After intercalation in the graphite, the remaining anions from the salt are close to the edge planes and can be directly decomposed to form inorganic species like LiF, detected in large amount in the SEI on edge planes. On the contrary, the basal planes are exposed to fewer unsolvated salt molecules and more "non-coordinated" solvent molecules14 3
and thus lead to the formation of organic compounds.
In addition, the transfer of electrons on basal and edge sites might also affect the nature of decomposition reactions of the electrolyte. Faster electron transfer on the edge plane'5 3-155 could explain the decomposition of the electrolyte via one or two electron process reactions, while on the basal plane, where the electron transfer is slower, chemical reactions which do not involve electron transfer with the surface would preferentially occur. For example, after the first electron transfer described in Figure 3a-b, cyclic carbonates can undergo ring opening leading to the formations of radicals,3004 which further combine to form lithium ethylene dicarbonate (LEDC)2 or lithium butylene dicarbonate (LBDC)3 0 in the case of EC. One other decomposition path for EC is the two electron solvent reduction leading to the formation of Li2CO3 with C2H4 evolution.42
,57 In addition, after the electron transfer (Figure 3a,b), the radical linear carbonate solvents can attack other solvent molecules to form Li-alkoxides and Li2CO3.158'159 These reactions involving electron transfer may explain the larger amount of carbonates and alkoxides detected on the edge compared to basal."3 In contrast, the predominance of oligomers on the basal plane could arise from the polymerization of cyclic carbonate such as EC, 160,161
requiring no electrons but rather initiated by a strong Lewis acid like PFs.'60,"6' Due to their long carbon chains, we can infer that the access of oligomers to the edge plane is also hindered.
Thus, due to the availability of solvated lithium cations and faster electron transfer at the edge site, we expect the edge SEI to contain more inorganic products and the basal SEI to contain more organic products.
Tin electrode
Following the studies done on graphite electrodes, recent work utilizing model systems and synchrotron radiation has attempted to link the crystal orientation of high capacity alloying materials such as tin (Sn) 62
,163 (Figure 5) and silicon (Si) 64
165 with the chemical composition and structure of the SEI layer. For the tetragonal f-Sn electrode, the (001) surface leads to a thin SEI layer (Figure 5c) composed mostly of inorganic compounds like LiF originating from salt decomposition with a small amount of carbonates, while the (100) plane SEI is thicker and rougher, and consists of mostly porous carbonates (Figure 5c).162,163,161 Similarly, the SEI on the Si(100) is mainly composed of LiF while the SEI layer on the Si(1 11) surface consists of a mixture of carbonates.164
The difference in composition could be explained by difference in surfaces; the Sn(001) surface energy is 1.25 times higher than the Sn(100) and the Sn(001) surface is rougher than the (100) surface (Figure 4a,b).166 In fact, the higher energy (001) surface may catalyze the decomposition of LiPF6 to form LiF while the (100) surface lacks significant surface energy to drive the decomposition and can only reduce the electrolyte to form carbonate species.162
This would suggest that a stable SEI only forms on the Sn(00 1) surface that is electronically passivated by LiF while no electronic passivation occurs on the Sn( 100) surface formed of porous carbonate, leading to continued consumption of the electrolyte. Therefore, while LiF has a high ionic resistance to lithium, its formation is more desirable than the more ionically conductive porous carbonate. However, these results must be analyzed cautiously. In the Sn study the potential was never reduced to the Li-Sn alloying potential (onset potential ~ 0.6 VU), therefore secondary/altering reactions may occur during lithiation and change the SEI chemical composition and structure. Indeed, whereas the majority of the SEI is almost exclusively generated on the first few cycles in graphite electrodes, in the case of alloying electrodes, the SEI is generated continuously through repeated volume expansion and contraction of the material (up to 300%),167 upon lithiation and delithiation exposing new active sites and different LixMy surfaces.68",68 This