[13:10 22/10/2009 Bioinformatics-btp524.tex] Page: 3028 3028–3030
BIOINFORMATICS
APPLICATIONS NOTE
Vol. 25 no. 22 2009, pages 3028–3030doi:10.1093/bioinformatics/btp524Systems biology
CellClassifier: supervised learning of cellular phenotypes
Pauli Rämö, Raphael Sacher, Berend Snijder, Boris Begemann and Lucas Pelkmans
∗ Institute of Molecular Systems Biology, ETH Zürich, HPT E71, Wolfgang Pauli-Str. 16, 8093 Zürich, Switzerland Received on May 13, 2009; revised on August 3, 2009; accepted on August 28, 2009Advance Access publication September 2, 2009 Associate Editor: Olga Troyanskaya
ABSTRACT
Summary: CellClassifier is a tool for classifying single-cell phenotypes in microscope images. It includes several unique and user-friendly features for classification using multiclass support vector machines
Availability: Source code, user manual and
SaveObjectSegmen-tation CellProfiler module available for download at www .cellclassifier.ethz.ch under the GPL license (implemented in Matlab).
Contact: [email protected]
Supplementary information: Supplementary data are available at
Bioinformatics online.
1 INTRODUCTION
Image-based screens of mammalian tissue culture cells are widely performed in laboratories around the world. Various methods for computational data analysis and quantification of morphological single-cell phenotypes have been developed (Bakal et al., 2007; Boland and Murphy, 2001; Boutros et al., 2006; Carpenter et al., 2006; Young et al., 2008). A recently released tool called CellProfiler Analyst performs supervised learning of cellular phenotypes using extracted measurements (Jones et al., 2008). The importance of such tools cannot be understated. They allow cell biologists to adopt modern statistical methods in order to find and quantify single-cell phenotypes and reveal new functions of genes. In fact, these tools enable quantitative analyses of large-scale screens at the single-cell level (Pelkmans et al., 2005; Sacher et al., 2008). However, it will be imperative that these tools are easy-to-install and provide a user-friendly experience to cell biologists who are not familiar with programming. Furthermore, it will be essential that such tools allow cell biologists to apply machine learning in a setting with which they are most familiar and in which they have been trained to observe cellular phenotypes: the view that a microscope gives of an individual cell within its natural context.
To meet these requirements, we created CellClassifier as another tool for supervised learning. CellClassifier is the result of a tight collaboration between computational scientists and cell biologists and contains several powerful and user-friendly features not available in CellProfiler Analyst. First of all, CellClassifier can display the original microscope images interactively, so that each cell is recognized and made ‘clickable’. Therefore, the cell biologist can easily annotate each cell within an image, find rare phenotypes within a population and observe if certain single-cell phenotypes ∗To whom correspondence should be addressed.
depend on the population context of that cell (Snijder et al., 2009). Second, CellClassifier allows the user to change the machine learning algorithm to classify a dataset. By default, CellClassifier uses multi-class machine learning algorithms based on support vector machines (SVMs) and implemented in the Stprtool toolbox (Franc, 2000; Schlesinger and Hlavac, 2002). SVMs are proven to be efficient algorithms for supervised learning in empirical studies (Caruana and Niculescu-Mizil, 2006). Other supported classifier algorithms are multilinear perceptrons and k-nearest neighbors. In addition, developers can easily adapt CellClassifier to incorporate new or custom-designed machine learning algorithms in the future. Third, CellClassifier displays ratios of correctly or incorrectly classified cells during the course of training to evaluate the classification performance and its improvement through training iterations. Finally, CellClassifier can export classification results at the single-cell level to MatLab-readable files and create summaries of classified cells for further analysis with standard spreadsheet programs.
2 FEATURES
CellClassifier requires that the images are first analyzed with CellProfiler, which is a widely used tool for the computational image analysis of microscope images (Carpenter et al., 2006). Within the CellClassifier package, we provide a new CellProfiler module called SaveObjectSegmentation. The module saves the outlines of the detected objects as images. These outlines can later be visualized in CellClassifier and are essential for correct cell classification.
A typical workflow (Fig. 1) starts by loading a CellProfiler output file. CellClassifier automatically detects all objects and measured features for each object in all available channels. Each detected object is marked with a dot, and, if preferred, the segmented object outlines can be drawn in the image. The color-rescaling algorithm allows the user to display up to seven channels at the same time and to set-up colors, so that different phenotypes can be clearly seen by eye. Important meta-information for each image, such as the location of the image in a multi-well plate or the corresponding gene or small compound name, can be easily extracted using the tool. In CellClassifier, every detected cell is an interactive object and can be assigned to a phenotype class by clicking on the cell. After having manually annotated a certain number of cells (usually 50–100 cells per class), the user can train the classifier and classify all cells (up to millions) in the screen. The second phase of iterative training consists of correcting misclassified cells and retraining the classifier with the improved training set. The training set can be fine-tuned with the phenotype panels, which show arrays of randomly selected
[13:10 22/10/2009 Bioinformatics-btp524.tex] Page: 3029 3028–3030
CellClassifier
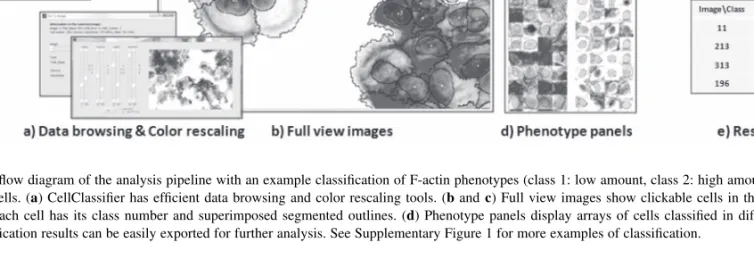
Fig. 1. A flow diagram of the analysis pipeline with an example classification of F-actin phenotypes (class 1: low amount, class 2: high amount of F-actin)
in A431 cells. (a) CellClassifier has efficient data browsing and color rescaling tools. (b and c) Full view images show clickable cells in their population context. Each cell has its class number and superimposed segmented outlines. (d) Phenotype panels display arrays of cells classified in different classes. (e) Classification results can be easily exported for further analysis. See Supplementary Figure 1 for more examples of classification.
cells from each class. Misclassified cells can be easily detected in such comparative panels and reannotated to the correct class. A detailed user manual containing information on all CellClassifier features can be downloaded at www.cellclassifier.ethz.ch.
‘To show an example of the wide range of possible applications of CellClassifier, we analyzed different phenotypes of interest in four RNAi screens. The screens were carried out by cell biologists to identify genes involved in clathrin-mediated endocytosis (using fluorescent Transferrin), the formation of stress granules (by staining with an antibody against PABP), apoptosis and mitosis (by training typical nuclear morphologies using DAPI) and the filamentous actin cytoskeleton (stained with fluorescent phalloidin). Images of phenotype cells and the classification results are illustrated in Supplementary Figure S1. The classification results show that CellClassifier is able to distinguish between complex cellular phenotypes with high classification accuracies. Overall, SVMs have the best classification accuracies, although for some specific examples, multilinear perceptrons (LIN) may perform better. The inferred rule-sets of each classification algorithm can be exported for further analysis. In particular, these rule-sets can be used to quantify which combinations of cellular features are the most important for the separation of different classes. In the future, new machine learning algorithms that combine both high classification accuracy and easy rule-set interpretation can be added to CellClassifier.
3 SUMMARY
CellClassifier is a tool for supervised cell classification in large-scale image-based screens. Computational methods are the only way to quantify single-cell phenotypes in large-scale screens. CellClassifier is small and light and does not require complicated database structures. Moreover, it is designed to be easy to use by cell biologists with no experience in mathematics or programming. CellClassifier fully supports the iterative supervised training approach and smoothly guides the user to obtain high-quality training sets using full field images and phenotype panels. The state-of-the-art SVM algorithms guarantee that the learning results are of the
highest possible quality, and the possibility to use other machine learning algorithms provides flexibility. The powerful visualization and browsing tools make CellClassifier an excellent tool for data browsing in image-based screens. Finally, the classification results can be easily exported for further analysis. We have shown the power of the tool by classifying phenotypes in four unrelated activities of mammalian cells, assayed with different experimental methods. In all cases, CellClassifier enabled cell biologists with no prior training in computer programming to quickly and easily achieve excellent classification results.
ACKNOWLEDGEMENTS
We thank the members of the Pelkmans Laboratory for their data and helpful comments as well as for testing the software.
Funding: European Molecular Biology Organization (to P.R.); the
Human Frontier Science Program (to P.R.); the Swiss National Science Foundation (to R.S. and L.P.); ETH Zurich (to B.S. and L.P.).
Conflict of Interest: none declared.
REFERENCES
Bakal,C. et al. (2007) Quantitative morphological signatures define local signaling networks regulating cell morphology. Science, 316, 1753.
Boland,M.V. and Murphy,R.F. (2001) A neural network classifier capable of recognizing the patterns of all major subcellular structures in fluorescence microscope images of HeLa cells. Bioinformatics, 17, 1213–1223.
Boutros,M. et al. (2006) Analysis of cell-based RNAi screens. Genome Biol., 7, R66. Carpenter,A.E. et al. (2006) CellProfiler: image analysis software for identifying and
quantifying cell phenotypes. Genome Biol., 7, R100.1–R100.11.
Caruana,R. and Niculescu-Mizil,A. (2006) An empirical comparison of supervised learning algorithms. In Proceedings of the 23rd International Conference on
Machine Learning. Vol. 148 of ACM International Conference Proceeding Series.
Pittsburgh, Pennsylvania, pp. 161–168.
Franc,V. (2000) Pattern recognition Toolbox for Matlab. MSc Thesis. Czech Technical University in Prague.
[13:10 22/10/2009 Bioinformatics-btp524.tex] Page: 3030 3028–3030
P.Rämö et al.
Jones,T.R. (2008) CellProfiler analyst: data exploration and analysis software for complex image-based screens. BMC Bioinformatics, 9, 1.
Pelkmans,L. et al. (2005) Genome-wide analysis of human kinases in clathrin- and caveolae/raft-mediated endocytosis. Nature, 436, 78–86.
Sacher,R. et al. (2008) Lessons from genetics: interpreting complex phenotypes in RNAi screens. Curr. Opin. Cell. Biol., 4, 483–489.
Schlesinger,M.I. and Hlavac,V. (2002) Ten Lectures on the Statistical and Structural
Pattern Recognition. Kluwer Academic Publishers, Dordrecht, The Netherlands.
Snijder,B. et al. (2009) Population context determines cell-to-cell variability in endocytosis and virus infection. Nature [Epub ahead of print, doi:10.1038/nature08282, August 26, 2009].
Young,D.W. et al. (2008) Integrating high-content screening and ligand-target prediction to identify mechanism of action. Nat. Chem. Biol., 4, 1.