1
Synthesis, Characterisation and Biological Evaluation of
π-Extended Fe(II) Bipyridine Complexes as Potential
Photosensitizers for Photodynamic Therapy
Johannes Kargesa, and Gilles Gassera,*
a Chimie ParisTech, PSL University, CNRS, Institute of Chemistry for Life and Health Sciences, Laboratory for Inorganic Chemical Biology, 75005 Paris, France.
*Email: gilles.gasser@chimieparistech.psl.eu; Tel. +33 1 44 27 56 02.
ORCID-ID:
Johannes Karges: 0000-0001-5258-0260 Gilles Gasser: 0000-0002-4244-5097
Keywords:
Anticancer, Bioinorganic Chemistry, Medicinal Inorganic Chemistry, Metals in Medicine, Photodynamic Therapy.
ABSTRACT
Photodynamic therapy (PDT) has received increasing attention over the recent years to treat a variety of cancers. The use of metal complexes as PDT agents is currently a highly investigated alternative due to the attractive chemical and photophysical properties of these compounds. However, most of the metal complexes studied so far are based on rare metals, limiting their use since these metals are neither cheap nor abundant. It would be therefore of high interest to develop compounds based on a cheap, abundant metal. Having this in mind, we designed Fe(II) polypyridine complexes with an absorption in the biological spectral window (600 – 900 nm) through extension of the π-system. Importantly, the complexes were found to be stable in human plasma and upon light irradiation. A cytotoxic effect in the micromolar range in the dark and a slight effect upon exposure to irradiation at 480 and 540 nm in cancerous human cervical carcinoma (HeLa) cells was observed.
Highlights:
- Synthesis and characterisation of three π-extended Fe(II) polypyridine complexes. - Investigations of the use of these compounds as chemotherapeutic and photodynamic
therapy agents.
- Photophysical studies studied revealed absorption in the biological spectral window. - (Photo-)cytotoxicity of the metal complexes in cancerous human cervical carcinoma
3 Graphical Abstract:
1. Introduction
Nowadays, cancer is one of the deadliest diseases worldwide. Its treatment commonly involves chemotherapy, radiotherapy, surgery or immunotherapy. These methods are also combined to overcome the limitations of a single treatment and to improve the chances of survival of a patient.1, 2 As the most frequently employed chemotherapeutic agents in the clinics, cisplatin (cis-diamminedichloridoplatinum(II)) and its platinum-based derivatives carboplatin and oxaliplatin are used all around the world. Despite their impressive ability, these compounds are associated with a low cancer cell selectivity and severe side effects, which include nerve and kidney damage, nausea, vomiting and bone marrow suppression. In addition, tumours are able to acquire a resistance against these compounds, limiting their application. To overcome these drawbacks, much research efforts are devoted towards the development of alternative compounds. Among these, metal complexes are extensively studied due to their interesting properties, which include ligand exchange reactions, redox or catalytic properties.3-6
Complementary to chemotherapy, the use of photodynamic therapy (PDT) has expanded the possibilities to treat tumours and is currently employed for different kinds of cancers (i.e. lung, bladder, esophageal, brain cancer). During a PDT treatment, a (preferably non-toxic) photosensitizer (PS) is excited upon irradiation at a specific wavelength to generate different kinds of reactive oxygen species (ROS). These are able to react very quickly with their biological surrounding to trigger cell death.7-12 To date, the majority of clinically approved and investigated PSs are based on a tetrapyrrolic scaffold, implying that similar drawbacks (i.e. poor water solubility, photodegradation and slow clearance from the body causing photosensitivity) are often observed.13-18 Consequently, there is a need for the development of new classes of PSs. Among others, the use of metal complexes as PDT PSs is currently a highly investigated alternative due to the attractive chemical and photophysical properties of these compounds (e.g., high 1O2 production, high water solubility, high chemical and photochemical stability). A major aim in the development of metal-containing PDT PSs is the tuning of their absorption towards the biological spectral window (600-900 nm). A treatment in this spectral range would allow a decrease of potential damage caused by light as well as enabling a deeper penetration depth. This would be of particular interest for the treatment of deep seated or large tumours, which are nowadays still a challenge. To overcome this limitation, compounds with a strong absorption in the biological spectral window are sought after.19-23
To date, the most studied metals in this context are Ru(II)24-31, Os(II)32-34, Rh(III)35-37 Re(I)38-42 and Ir(III)43-50. Since these metals are not abundant and expensive, it would of high interest to
5
develop compounds based on a cheap and abundant metals. Towards this aim, we have for example recently reported Zn(II) complexes as efficient PDT agents.51 Alternatively, Fe complexes have gained attention due to their reduced metal-induced cellular toxicity and bioavailability. However, it is well known that Fe complexes are weakly emissive and have excited states with extremely short lifetimes. This is caused by the fast depopulation of 3MLCT state to the 3MC and 5MC state.52, 53 Nevertheless, there have been several reports on the successful use of Fe complexes as PDT PSs. Worthy of note, Fe complexes with the oxidation state +III have been studied more extensively than complexes with a +II state. Roelfes et al. have developed Fe(II)-N4Py complexes (N4Py = N,N-bis(2-pyridylmethyl)-N-bis(2-pyridyl)methylamine) as DNA photocleavaging agents. Of particular interest are the Fe(III) complexes with a dipyrido[3,2-d:2´,3´-f]quinoxaline54-56 or a dipicolylamine57-65 moiety designed by Chakravarty et al. The compounds showed no dark toxicity and a highly increased toxicity in the low micromolar range upon light exposure. Importantly, they were able to design compounds with an absorption in the phototherapeutic window.58 Selective tumour delivery of the PS was reported through the conjugation of the PS to biotin.66 At our end, we have recently reported Fe(II) complexes with 4,7-diphenyl-1,10-phenanthroline ligands as well as their sulfonic acid derivatives. The [Fe(4,7-diphenyl-1,10-phenanthroline)]2+ complex was found to have a cytotoxic effect in the low micromolar range in the dark as well as some phototoxicity upon irradiation at 480 and 540 nm against RPE-1 and HeLa cells.67
To overcome the limitations of the currently approved PSs and inspired by the works described above, we have investigated the potential of Fe(II) polypyridine complexes. With the aim to develop complexes with an absorption in the biological spectral window, the π-system of the ligand was extended (1, Figure 1) since previous studies on metal complexes have shown that increase of the conjugated system was able to enhance this property.68, 69 In addition, derivatives with terminal -OMe and NMe2 groups (2-3, Figure 1) were investigated since previous studies on Ru(II) polypyridine complexes70, 71 have shown that these groups were able to red shift the absorption of the complexes. As described below, the compounds were found to have a strong absorption in the biological spectral window. Herein, the synthesis and in-depth photophysical and biological evaluation of these Fe(II) polypyridine complexes as chemotherapeutic and PDT agents is presented.
Figure 1. Molecular structures of the compounds 1-3 investigated in this work. The compounds were isolated as PF6- (1a-3a) and Cl- (1b-3b) salts.
2. Experimental section 2.1. Materials
All chemicals were obtained from commercial sources and used without further purification. The ligands (E,E’)-4,4´-bisstyryl-2,2´-bipyridine, (E,E’)-4,4´-bis[p-methoxystyryl]-2,2´-bipyridine and (E,E’)-4,4´-bis[p-(N,N-dimethylamino)styryl]-2,2´-(E,E’)-4,4´-bis[p-methoxystyryl]-2,2´-bipyridine were synthesised as previously reported.72, 73 The solvents used were dried over molecular sieves. Dulbecco’s Modified Eagles Medium (DMEM), Dulbecco’s Modified Eagles Medium supplemented with nutrient mixture F-12 (DMEM/F-12), Fetal Bovine Serum (FBS), Gibco Penicillin-Streptomycin-Glutamine (Penstrep), Dulbecco’s Phosphate-Buffered Saline (PBS) were purchased from Fisher Scientific and Resazurin from ACROS Organics.
2.2. Instrumentation and methods
1H and 13C NMR spectra were recorded on a Bruker 500 MHz NMR spectrometer. Chemical shifts (δ) are reported in parts per million (ppm) referenced to tetramethylsilane (δ 0.00) ppm using the residual proton solvent peaks as internal standards. Coupling constants (J) are reported in Hertz (Hz) and the multiplicity is abbreviated as follows: s (singlet), d (doublet) and m (multiplet). ESI-MS experiments were carried out using a LTQ-Orbitrap XL from Thermo Scientific and operated in positive ionization mode, with a spray voltage at 3.6 kV. No Sheath
7
and auxiliary gas was used. Applied voltages were 40 and 100 V for the ion transfer capillary and the tube lens, respectively. The ion transfer capillary was held at 275°C. Detection was achieved in the Orbitrap with a resolution set to 100,000 (at m/z 400) and a m/z range between 150-2000 in profile mode. Spectrum was analyzed using the acquisition software XCalibur 2.1 (Thermo Fisher Scientific). The automatic gain control (AGC) allowed accumulation of up to 2.105 ions for FTMS scans, Maximum injection time was set to 300 ms and 1 µscan was acquired. 10 µL was injected using a Thermo Finnigan Surveyor HPLC system (Thermo Fisher Scientific) with a continuous infusion of methanol at 100 µL.min-1. Elemental microanalyses were performed on a Thermo Flash 2000 elemental analyser. For analytic HPLC the following system has been used: 2 x Agilent G1361 1260 Prep Pump system with Agilent G7115A 1260 DAD WR Detector equipped with an Agilent Pursuit XRs 5C18 (100Å, C18 5 μm 250 x 4.6 mm) Column and an Agilent G1364B 1260-FC fraction collector. The solvents (HPLC grade) were millipore water (0.1% TFA, solvent A) and acetonitrile (0.1% TFA, solvent B).
2.3. Synthesis
[Fe((E,E’)-4,4´-Bisstyryl-2,2´-bipyridine)3][PF6]2 (1a)
(E,E’)-4,4´-Bisstyryl-2,2´-bipyridine (500 mg, 1.39 mmol, 4.0 equiv.) and FeCl2 . 4 H2O (69 mg, 0.35 mmol, 1.0 equiv.) were suspended in dry ethanol (150 mL) under nitrogen atmosphere and the mixture was refluxed for 24 h. The solution was then cooled down and undissolved residue was removed via filtration. A sat. aqueous solution of NH4PF6 was added to the residual solution. The crude product, which precipitated as a PF6- salt, was collected by centrifugation and washed with ethanol, H2O and Et2O. The residue was dissolved in dichloromethane and washed with a 5% LiCl aqueous solution, brine and H2O. After drying under vacuum, 285 mg of 1 (0.20 mmol, 57 %) was obtained as a violet solid. 1H-NMR (CD3CN, 500 MHz): δ = 8.78 (d, 3J = 1.8 Hz, 6H, H3), 7.80 (d, 3J = 16.5 Hz, 6H, H8), 7.71-7.69 (m, 12H, H11), 7.51-7.44 (m, 24H, H5, H6, H10), 7.44-7.40 (m, 6H, H12), 7.34 (d, 3J = 16.5 Hz, 6H, H7). 13 C-NMR (CD3CN, 125 MHz): δ = 160.3 (C2), 154.9 (C6), 148.5 (C4), 137.6 (C8), 136.8 (C9), 130.7 (C12), 130.1 (C10), 128.5 (C11), 125.4 (C5), 125.0 (C7), 121.2 (C3). ESI-HRMS (pos. detection mode): calcd for C78H60N6Fe m/z [M]2+ 568.2109; found: 568.2118. Elemental analysis calcd for C78H60F12FeN6P2 (%): C 65.65, H 4.24, N 5.89; found: C 65.59, H 4.34, N 5.92.
[Fe((E,E’)-4,4´-Bisstyryl-2,2´-bipyridine)3][Cl]2 (1b)
[Fe((E,E’)-4,4´-Bisstyryl-2,2´-bipyridine)3][PF6]2 (1a) was charged on the ion exchange resin Amberlite IRA-410. The complex was eluted using MeOH. Elemental analysis calcd for C78H60Cl2FeN6 (%): C 77.55, H 5.01, N 6.96; found: C 77.49, H 4.85, N 6.84.
[Fe((E,E’)-4,4´-Bis[p-methoxystyryl]-2,2´-bipyridine)3][PF6]2 (2a)
(E,E’)-4,4´-Bis[p-methoxystyryl]-2,2´-bipyridine (750 mg, 1.78 mmol, 4.0 equiv.) and FeCl2 . 4 H2O (89 mg, 0.45 mmol, 1.0 equiv.) were suspended in dry EtOH (100 mL) under nitrogen atmosphere. The mixture was refluxed for 15 h. The solution was then cooled down and a sat. aqueous solution of NH4PF6 was added to the mixture. The crude product, which precipitated as a PF6- salt, was collected via filtration. The solid was washed with H2O and Et2O. The residue was dissolved in CH3CN and undissolved solid was removed by filtration. The solvent was removed under reduced pressure and the residue was dissolved in dichloromethane. The mixture was washed with a 5% LiCl aqueous solution, brine and H2O. After drying under vacuum, 493 mg of 2 (0.31 mmol, 69 %) was obtained as a violet solid. 1H-NMR (CD3CN, 500 MHz): δ = 8.77 (s, 6H, H3), 7.77 (d, 3J = 16.3 Hz, 6H, H8), 7.64 (d, 3J = 8.7 Hz, 12H, H10), 7.45 (d, 3J = 6.0 Hz, 6H, H5), 7.41 (d, 3J = 6.0 Hz, 6H, H6), 7.18 (d, 3J = 16.3 Hz, 6H, H7), 7.01 (d, 3J = 8.7 Hz, 12H, H11), 3.83 (s, 18H, H14). 13C-NMR (CD3CN, 125 MHz): δ = 162.0 (C12), 160.3 (C2), 154.6 (C6), 148.9 (C4), 137.2 (C8), 130.1 (C10), 129.4 (C9), 125.0 (C5), 122.7 (C7), 120.9 (C3), 115.5 (C11), 56.2 (C14). ESI-HRMS (pos. detection mode): calcd for C84H72N6O6Fe m/z [M]2+ 658.2426; found: 658.2435. Elemental analysis calcd for C84H72F12N6O6P2Fe + 3 H2O (%): C 60.73, H 4.73, N 5.06; found: C 60.39, H 4.35, N 5.15.
[Fe((E,E’)-4,4´-Bis[p-methoxystyryl]-2,2´-bipyridine)3][Cl]2 (2b)
[Fe((E,E’)-4,4´-Bis[p-methoxystyryl]-2,2´-bipyridine)3][PF6]2 (2a) was charged on the ion exchange resin Amberlite IRA-410. The complex was eluted using MeOH. Elemental analysis calcd for C84H72Cl2FeN6O6 (%): C 72.67, H 5.23, N 6.05; found: C 72.40, H 5.34, N 5.87.
9
[Fe((E,E’)-4,4´-Bis[p-(N,N-dimethylamino)styryl]-2,2´-bipyridine)3][PF6]2 (3a)
(E,E’)-4,4´-Bis[p-(N,N-dimethylamino)styryl]-2,2´-bipyridine (327 mg, 0.73 mmol, 6.0 equiv.), FeCl2 . 4 H2O (24 mg, 0.12 mmol, 1.0 equiv.) and LiCl (254 mg, 6.00 mmol, 50.0 equiv.) were suspended in dry DMF (30 mL) under nitrogen atmosphere. The mixture was refluxed for 44 h. The solution was then cooled down and a sat. aqueous solution of NH4PF6 was added to the mixture. The crude product, which precipitated as a PF6- salt, was collected by filtration and washed with H2O and Et2O. The residue was purified via fractionated precipitation from CH3CN by adding dropwise Et2O. The product was isolated by recrystallization from dichloromethane/pentane. 134 mg of 3 (0.08 mmol, 67 %) was obtained as a black solid. 1H-NMR (CD3CN, 400 MHz): δ = 8.65 (s, 6H, H3), 7.69 (d, 3J = 16.2 Hz, 6H, H8), 7.54 (d, 3J = 8.8 Hz, 12H, H10), 7.38 (d, 3J = 6.1 Hz, 6H, H5), 7.34 (d, 3J = 6.1 Hz, 6H, H6), 7.04 (d, 3J = 16.2 Hz, 6H, H7), 6.79 (d, 3J = 8.8 Hz, 12H, H11), 3.01 (s, 36H, H14). 13 C-NMR (CD3CN, 100 MHz): δ = 160.2 (C2), 154.3 (C6), 152.7 (C12), 149.2 (C4), 138.0 (C8), 130.0 (C10), 124.4 (C5), 123.3 (C9), 120.3 (C3), 119.6 (C7), 113.2 (C11), 40.4 (C14). ESI-HRMS (pos. detection mode): calcd for C90H90N12Fe m/z [M]2+ 697.33749; found: 697.33802. Elemental analysis calcd for C90H90F12FeN12P2 + 2.5 H2O (%): C 62.79, H 5.50, N 9.76; found: C 62.59, H 5.15, N 9.83.
[Fe((E,E’)-4,4´-Bis[p-(N,N-dimethylamino)styryl]-2,2´-bipyridine)3][Cl]2 (3b)
[Fe((E,E’)-4,4´-Bis[p-(N,N-dimethylamino)styryl]-2,2´-bipyridine)3][PF6]2 (3a) was charged on the ion exchange resin Amberlite IRA-410. The complex was eluted using MeOH. Elemental analysis calcd for C90H90Cl2FeN12 (%): C 73.71, H 6.19, N 11.46; found: C 73.53, H 5.91, N 11.20.
2.4. Spectroscopic measurements
The absorption of the samples has been measured with a SpectraMax M2 Spectrometer (Molecular Devices). The emission was measured by irradiation of the sample in fluorescence quartz cuvettes (width 1 cm) using a NT342B Nd-YAG pumped optical parametric oscillator (Ekspla) at 355 nm. Luminescence was focused and collected at right angle to the excitation pathway and directed to a Princeton Instruments Acton SP-2300i monochromator. As a detector, a XPI-Max 4 CCD camera (Princeton Instruments) has been used.
2.5. Luminescence quantum yield measurements
For the determination of the luminescence quantum yield, the samples were prepared in a non-degassed CH3CN solution with an absorbance of 0.1 at 355 nm. This solution was irradiated in fluorescence quartz cuvettes (width 1 cm) using a NT342B Nd-YAG pumped optical parametric oscillator (Ekspla) at 355 nm. The emission signal was focused and collected at right angle to the excitation pathway and directed to a Princeton Instruments Acton SP-2300i monochromator. As a detector, a XPI-Max 4 CCD camera (Princeton Instruments) has been used. The luminescence quantum yields were determined by comparison with the reference [Ru(bipy)3]Cl2 in CH3CN (Φem=5.9%)74 applying the following formula:
Φem, sample = Φem, reference * (Freference / Fsample) * (Isample / Ireference) * (nsample / nreference)2 F = 1 – 10-A
Φem = luminescence quantum yield, F = fraction of light absorbed, I = integrated emission intensities, n = refractive index, A = absorbance of the sample at irradiation wavelength.
2.6. Stability in CH3CN
The stability of the compounds in CH3CN was determined by UV/Vis spectroscopy. The compound was dissolved and stored at room temperature in the dark. The absorption spectrum from 250-700 nm was recorded with a SpectraMax M2 Microplate Reader (Molecular Devices) after each time interval (0, 4, 8, 12, 24, 48 h) and compared.
2.7. Stability in human plasma
The stability of the complexes was evaluated with caffeine as an internal standard, which has already been shown to be suitable for these experiments.75 The pooled human plasma was obtained from Biowest and caffeine from TCI Chemicals. Stock Solutions of the compounds (20 μM) and caffeine (40 μM) were prepared in DMSO. One aliquot of the solutions was added to 975 μL of human plasma to a total volume of 1000 μL. Final concentrations of the compounds of 0.25 μM and caffeine of 0.5 μM were achieved. The resulting solution was incubated for 48 h at 37 °C with continuous gentle shaking (ca. 300 rpm). After this time, the incubation was
11
stopped by addition of 3 mL of methanol. The mixture was centrifuged for 60 min at 3000 rpm at 4 °C. The methanolic solution was filtered through a 0.2 μm membrane filter. The solvent was evaporated under reduced pressure and the residue was dissolved in 1:1 (v/v) CH3CN/ H2O 0.1% TFA solution. The solution was filtered through a 0.2 μm membrane filter and analyzed using a HPLC System. The solvents (HPLC grade) were millipore water (0.1% TFA, solvent A) and acetonitrile (solvent B). Method: 0-3 minutes: isocratic 50% A (50% B); 3- 17 minutes: linear gradient from 50% A (50% B) to 0% A (100% B); 17-23 minutes: isocratic 0% A (100% B). The flow rate was 1 mL/min and the chromatogram was detected at 250nm.
2.8. Photostability
The samples were prepared in an air-saturated CH3CN solution with an absorbance of about 0.5 at 450 nm. To measure the photostability, the samples were irradiated at 450 nm in 96 well plates with an Atlas Photonics LUMOS BIO irradiator during time intervals from 0-10 min. The absorbance spectrum from 350-700 nm was recorded with a SpectraMax M2 Microplate Reader (Molecular Devices) after each time interval and compared. [Ru(bipy)3]Cl2 Protoporphyrin IX were used as positive and negative controls, respectively.
2.9. Singlet oxygen measurements 2.9.1. Direct evaluation
The samples were prepared in an air-saturated CH3CN or D2O solution with an absorbance of 0.2 at the irradiation wavelength. This solution was irradiated in fluorescence quartz cuvettes (width 1 cm) using a mounted M450LP1 LED (Thorlabs) whose irradiation, centered at 450 nm, has been focused with aspheric condenser lenses. The intensity of the irradiation has been varied using a T-Cube LED Driver (Thorlabs) and measured with an optical power and energy meter. The emission signal was focused and collected at right angle to the excitation pathway and directed to a Princeton Instruments Acton SP-2300i monochromator. A longpass glass filter was placed in front of the monochromator entrance slit to cut off light at wavelengths shorter than 850 nm. As a detector, an EO-817L IR-sensitive liquid nitrogen cooled germanium diode detector (North Coast Scientific Corp.) has been used. The singlet oxygen luminescence at 1270 nm was measured by recording spectra from 1100 to 1400 nm. For the data analysis, the singlet oxygen luminescence peaks at different irradiation intensities were integrated. The resulting
areas were plotted against the percentage of the irradiation intensity and the slope of the linear regression calculated. The absorbance of the sample was corrected with an absorbance correction factor. As reference for the measurement Rose Bengal (Φ = 76% )76 was used and the singlet oxygen quantum yields were calculated using the following formula:
Φsample = Φreference * (Ssample / Sreference) * (Ireference / Isample) I = I0 * (1 – 10-A)
Φ = singlet oxygen quantum yield, S = slope of the linear regression of the plot of the areas of the singlet oxygen luminescence peaks against the irradiation intensity, I = absorbance correction factor, I0 = light intensity of the irradiation source, A = absorbance of the sample at irradiation wavelength.
2.9.2. Indirect evaluation
For the measurement in CH3CN: The samples were prepared in an air-saturated CH3CN solution containing the complex with an absorbance of 0.2 at the irradiation wavelength, N,N-dimethyl-4-nitrosoaniline aniline (RNO, 24 µM) and imidazole (12 mM). For the measurement in PBS buffer: The samples were prepared in an air-saturated PBS solution containing the complex with an absorbance of 0.1 at the irradiation wavelength, N,N-dimethyl-4-nitrosoaniline aniline (RNO, 20 µM) and histidine (10 mM). The samples were irradiated on 96 well plates with an Atlas Photonics LUMOS BIO irradiator for different times. The absorbance of the samples was measured during these time intervals with a SpectraMax M2 Microplate Reader (Molecular Devices). The difference in absorbance (A0-A) at 420 nm for the CH3CN solution or at 440 nm for the PBS solution was calculated and plotted against the irradiation times. From the plot, the slope of the linear regression was calculated as well as the absorbance correction factor determined. The singlet oxygen quantum yields were calculated using the same formulas as used for the direct evaluation.
2.10. Cell culture
Human cervical carcinoma (HeLa) cells were cultured using DMEM media and retinal pigment epithelium (RPE-1) cells using DMEM/F-12 with addition of 10% FBS and 1% penstrep. The cells were cultivated and maintained at 37 °C in a cell culture incubator at 37 °C with 5% CO2 atmosphere. Before an experiment, the cells were passaged three times.
13 2.11. (Photo-)Cytotoxicity
The cytotoxicity of the compounds was assessed by measuring the cell viability using a fluorometric resazurin assay. The cultivated cells were seeded in triplicates in 96 well plates with a density of 4000 cells per well in 100 μL of media. After 24 h, the medium was removed and the cells were treated with increasing concentrations of the compound diluted in cell media achieving a total volume of 200 μL. The cells were incubated with the compound for 4 h. After this time, the media was removed and replaced with 200 μL of fresh medium. For the phototoxicity studies, the cells were exposed to light with an Atlas Photonics LUMOS BIO irradiator. Each well was constantly illuminated with either a 480 nm or 540 nm irradiation. During this time, the temperature was maintained constantly at 37 °C. The cells were grown in the incubator for additional 44 h. For the determination of the dark cytotoxicity, the cells were not irradiated and after the medium exchange directly incubated for 44 h. After this time, the medium was replaced with fresh medium containing resazurin with a final concentration of 0.2 mg/mL. After 4 h incubation, the amount of the fluorescent product resorufin was determined upon excitation at 540 nm and its emission at 590 nm measured using a SpectraMax M2 Microplate Reader (Molecular Devices). The obtained data was analyzed with the GraphPad Prism software.
3. Results and Discussion
3.1. Synthesis and Characterisation
The structures of the complexes investigated in this work are shown in Figure 1. The ligands (E,E’)-4,4´-bisstyryl-2,2´-bipyridine, (E,E’)-4,4´-bis[p-methoxystyryl]-2,2´-bipyridine and (E,E’)-4,4´-bis[p-(N,N-dimethylamino)styryl]-2,2´-bipyridine were prepared as previously reported.72, 73 All complexes were synthesised by complexation of FeCl2 . 4H2O with the respective ligands (Scheme S1). Worthy of note, the reaction of (E,E’)-4,4´-bis[p-(N,N-dimethylamino)styryl]-2,2´-bipyridine with FeCl2 . 4 H2O yielded a mixture of products, as analysed by HPLC (data not shown), which were hard to separate. For this reason, the solvent used in this reaction was changed from EtOH to DMF and an excess of LiCl was added to the reaction mixture, resulting in less side product formation and an overall better yield. All compounds were analysed by 1H and 13C-NMR as well as HR-MS. The signals in the NMR
spectra were correlated to the respective atoms using 2D-NMR techniques (Figure S1-S16) and the purity of the products was confirmed by HPLC and elemental analysis.
3.2. Photophysical properties
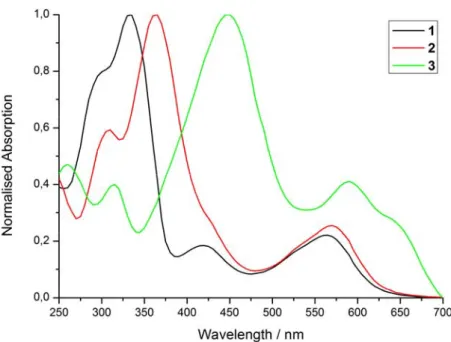
After a full chemical characterisation, the photophysical properties of complexes 1a-3a was investigated. For this purpose, the absorption and emission properties of the compounds were assessed to determine their potential as a PDT PS. While the wavelength used during a PDT treatment has a strong effect on the light penetration depth and therefore the possibility to treat deep-seated tumours, there is no ideal PS due to the very different gravity, size and depth of the tumour to ensure treatment of the tumour and to not damage healthy tissue.27 Since the treatment of deep seated or large tumours is especially challenging, much research is devoted towards the development of PSs with an absorption in the biological spectral window. Therefore, the absorption profile of the compounds in CH3CN (Figure 2, Table 1) was measured. The comparison between the complexes showed that the terminal group on the ligand has a strong effect on the absorption properties of the complexes. The maximum of the absorption of the complexes is strongly red shifted from 335 nm (1a) to 365 nm (2a) and 450 (3a) nm, respectively. In addition, similar observations were made for the peak at longer wavelengths, with shifts from 565 nm (1a) to 570 nm (2a) and 590, 640 (3a) nm, respectively. Worthy of note, the absorption spectrum of 3a is very similar to the spectra recorded in the literature77 for the compound [Fe((E,E’)-4,4´-bis[p-(N,N-dibutylamino)styryl]-2,2´-bipyridine)3]2+, suggesting that the aliphatic chain on the amino group does not significantly change this property. To further study the properties of the complexes, their emission was measured upon excitation in CH3CN at 355 nm. The emission was measured at the detection limit of our setup with a signal between 525-900 nm (Figure S17) and the maximum at 612 nm (1) to 632 nm (2) and 708 nm (3), respectively. All compounds were found to be weakly emissive, as identified with very low luminescence quantum yields (Table 1). Interestingly, the compound with the strongest red shift in the absorption profile also showed the strongest shift in its emission.
15
Figure 2. Normalised absorption spectra of 1a-3a in CH3CN.
Table 1. Spectroscopic properties of complexes 1-3 in CH3CN at room temperature. The
emission was measured with an absorbance of the sample of 0.1 at 355 nm.
UV/Vis λ / nm (ε / M-1 cm-1 * 10-3) Emission λem / nm Φem/ % 1a 300 (114.5), 335 (143.4), 420 (26.7), 565 (32.0) 612 0.1 2a 310 (95.4), 365 (161.0), 570 (40.8) 632 <0.1 3a 260 (86.8), 315 (75.4), 450 (174.0), 590 (77.2), 640 (55.2) 708 <0.1 3.3. Stability
As an important factor for biological applications, the stability of the compounds was investigated as previous studies have shown that this could be critical.78, 79 Therefore, the complexes were incubated in CH3CN and their absorption spectra measured in time intervals (0, 4, 8, 12, 24, 48 h). As no significant differences in the absorption spectra could be detected (Figure S18-S20), their stability in this solvent was confirmed. Following this, the stability in human plasma was investigated. For this purpose, the compounds were incubated for 48 h in human plasma and their retention times and absorption spectra compared by HPLC analysis. The comparison between the chromatograms (Figure S21-S23) showed no significant differences, confirming their stability in a biological environment.
3.4. Photostability
After having assessed the stability in acetonitrile and human plasma, the stability of the compounds was investigated upon light exposure. The compounds were therefore constantly irradiated with a 450 nm LED and, after constant time intervals, their absorption profile measured. For comparison purposes, [Ru(bipy)3]Cl2 (Figure S24) and Protoporphyrin IX (Figure S25) were used as positive and negative controls, respectively. The results showed a minimal decrease in absorption for compounds 1a and 2a (Figure S26-S27), being in the same range as the positive control [Ru(bipy)3]Cl2. On the contrary, complex 3a (Figure S28) changed its absorption profile upon light exposure in the range from 525-700 nm. Worthy of note, the photodegradation is significant less than for PpIX.
3.5. Singlet oxygen generation
Although different kinds of radicals can be involved, singlet oxygen (1O2) remains the predominant active species responsible for cell death in PDT. Therefore, its generation was investigated upon light exposure using two independent methods: 1) direct measurement of the phosphorescence of 1O2; 2) indirect measurement of the change of absorption of a 1O2 scavenger.80, 81 The results (Table 2) showed that compounds 1-3 are poorly generating 1O2. Using the direct method, no signal could be observed. Worthy of note, in the direct method, only singlet oxygen quantum yields higher than 20% can be detected with our apparatus. In comparison to this, in the indirect method, changes in the absorption profile could be detected. The results (Table 2) show, after subtraction of the changes caused by photodegradation, that complexes 1a-3a are producing 1O2 poorly with quantum yields ~1% - >1% in CH3CN and in PBS.
Table 2. Singlet oxygen quantum yields (Φ(1O2)) in CH3CN and aqueous solution determined
by direct and indirect method by excitation at 450 and 540 nm. Measurements were performed with an absorption of 0.2 at the irradiation wavelength. Average of three independent measurements. n.d. = not detectable. 1) contains 2% DMSO.
17 CH3CN direct D2O1) direct CH3CN indirect PBS1) indirect CH3CN indirect PBS1) indirect 1a n.d. n.d. 1% <1% 1% <1% 2a n.d. n.d. 1% <1% <1% <1% 3a n.d. n.d. <1% <1% <1% <1% 3.6. (Photo-)cytotoxicity
After a complete chemical and photophysical analysis of the properties of our complexes, we investigated their influence on the cell viability of non-cancerous retinal pigment epithelium (RPE-1) and human cervical carcinoma (HeLa) cells. The compounds were incubated with the cells for 4 h and then exposed to an irradiation at 480 and 540 nm. After additional 44 h, the cell viability was determined using a fluorometric resazurin assay. To evaluate the potential of the compounds, they were compared with the chemotherapeutic drug cisplatin and the PS Protoporphyrin IX (PpIX). Unfortunately, no cytotoxicity (Table 3) for 1a-3a either in the dark or upon light treatment could have been observed. Worthy of note, complex 3a could be tested only up to a concentration of 50 μM due to solubility limitations.
Table 3. IC50 values (μM) in the dark and upon irradiation at 480 and 540 nm for the compounds
as PF6- salts (1a-3a) in comparison to cisplatin and Protoporphyrin IX (PpIX) on non-cancerous retinal pigment epithelium (RPE-1) and human cervical carcinoma (HeLa) cells. Average of three independent measurements.
IC50 (μM) HeLa RPE-1 dark 480 nm (10 min, 3.1 J/cm2) 540 nm (40 min, 9.5 J/cm2) dark 480 nm (10 min, 3.1 J/cm2) 540 nm (40 min, 9.5 J/cm2) 1a >100 >100 >100 >100 >100 >100 2a >100 >100 >100 >100 >100 >100 3a >50 >50 >50 >50 >50 >50 PpIX >100 2.5 ± 0.1 2.1 ± 0.3 >100 3.8 ± 0.1 3.1 ± 0.1 cisplatin 10.5 ± 0.8 - - 29.3 ± 1.4 - -
As no cytotoxic effect was measurable up to the solubility limitation of the complexes 1a-3a as a PF6- salt, the water solubility was improved by anion exchange to chloride (1b-3b) using an ion exchange resin (Amberlite IRA-410). The results of the (photo)-cytotoxic evaluation (Table 4) demonstrated that all complexed showed a toxic effect in the dark in the micromolar range. Irradiation at 480 and 540 nm was found to have only a negligible effect, most probably due to the poor photophysical properties of the complexes (e.g., low 1O2 generation quantum yield). The obtained IC50 values were found to be much higher than the clinically used drug cisplatin or PpIX.
Table 4. IC50 values (μM) in the dark and upon irradiation at 480 and 540 nm for the compounds
as CL- salts (1b-3b) in comparison to cisplatin and Protoporphyrin IX (PpIX) on non-cancerous retinal pigment epithelium (RPE-1) and human cervical carcinoma (HeLa) cells. Average of three independent measurements.
IC50 (μM) HeLa RPE-1 dark 480 nm (10 min, 3.1 J/cm2) 540 nm (40 min, 9.5 J/cm2) dark 480 nm (10 min, 3.1 J/cm2) 540 nm (40 min, 9.5 J/cm2) 1b 184 ± 21 161 ± 25 178 ± 23 201 ± 29 191 ± 20 182 ± 19 2b 223 ± 29 231 ± 20 219 ± 24 242 ± 25 230 ± 21 249 ± 27 3b 252 ± 27 269 ± 21 242 ± 23 272 ± 23 281 ± 28 291 ± 20 PpIX >100 2.5 ± 0.1 2.1 ± 0.3 >100 3.8 ± 0.1 3.1 ± 0.1 cisplatin 10.5 ± 0.8 - - 29.3 ± 1.4 - - 4. Conclusion
In this study, we report on the photophysical and biological evaluation of three [Fe((E,E’)-4,4´-bisstyryl-2,2´-bipyridine)3]2+ complexes including derivatisation on the terminal end of the compounds. All signals in the NMR spectra were assigned to the corresponding atoms using 2D-NMR techniques. The compounds absorb in the biological spectral window, which is a desired property for the development of metal-based PDT PSs. The photophysical evaluation
19
of the compounds revealed that they are poorly emissive and barely produce 1O2 upon light irradiation. Stability studies in organic solvent and human plasma indicated the high stability of the complexes in a biological environment. Biological studies in non-cancerous retinal pigment epithelium (RPE-1) cells and human cervical carcinoma (HeLa) cells demonstrated an effect in the micromolar range in the dark and a negligible phototoxic effect, most probably due to poor photophysical properties of the complexes. We are currently investigating other options to synthesise complexes based on cheap, abundant metals with a higher 1O2 production as for example the use of Zn(II) complexes, which we have recently reported.51
Acknowledgements
We thank Dr. Philippe Goldner for access to state-of-the-art laser apparatus. This work was financially supported by an ERC Consolidator Grant PhotoMedMet to G.G. (GA 681679) and has received support under the program “Investissements d’Avenir” launched by the French Government and implemented by the ANR with the reference ANR-10-IDEX-0001-02 PSL (G.G.). Le Conseil Régional d'Ile de France is acknowledged for providing financial support for the purchase of a 500 MHz NMR spectrometer.
References
1. A. Jemal, F. Bray, M. M. Center, J. Ferlay, E. Ward and D. Forman, CA Cancer J. Clin., 2011, 61, 69-90.
2. A. Urruticoechea, R. Alemany, J. Balart, A. Villanueva, F. Vinals and G. Capella, Curr.
Pharm. Des., 2010, 16, 3-10.
3. A. Notaro and G. Gasser, Chem. Soc. Rev., 2017, 46, 7317-7337.
4. L. Zeng, P. Gupta, Y. Chen, E. Wang, L. Ji, H. Chao and Z.-S. Chen, Chem. Soc. Rev., 2017, 46, 5771-5804.
5. T. C. Johnstone, K. Suntharalingam and S. J. Lippard, Chem. Rev., 2016, 116, 3436-3486.
6. C. S. Allardyce and P. J. Dyson, Platinum Met. Rev., 2001, 45, 62-69.
7. B. Q. Spring, I. Rizvi, N. Xu and T. Hasan, Photochem. Photobiol. Sci., 2015, 14, 1476-1491.
8. S. Bonnet, Dalton Trans., 2018, 47, 10330-10343.
9. K. Plaetzer, B. Krammer, J. Berlanda, F. Berr and T. Kiesslich, Lasers Med. Sci., 2009, 24, 259-268.
10. T. J. Dougherty, C. J. Gomer, B. W. Henderson, G. Jori, D. Kessel, M. Korbelik, J. Moan and Q. Peng, J. Natl. Cancer Inst., 1998, 90, 889-905.
11. B. W. Henderson and T. J. Dougherty, Photochem. Photobiol., 1992, 55, 145-157. 12. S. Callaghan and M. O. Senge, Photochem. Photobiol. Sci., 2018, 17, 1490-1514.
13. K. Plaetzer, B. Krammer, J. Berlanda, F. Berr and T. Kiesslich, Lasers Med. Sci., 2009, 24, 259-268.
14. A. E. O’Connor, W. M. Gallagher and A. T. Byrne, Photochem. Photobiol., 2009, 85, 1053-1074.
15. R. Bonnett, Chem. Soc. Rev., 1995, 24, 19-33.
16. M. Ethirajan, Y. Chen, P. Joshi and R. K. Pandey, Chem. Soc. Rev., 2011, 40, 340-362. 17. F. E. Poynton, S. A. Bright, S. Blasco, D. C. Williams, J. M. Kelly and T. Gunnlaugsson,
Chem. Soc. Rev., 2017, 46, 7706-7756.
18. J. Shum, P. K.-K. Leung and K. K.-W. Lo, Inorg. Chem., 2019, 58, 2231-2247. 19. F. Heinemann, J. Karges and G. Gasser, Acc. Chem. Res., 2017, 50, 2727-2736. 20. C. Mari, V. Pierroz, S. Ferrari and G. Gasser, Chem. Sci., 2015, 6, 2660-2686.
21. M. Jakubaszek, B. Goud, S. Ferrari and G. Gasser, Chem. Commun., 2018, 54, 13040-13059.
22. J. Liu, C. Zhang, T. W. Rees, L. Ke, L. Ji and H. Chao, Coord. Chem. Rev., 2018, 363, 17-28.
23. N. J. Farrer, L. Salassa and P. J. Sadler, Dalton Trans., 2009, 10690-10701.
24. C. Mari, V. Pierroz, R. Rubbiani, M. Patra, J. Hess, B. Spingler, L. Oehninger, J. Schur, I. Ott and L. Salassa, Chem. Eur. J., 2014, 20, 14421-14436.
25. H. Huang, B. Yu, P. Zhang, J. Huang, Y. Chen, G. Gasser, L. Ji and H. Chao, Angew.
Chem. Int. Ed., 2015, 54, 14049-14052.
26. Y. Ellahioui, M. Patra, C. Mari, R. Kaabi, J. Karges, G. Gasser and S. Gómez-Ruiz,
Dalton Trans., 2019,48, 5940-5951.
27. S. Monro, K. L. Colón, H. Yin, J. Roque III, P. Konda, S. Gujar, R. P. Thummel, L. Lilge, C. G. Cameron and S. A. McFarland, Chem. Rev., 2019, 119, 797-828.
28. J. Karges, F. Heinemann, F. Maschietto, M. Patra, O. Blacque, I. Ciofini, B. Spingler and G. Gasser, Biorg. Med. Chem., 2019, 27, 2666-2675.
29. G. Shi, S. Monro, R. Hennigar, J. Colpitts, J. Fong, K. Kasimova, H. Yin, R. DeCoste, C. Spencer, L. Chamberlain, A. Mandel, L. Lilge and S. A. McFarland, Coord. Chem.
Rev., 2015, 282-283, 127-138.
30. J. Karges, O. Blacque, M. Jakubaszek, B. Goud, P. Goldner and G. Gasser, J. Inorg.
Biochem., 2019, 198, 110752.
31. M. Dickerson, Y. Sun, B. Howerton and E. C. Glazer, Inorg. Chem., 2014, 53, 10370-10377.
32. S. Lazic, P. Kaspler, G. Shi, S. Monro, T. Sainuddin, S. Forward, K. Kasimova, R. Hennigar, A. Mandel and S. McFarland, Photochem. Photobiol., 2017, 93, 1248-1258. 33. Y. Sun, L. E. Joyce, N. M. Dickson and C. Turro, Chem. Commun., 2010, 46,
6759-6761.
34. S. M. Meier-Menches, C. Gerner, W. Berger, C. G. Hartinger and B. K. Keppler, Chem.
Soc. Rev., 2018, 47, 909-928.
35. A. A. Holder, D. F. Zigler, M. T. Tarrago-Trani, B. Storrie and K. J. Brewer, Inorg.
Chem., 2007, 46, 4760-4762.
36. S. Swavey and K. J. Brewer, Inorg. Chem., 2002, 41, 6196-6198. 37. J. D. Knoll and C. Turro, Coord. Chem. Rev., 2015, 282-283, 110-126.
38. G. Mion, T. Gianferrara, A. Bergamo, G. Gasser, V. Pierroz, R. Rubbiani, R. Vilar, A. Leczkowska and E. Alessio, ChemMedChem, 2015, 10, 1901-1914.
39. A. Leonidova, V. Pierroz, R. Rubbiani, Y. Lan, A. G. Schmitz, A. Kaech, R. K. O. Sigel, S. Ferrari and G. Gasser, Chemical Sci. 2014, 5, 4044-4056.
40. S. C. Marker, S. N. MacMillan, W. R. Zipfel, Z. Li, P. C. Ford and J. J. Wilson, Inorg.
Chem., 2018, 57, 1311-1331.
41. C. C. Konkankit, S. C. Marker, K. M. Knopf and J. J. Wilson, Dalton Trans., 2018, 47, 9934-9974.
21
42. E. B. Bauer, A. A. Haase, R. M. Reich, D. C. Crans and F. E. Kühn, Coord. Chem. Rev., 2019, 393, 79-117.
43. A. Zamora, G. Vigueras, V. Rodríguez, M. D. Santana and J. Ruiz, Coord. Chem. Rev., 2018, 360, 34-76.
44. L. K. McKenzie, I. V. Sazanovich, E. Baggaley, M. Bonneau, V. Guerchais, J. A. Williams, J. A. Weinstein and H. E. Bryant, Chemistry, 2017, 23, 234-238.
45. H. Huang, S. Banerjee and P. J. Sadler, ChemBioChem, 2018, 19, 1574-1589. 46. K. K.-W. Lo, Acc. Chem. Res., 2015, 48, 2985-2995.
47. J. Weynand, H. Bonnet, F. Loiseau, J.-L. Ravanat, J. Dejeu, E. Defrancq and B. Elias,
Chem. Eur. J., accpeted, DOI: 10.1002/chem.201902183.
48. R. Bevernaegie, L. Marcélis, B. Laramée-Milette, J. De Winter, K. Robeyns, P. Gerbaux, G. S. Hanan and B. Elias, Inorg. Chem., 2018, 57, 1356-1367.
49. V. Novohradsky, G. Vigueras, J. Pracharova, N. Cutillas, C. Janiak, H. Kostrhunova, V. Brabec, J. Ruiz and J. Kasparkova, Inorganic Chemistry Frontiers, 2019, accepted, DOI: 10.1039/C9QI00811J.
50. A. Zamora, G. Vigueras, V. Rodríguez, M. D. Santana and J. Ruiz, Coord. Chem. Rev., 2018, 360, 34-76.
51. J. Karges, U. Basu, O. Blacque, H. Chao and G. Gasser, Angew. Chem. Int. Ed., accpeted, DOI: 10.1002/anie.201907856.
52. A. K. Mengel, C. Bissinger, M. Dorn, O. Back, C. Förster and K. Heinze, Chem. Eur.
J., 2017, 23, 7920-7931.
53. W. Zhang, R. Alonso-Mori, U. Bergmann, C. Bressler, M. Chollet, A. Galler, W. Gawelda, R. G. Hadt, R. W. Hartsock, T. Kroll, K. S. Kjær, K. Kubiček, H. T. Lemke, H. W. Liang, D. A. Meyer, M. M. Nielsen, C. Purser, J. S. Robinson, E. I. Solomon, Z. Sun, D. Sokaras, T. B. van Driel, G. Vankó, T.-C. Weng, D. Zhu and K. J. Gaffney,
Nature, 2014, 509, 345.
54. M. Roy, S. Saha, A. K. Patra, M. Nethaji and A. R. Chakravarty, Inorg. Chem., 2007, 46, 4368-4370.
55. S. Saha, R. Majumdar, M. Roy, R. R. Dighe and A. R. Chakravarty, Inorg. Chem., 2009, 48, 2652-2663.
56. S. Saha, D. Mallick, R. Majumdar, M. Roy, R. R. Dighe, E. D. Jemmis and A. R. Chakravarty, Inorg. Chem., 2011, 50, 2975-2987.
57. U. Basu, I. Pant, P. Kondaiah and A. R. Chakravarty, Eur. J. Inorg. Chem., 2016, 2016, 1002-1012.
58. U. Basu, I. Khan, A. Hussain, P. Kondaiah and A. R. Chakravarty, Angew. Chem. Int.
Ed., 2012, 51, 2658-2661.
59. U. Basu, I. Pant, I. Khan, A. Hussain, P. Kondaiah and A. R. Chakravarty, Chem. Asian
J., 2014, 9, 2494-2504.
60. S. Sahoo, S. Podder, A. Garai, S. Majumdar, N. Mukherjee, U. Basu, D. Nandi and A. R. Chakravarty, Eur. J. Inorg. Chem., 2018, 2018, 1522-1532.
61. A. Garai, I. Pant, A. Bhattacharyya, P. Kondaiah and A. R. Chakravarty,
ChemistrySelect, 2017, 2, 11686-11692.
62. U. Basu, I. Khan, A. Hussain, B. Gole, P. Kondaiah and A. R. Chakravarty, Inorg.
Chem., 2014, 53, 2152-2162.
63. U. Basu, I. Pant, A. Hussain, P. Kondaiah and A. R. Chakravarty, Inorg. Chem., 2015, 54, 3748-3758.
64. A. Garai, U. Basu, I. Khan, I. Pant, A. Hussain, P. Kondaiah and A. R. Chakravarty,
Polyhedron, 2014, 73, 124-132.
65. A. Garai, I. Pant, P. Kondaiah and A. R. Chakravarty, Polyhedron, 2015, 102, 668-676. 66. S. Saha, R. Majumdar, A. Hussain, R. R. Dighe and A. R. Chakravarty, Phil. Trans. R.
67. J. Karges, P. Goldner and G. Gasser, Inorganics, 2019, 7, 4.
68. C. Mari, H. Huang, R. Rubbiani, M. Schulze, F. Würthner, H. Chao and G. Gasser, Eur.
J. Inorg. Chem., 2017, 1745-1752.
69. J. Karges, O. Blacque, P. Goldner, H. Chao and G. Gasser, Eur. J. Inorg. Chem., 2019, accepted. DOI: 10.1002/ejic.201900569.
70. M. J. Cook, A. P. Lewis, G. S. McAuliffe, V. Skarda, A. J. Thomson, J. L. Glasper and D. J. Robbins, J. Chem. Soc., Perkin Trans. 2, 1984, 1293-1301.
71. A. Juris, V. Balzani, F. Barigelletti, S. Campagna, P. l. Belser and A. Von Zelewsky,
Coord. Chem. Rev., 1988, 84, 85-277.
72. K. Balasubramanian, V. Cammarata and Q. Wu, Langmuir, 1995, 11, 1658-1665. 73. C. Leidner, B. P. Sullivan, R. Reed, B. White, M. Crimmins, R. W. Murray and T. J.
Meyer, Inorg. Chem., 1987, 26, 882-891.
74. K. Nakamaru, Bull. Chem. Soc. Jpn., 1982, 55, 1639-1640.
75. S. J. Bruce, I. Tavazzi, V. r. Parisod, S. Rezzi, S. Kochhar and P. A. Guy, Anal. Chem., 2009, 81, 3285-3296.
76. I. E. Kochevar and R. W. Redmond, in Methods Enzymol., Academic Press 2000, 319, 20-28.
77. C. Feuvrie, O. Maury, H. Le Bozec, I. Ledoux, J. P. Morrall, G. T. Dalton, M. Samoc and M. G. Humphrey, J. Phys. Chem. A, 2007, 111, 8980-8985.
78. U. Basu, J. Karges, F. Chotard, C. Balan, P. Le Gendre, G. Gasser, E. Bodio and R. Malacea Kabbara, Polyhedron, 2019, accepted, DOI: 10.1016/j.poly.2019.02.041. 79. A. K. Renfrew, J. Karges, R. Scopelliti, F. D. Bobbink, P. Nowak-Sliwinska, G. Gasser
and P. Dyson, ChemBioChem, 2019, accepted, DOI: 10.1002/cbic.201900236.
80. M. Jakubaszek, J. Rossier, J. Karges, J. Delasoie, B. Goud, G. Gasser and F. Zobi, Helv.
Chim. Acta, 2019, accepted, DOI: 10.1002/hlca.201900104.
81. J. Karges, M. Jakubaszek, C. Mari, K. Zarschler, B. Goud, H. Stephan and G. Gasser,