Proceedings
of
the
Nutrition
Society
Oskar Kellner Symposium 2011 organised by the Leibniz Institute for Farm Animal Biology jointly with the Nutrition Society was held at Hotel Neptun, Warnemu¨nde, Germany on 9–11 September 2011
Symposium on ‘Metabolic flexibility in animal and human nutrition’
Session II: Metabolic flexibility and regulation
How dieting makes some fatter: from a perspective of
human body composition autoregulation
Abdul G. Dulloo*, Jean Jacquet and Jean-Pierre Montani
Department of Medicine/Physiology, University of Fribourg, Chemin du muse´e 5, CH-1700 Fribourg, Switzerland
Dieting makes you fat – the title of a book published in 1983 – embodies the notion that dieting to control body weight predisposes the individual to acquire even more body fat. While this notion is controversial, its debate underscores the large gap that exists in our understanding of basic physiological laws that govern the regulation of human body composition. A striking example is the key role attributed to adipokines as feedback signals between adipose tissue depletion and compensatory increases in food intake. Yet, the relative importance of fat depletion per se as a determinant of post-dieting hyperphagia is unknown. On the other hand, the question of whether the depletion of lean tissues can provide feedback signals on the hunger–appetite drive is rarely invoked, despite evidence that food intake during growth is dominated by the impetus for lean tissue deposition, amidst proposals for the existence of protein–static mechanisms for the regulation of growth and maintenance of lean body mass. In fact, a feedback loop between fat depletion and food intake cannot explain why human subjects recovering from starvation continue to overeat well after body fat has been restored to pre-starvation values, thereby contributing to ‘fat overshooting’. In addressing the plausibility and mechanistic basis by which dieting may predispose to increased fatness, this paper integrates the results derived from re-analysis of classic longitudinal studies of human starvation and refeeding. These suggest that feedback signals from both fat and lean tissues contribute to recovering body weight through effects on energy intake and thermogenesis, and that a faster rate of fat recovery relative to lean tissue recovery is a central outcome of body composition autoregulation that drives fat overshooting. A main implication of these findings is that the risk of becoming fatter in response to dieting is greater in lean than in obese individuals.
Obesity: Weight cycling: Weight fluctuation: Adaptive thermogenesis
The ancient prescription of Hippocrates (400 BC) that the obese should eat less and exercise more(1) continues nowadays to be a widespread approach for weight manage-ment despite its well-documanage-mented failures(2). Weight regain is generally the rule, with long-term follow-up studies indicating that one-third to two-thirds of the weight lost is regained within 1 year and almost all is regained within 5 years(3). Repeated cycles of weight loss and weight regain, referred to as weight cycling or yo–yo dieting are a frequent occurrence, with the potential for increased
cardiovascular risks(4). Despite these failures, national surveys in Europe and North America indicate that 30–50 % women and 10–30 % men are currently or have recently attempted dieting to lose weight(5–7). With studies of the long-term outcomes of energy-restricting diets showing that at least one-third of dieters regain more weight than they lost(8), together with population groups as diverse as obese and lean, young and old, sedentary and athletes attempting to lose weight on some form of diet therapy(4,5), there is concern as to whether dieting may
Abbreviations: FFM, fat-free mass; Pc, partitioning characteristic.
*Corresponding author: Dr. Abdul G. Dulloo, fax + 41 26 300 9734, email [email protected]
Proceedings
of
the
Nutrition
Society
paradoxically be promoting exactly the opposite of what it is intended to achieve. To put it bluntly, does dieting make people fatter as proposed nearly three decades ago by Cannon and Einzig(9) in a book entitled Dieting makes you fat.
Prospective studies linking dieting to future weight gain In an article published in 1994 in which a panel of experts for the National Task Force on the Prevention and Treat-ment of Obesity(10) addressed concerns about the effects of weight cycling and provided guidance on the risk-to-benefit ratio of attempts at weight loss, a main conclusion was that ‘the (then) available evidence is not sufficiently compelling to override the potential benefits of moderate weight loss in significantly obese patients’. In the decade that followed, however, more than a dozen prospective studies(11–24), conducted over periods ranging from 1 to 15 years, have suggested that dieting to lose weight is associated with future weight gain and obesity, with many of them showing this association even after adjustment for potential confounders such as baseline BMI, age and sev-eral lifestyle and behavioural characteristics. Particularly informative are the 3-year follow-up studies of Stice et al.(15)showing that adolescents with baseline dieting had three times the risk of onset of obesity than the non-dieters, and the 6–15-year follow-up study of Korkelia et al.(16) reporting that initially normal-weight subjects who were attempting to lose weight had two times the risk of major weight gain (> 10 kg) than non-dieters. In contrast, the history of weight-loss attempts in initially overweight men and women subjects in the latter cohort(16) was not con-sistently associated with increased risk of major weight gain, thereby raising the possibility that the long-term impact of dieting on proneness to fatness may be greater in the lean than in the obese, albeit in young and middle-aged population groups. Furthermore, the recent analysis of a large population-based cohort with a follow-up from ado-lescence to young adulthood, suggest a dose-dependent association between the number of lifetime intentional weight losses, gain in BMI and risk of overweight(24). A single episode of weight loss was found to increase the risk of becoming overweight by the age of 25 years almost 3-fold in women and 2-fold in men. In addition, women who reported two or more weight-loss episodes had an even higher (5-fold increased) risk of becoming over-weight at the age of 25 years compared with subjects with no intentional weight loss. Weight cycling has also been shown to be a predictor of subsequent weight gain and the risk of obesity in athletes(25). In a national cohort of 1838 male elite athletes who had represented Finland in inter-national sport competitions between 1920 and 1965, men who performed power sports (boxers, weight lifters and wrestlers), where weight cycling is common, gained 5.2 units of BMI from age 20 to 60 years. In contrast, men without an athletic background gained only 4.2 units of BMI, and athletes without weight cycling gained even less (3.3 units of BMI). These findings are therefore in support of the contention that dieters and weight cyclers may be more prone to future weight gain than dieters and non-cyclers.
Causality in the link between dieting and propensity to fatness
But whether dieting per se is a causative factor for sub-sequent weight gain and contributes to the current obesity epidemic is, however, debatable(26–28). Hill(26) has argued that ‘it is not that dieting makes you fat, but that being fat makes you (more likely to) diet’, a contention that is sup-ported by data from the Finnish Twin cohort study(16) showing that dieting aggregated in families, and hence suggesting a familial predisposition to gain weight. Indeed, twin studies have demonstrated that, like proneness for obesity, episodes of intentional weight loss have substantial genetic components(29), such that the possibility arises that subjects who are genetically most prone to obesity end up dieting the most and subsequently gain the most weight. In a recent study that directly addressed this question of whether weight gain associated with dieting is better rela-ted to genetic propensity to weight gain than to the weight-loss episodes themselves, Pietila¨inen et al.(24)investigated the association between dieting and weight gain in 4129 individual twins whose weight and height were obtained from longitudinal surveys at 16, 17, 18 and 25 years and examined in relation to the number of lifetime intentional weight-loss episodes of >5 kg at 25 years. In monozygotic twin pairs discordant for intentional weight loss, co-twins with at least one weight-loss episode were found to be 0.4 BMI units heavier at 25 years than their non-dieting co-twins despite no differences in baseline BMI levels. Similarly, in dizygotic twin pairs, co-twins with intentional weight losses gained progressively more weight than non-dieting co-twins (BMI difference 1.7 units at 16 years and 2.2 units at 25 years). Overall, therefore, these findings not only confirm previous studies that dieters may be more prone to future weight gain and that dieters have a genetic propensity for obesity, but they also provide evidence that dieting per se may promote subsequent weight gain, inde-pendent of genetic factors, in an essentially normal-weight cohort (i.e. < 10 % overweight as adolescents). Support for this contention that dieting per se may drive excess weight gain in non-obese adults, can in fact be derived from classic studies of food deprivation and refeeding showing that more weight is recovered than is lost; a phenomenon referred to as post-starvation weight (or fat) over-shooting(30).
Post-starvation fat overshooting
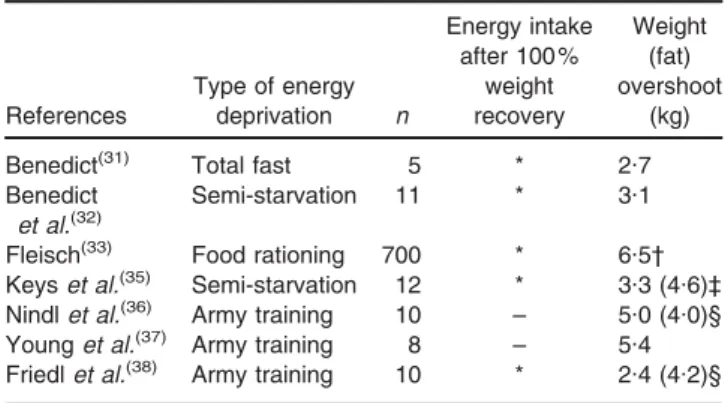
The phenomenon of post-starvation weight overshoot, first documented by Benedict(31,32) in studies of experimental starvation, was subsequently observed during follow-up studies of famine victims of World War II, in men volun-teers subjected to experimental semi-starvation or in young army recruits recovering from an 8-week training that included food and sleep deprivation. As shown in Table 1 and elaborated later, data available on dynamic changes in body weight, food intake and/or body composition are informative about the consequences of large weight losses and subsequent weight regain resulting in weight over-shooting.
Proceedings
of
the
Nutrition
Society
The Swiss food rationing experimentIn Switzerland, when food rationing was implemented in 1941, the physiologist Fleisch(33) was asked by the ‘Federal Commission for Wartime Feeding’ to monitor the health consequences of this intervention. In addition to the assessment of mortality and morbidity related to CVD, digestive and infectious diseases, the nutritional status was also monitored in 700 persons of different ages, social status and living areas, every 1–2 months between autumn 1941 and spring 1946. The data collected on food con-sumption and body weight, compiled and published about 30 years later by Martin and Demole(34)indicate that food intake and body weight dropped to the lowest level during the summer of 1945. At the end of that year, food rationing was abandoned and products were available again in larger quantities; food consumption and body weight rose rapidly. During the subsequent months when food availability improved further, the phenomena of energy over-compensation (hyperphagia) and weight overshooting became evident (Table 1).
The Minnesota experiment
Coincidentally, it was during the same time period that Keys et al.(35), motivated by the desire to obtain quantita-tive information upon which to base an efficacious relief programme directed at nutritional rehabilitation of the starvation victims of World War II, were conducting their study of experimental semi-starvation and refeeding in Minnesota. The thirty-two healthy volunteers who com-pleted the study (many of whom were conscientious objectors of war), were in continuous residence at the University of Minnesota during the 12-week control base-line period, 24 weeks of semi-starvation and 12 weeks of restricted rehabilitation; furthermore, twelve of them also remained in the laboratory during the first 8 weeks after removal of dietary control, i.e. ad libitum refeeding. The total loss in body weight of about 25 % of the original weight in each individual reproduced the conditions of severe semi-starvation, and is comparable with values
found in severe famine. Following removal of dietary control at the end of week 12 of restricted rehabilitation, the food intake increased markedly above the pre-starvation level, and this hyperphagic response persisted for several weeks after body weight had reached the pre-starvation level, and contributed to weight overshooting mostly as fat.
The Army Ranger multi-stressor experiments In more recent years, similar body weight and fat over-shooting have also been reported in young men at the US Army Ranger School recovering from about 12 % of weight lost following 8–9 weeks of training in a multi-stressor environment that includes energy deficit and sleep deprivation(36–38). Nindl et al.(36) found that at week 5 in the post-training recovery phase, body weight had overshot by 5 kg, reflected primarily in large gains in fat mass, with all ten subjects showing higher fat mass than before weight lost. Similarly, in young male volunteers participating in another 8-week US Army Ranger course that involved four repeated cycles of restricted energy intake and refeeding, Friedl et al.(38)found that more weight was regained than lost at week 5 of recovery following training cessation, with fat overshooting representing an increase of 40 % in body fat above pre-training levels. Data obtained in a par-allel group of subjects revealed that hyperphagia peaked at about 4 weeks post-training, thereby suggesting that hyperphagia was likely persisting over the last week of refeeding during which body fat had already exceeded the baseline.
The search for control systems regulating body composition during weight recovery
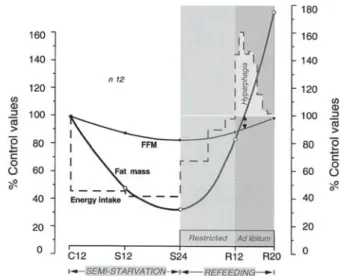
The earlier observations raise the question of what drives hyperphagia well after body weight or body fat had been fully recovered. Is it an explanation based solely on long-lasting psycho-biological reaction to food deprivation? Preoccupations with food and food obsession have often been described long after episodes of food deprivation or dietary restraint(39). However, what is particularly striking from a closer inspection of data on the real-time pattern of hyperphagia relative to changes in body composition in the men recovering weight in the Minnesota Experiment (Fig. 1) is that when their body fat had been completely recovered (i.e. 100 % of control period), at which point the fat-free mass (FFM) was not yet fully recovered, the hyperphagia was still very much evident. It only dis-appeared as FFM recovery approached 100 % of the con-trol level. These observations about hyperphagic overcompensation and its relationship with changes in body composition suggest a link between lean tissue recovery relative to fat recovery, sustained hyperphagia and fat overshooting, and raise fundamental questions about how control systems operate to re-establish lean and fat tissues during weight recovery:
(i) What is the relative importance of fat and lean tissue depletion as determinants of post-starvation hyperphagia?
Table 1 Post-starvation hyperphagic overcompensation and weight overshooting in human subjects (Table updated from Dulloo(30))
References Type of energy deprivation n Energy intake after 100 % weight recovery Weight (fat) overshoot (kg)
Benedict(31) Total fast 5 * 2.7
Benedict et al.(32)
Semi-starvation 11 * 3.1
Fleisch(33) Food rationing 700 * 6.5†
Keyset al.(35) Semi-starvation 12 * 3.3 (4.6)‡
Nindlet al.(36) Army training 10 – 5.0 (4.0)§
Younget al.(37) Army training 8 – 5.4
Friedlet al.(38) Army training 10 * 2.4 (4.2)§
*Increased energy intake above levels prior to energy deprivation. †Data calculated from graph published by Martin & Demole(34).
‡Body fat measured by hydrodensitometry.
Proceedings
of
the
Nutrition
Society
(ii) What drives the faster rate of fat recovery relative to lean tissue recovery even in the absence of hyperphagia as observed in the period of restricted refeeding in the Minnesota Experiment? Could this be explained by the adaptive reduction in energy expenditure (i.e. suppressed thermogenesis) that occurs during weight loss and which persists during weight recovery? What then is the relative impor-tance of fat and lean tissue depletion as determinants of such adaptive suppression of thermogenesis dur-ing weight recovery?
(iii) What determines the large inter-individual varia-bility in partitioning of energy into lean and fat tis-sues during weight recovery?
In addressing these questions, we revisited the Minnesota Experiment and applied more elaborate statistical and analytical tools in a re-analysis of the data on the dynamic changes in body composition, food intake and BMR in response to the 24 weeks of semi-starvation, 12 weeks of restricted refeeding and subsequent 8 weeks of ad libitum refeeding. The methodological approaches and results of this re-analysis have been reported in detail else-where(40–44), and are summarised below.
Energy partitioning between lean and fat tissues: an individual characteristic
The notion that the control of partitioning between the body’s protein and fat compartments is an individual characteristic was first proposed by Payne and Dugdale(45)
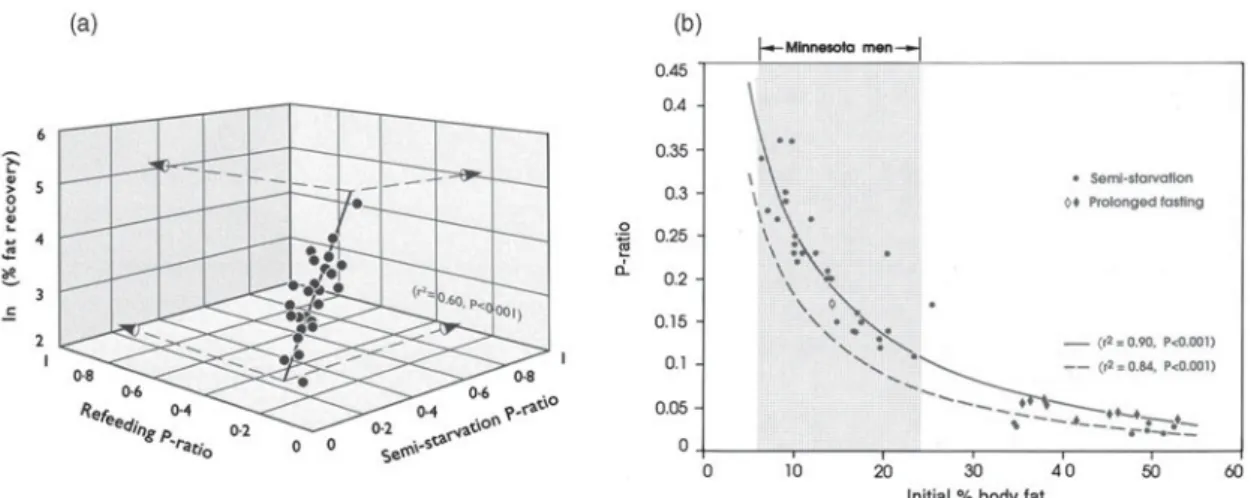
and supported by data from studies of prolonged fasting showing that the fraction of energy mobilised from protein (termed the P-ratio) during weight loss is relatively con-stant in a given individual but varies considerably between individuals(46). Using a quantitative index of energy parti-tioning defined as body energy mobilised from protein during weight loss (the semi-starvation P-ratio) or as the proportion of energy gained as protein during weight recovery (the refeeding P-ratio) in the first part of our Minnesota Experiment re-analysis(40), we showed that the highly variable P-ratio during refeeding is strongly corre-lated with the P-ratio during semi-starvation, particularly after controlling for inter-individual variability in the degree of fat recovery (Fig. 2(a)). This demonstration that the individual’s P-ratio during semi-starvation is conserved during refeeding therefore provides direct evidence to the proposal of Payne and Dugdale(45) that the control of energy partitioning is an individual characteristic. Further-more, in the search for predictors of the large inter-indivi-dual variability in energy partitioning(40), we found that the initial % body fat (i.e. % body fat prior to weight loss) to be the most important determinant of inter-individual variability in P-ratio (Fig. 2(b)), which suggests that the higher the initial adiposity, the lower the proportion of energy mobilised from body protein, and hence the greater the propensity to mobilise fat during weight loss and to subsequently deposit fat during weight recovery. In order to examine in more detail the relationship between initial adiposity and the partitioning characteristic (Pc) of individuals, we have pooled the Minnesota data on P-ratio in normal-weight Caucasians with those calculated for obese Caucasians undergoing prolonged fasting(46) or semi-starvation(47). As can be seen in Fig. 2(b), > 85 % of the variance in the P-ratio could be explained by the % body fat prior to weight loss. The steep part of the expo-nential curve lies between 8 and 20 % body fat, and a shift from the lower to the upper values in this range, generally considered to reflect a ‘normal’ range of adiposity for men living in affluent societies, results in 2.5–3-fold reduction in P-ratio. This extremely high sensitivity of the P-ratio with regard to the initial body composition emphasises the critical importance of even small differences in the initial % body fat in dictating the individual’s energy-Pc and, hence, the pattern of lean and fat tissue deposition during weight loss and subsequent weight recovery.
Suppressed thermogenesis: feedback signals from fat tissue
It is well established from longitudinal studies of fasting and energy restriction that the reduction in BMR and total energy expenditure during weight loss is greater than can be accounted for by the loss of active tissues. This reduction in the energy cost of maintenance is adap-tive in that it reduces the rate at which body’s tissues are being depleted, and has been demonstrated both in normal-weight subjects(35,48–50)as well as in obese indi-viduals(48–50). In order to determine whether this adaptive reduction in thermogenesis during weight loss persists dur-ing weight recovery, and underlies the disproportionately greater rate of recovery of fat mass relative to FFM, the Fig. 1. Pattern of changes in energy intake, body fat and fat-free
mass (FFM) during semi-starvation and refeeding in the twelve men who completed all phases of the Minnesota Experiment (including the ad libitum phase of refeeding). All values are expressed as percentages of corresponding values during the control (pre-starvation) period. C12: end of 12 weeks of control period; S12 and S24: end of 12 weeks and 24 weeks of semi-starvation respectively; R12 and R20: end of 12 weeks of restricted refeeding and 8 weeks of ad libitum refeeding, respectively. The double-headed arrow indicates that at the time-point when body fat had been fully recov-ered (i.e. 100 % of control period value), FFM recovery is still far from complete, with hyperphagia persisting until completion of FFM recovery. Adapted from Dullooet al.(41).
Proceedings
of
the
Nutrition
Society
dynamic changes in body composition and BMR of the thirty-two Minnesota men who completed the 24 weeks of semi-starvation and first 12 weeks of restricted refeeding were re-analysed. The data on changes of BMR after adjusting for changes in FFM and fat mass (i.e. an index of energy conservation through suppressed thermogenesis) revealed that (i) the suppression of thermogenesis which was evident during the phase of weight loss persisted dur-ing weight recovery and (ii) the extent to which thermo-genesis was suppressed during the phases of weight loss and weight recovery was determined not only by the food
energy deficit per se but also by the extent to which body fat was depleted(42). This continuum in the relation between suppressed thermogenesis and fat depletion (and not with FFM depletion) during both phases of weight loss and weight recovery (Fig. 3) therefore reflects the opera-tion of a control system with a negative feedback loop be-tween a component of adaptive thermogenesis and the state of depletion of the fat stores, such that suppressed thermogenesis during weight recovery would accelerate body fat recovery. Quantitatively, this suppressed thermogenesis during weight recovery is calculated to
– 500 – 1000 – 1500 – 2000 – 2500 – 3000 – 3500 ∆ Adjusted BMR (KJ /d)
Total thermogenic economy
500 – 500 – 1000 – 1500 – 2000 – 2500 – 3000 – 3500 500 0 Semistarvation (S12) Refeeding (R12) Body fat at S12 (% Control period) Body fat at R12 (% Control period) 100 50 0 100 0 50 150 (r2=0·26, P<0·01) (r2=0·24, P<0·01)
Total thermogenic economy
∆
Adjusted BMR (KJ/d)
Fig. 3. Relation between suppressed thermogenesis, assessed as change in BMR adjusted for changes in fat-free mass (FFM) and fat mass, and the state of depletion of body fat stores, during weight loss (S12, week 12 of semi-starvation) and during weight recovery (R12, week 12 of restricted refeeding). Adapted from Dulloo and Jacquet(42).
Fig. 2. (a) Three-dimensional plot showing inter-relationship between P-ratio during semi-starvation (i.e. proportion of energy mobilised from protein), P-ratio during refeeding (i.e. proportion of energy deposited as protein), and the natural logarithm of body fat recovery during refeeding; Adapted from Dullooet al.(40)
(b) Relationship between the proportions of energy mobilised from protein (P-ratio) during severe energy deficit and the initial (pre-starvation) percentage body fat. All data are from Caucasians and derived from studies of Keyset al.(35), Henryet al.(46)and Passmoreet al.(47). (*) Semi-starvation; (^ ^) prolonged fasting; (
▬
, – –), based on Minnesota Experiment data of body composition either corrected or uncorrected for excess hydration and relative bone mass, respectively; ( ) the range of percentage body fat for normal-weight individuals. Adapted from Dullooet al.(40).Proceedings
of
the
Nutrition
Society
represent an energy economy of 10–15 % in BMR when integrated between 0 and 100 % fat recovery(40,42).
Integrating the control of energy-partitioning and adaptive thermogenesis
An integration of these control systems in the regulation of body composition during a cycle of weight loss and weight recovery is discussed with the help of a schematic diagram presented in Fig. 4. This diagram embodies the findings that the control of body energy-partitioning between pro-tein and fat is an individual characteristic, i.e. individuals vary in their Pc during weight loss and weight recovery, and takes into account the two distinct control systems for adaptive thermogenesis which can operate independently of each other: (i) one that is a direct function of food intake and energy balance (referred to as the non-specific control of thermogenesis, which is under the control of the sym-pathetic nervous system) and (ii) the other that is a direct function of the state of depletion of the fat stores (referred to as the adipose-specific control of thermogenesis)(51). During starvation, the control of partitioning determines the relative proportion of protein and fat to be mobilised from the body as fuel (i.e. the individual’s Pc), and the energy conserved due to suppressed thermogenesis is directed at reducing the energy imbalance, with the net result that there is a slowing down in the rate of protein and fat mobilisation in the same proportion as defined by the Pc of the individual. During starvation, therefore, the
functional role of both control systems underlying sup-pressed thermogenesis is to reduce the overall rate of fuel utilisation. During refeeding, the control of partitioning operates in such a way that protein and fat are deposited in the same relative proportion as determined by the Pc of the individual during starvation, and the increased availability of food leads to the rapid removal of suppression upon the non-specific (sympathetic nervous system-mediated) con-trol of thermogenesis. In contrast, the suppression of the thermogenesis under adipose-specific control is only slowly relieved as a function of fat recovery, such that the energy that continues to be spared is directed specifically at the replenishment of the fat stores. The net effect, as demonstrated(40) using both statistical and numerical approaches in our re-analysis of data from the Minnesota Experiment, is that fat is deposited in excess of that determined by the Pc of the individual, thereby contribut-ing to the disproportionate rate of fat relative to lean tissue recovery. Direct evidence in support for the existence of mechanisms that suppress thermogenesis and accelerate specifically fat mass (and not FFM) can be obtained from animal studies of refeeding after energetic restriction(51). In human subjects, a role for suppressed thermogenesis driv-ing catch-up fat can also be derived from patients reco-vering from malnutrition resulting from non-neoplastic gastrointestinal disease(52), as well as from men and women recovering weight (essentially fat) over 6 months after 2 years of sustained energy restriction in the bio-sphere 2 experiment(53).
Fig. 4. (Colour online) Schematic representation of the regulation of body weight and body composition during a cycle of weight loss (starvation) and weight recovery (refeeding). In this diagram, the two distinct control systems underlying adaptive thermo-genesis (the non-specific control and the adipose-specific control) are integrated with the more ‘basal’ control of partitioning between the body fat and protein compartments as determined by the partitioning characteristic (Pc) of the individual; see text for details; SNS: sympathetic nervous system; adapted from Dulloo and Jacquet(51).
Proceedings
of
the
Nutrition
Society
Compensatory hyperphagia: feedback signals from fat and lean tissues
To gain insights into the determinants of post-starvation hyperphagia in the Minnesota Experiment, the individual data on food intake, body fat and FFM of the twelve sub-jects who remained in the laboratory during the 8 weeks period of ad libitum refeeding (Fig. 1) were used to cal-culate the following variables(41):
(i) A quantitative index of hyperphagia, i.e. the total hyperphagic response during the 8-week ad libitum refeeding period, calculated as the energy intake in excess of that during the pre-starvation (control) period;
(ii) A quantitative index of the degree of fat and FFM depletion just before ad libitum refeeding, calculated as the deviation in fat and FFM from their respective pre-starvation values; and
(iii) A quantitative index of the deficit in energy intake just before ad libitum refeeding, calculated as the difference between the energy intake during the period of restricted refeeding and that during the pre-starvation (control) period.
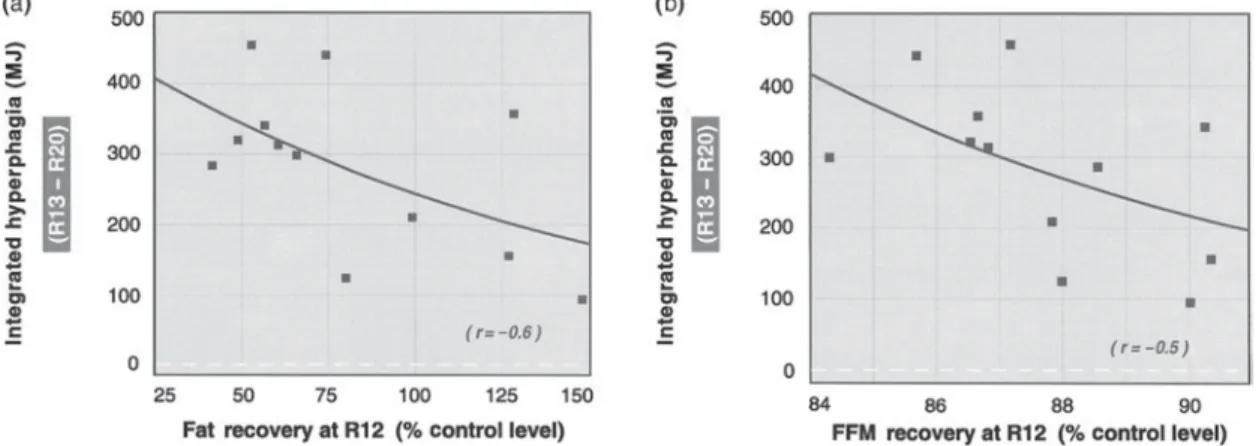
The results indicate that the hyperphagic response over the 8-week ad libitum period was inversely and independently correlated to both the degree of fat depletion and FFM depletion (Fig. 5). Furthermore, the results of stepwise-regression analysis indicated that of the three determinants of hyperphagia, it is the degree of fat depletion that is the strongest, with a significant contribution from lean tissue depletion as well as from the energy intake deficit prior to ad libitum refeeding; the three variables together explained nearly 80 % of variability in post-starvation hyperphagic response. A considerable component of the hyperphagic response to energy deprivation can therefore be regarded as the outcome of an autoregulatory control system that contributes to the restoration of body weight and body composition, with feedback loops between the state of depletion of both the fat and FFM compartments and
hunger–appetite centres in the central nervous system. These findings therefore suggest the existence not only of adipostatic mechanisms, e.g. via leptin system(54), but also of proteinostatic mechanisms in the control of food intake.
The existence of an appetite mechanism driven by the demands for protein generated by lean tissue growth is consistent with the animal and human literature that the nutrient requirements during growth or catch-up growth and the control of food intake are dominated by the impetus for lean tissue growth(55–57). More recently, the notion that a signal(s) associated with lean mass exerts a determining effect over self-selected food consumption has also been proposed by Blundell et al.(58), who in a reas-sessment of data on food intake over a 12-week interven-tion period in adult human subjects found that it was FFM, but not fat mass or BMI, which predicted (as well as correlated with) meal size and daily energy intake. They postulated that this signal may interact with a separate class of signals generated by fat mass. In his proposal for ‘protein–stat’ mechanisms that regulate lean body mass, Millward(57) emphasised that its mode of operation would require an aminostatic component of appetite regulation in which food intake is adjusted to provide the amino acids and protein needs for lean tissue growth or maintenance. However, the evidence in support of the aminostatic theory is fragmentary, and the extent to which the protein requirements for lean tissue (re)growth and appetite control are mediated by plasma changes in amino acids is unknown. An alternative explanation may reside in the increasingly recognised role of the skeletal muscle as an endocrine organ. Recent applications of proteomic appro-aches to investigate factors secreted by skeletal muscle(59) have revealed that myocytes are capable of producing several hundred secreted proteins (i.e. myokines), the identity and function of most of which remain to be elu-cidated. The recognition that a multiplicity of adipokines and myokines are secreted by adipocytes and myocytes, respectively, opens new avenues for research towards their Fig. 5. Relationship between hyperphagic response duringad libitum refeeding and the degree of (a) fat recovery or
(b) fat-free mass (FFM) recovery, both expressed as % control values. The correlation between hyperphagia and one of the two tissue compartments persists after adjusting (by partial correlation) for variability in the other compartment. Adapted from Dullooet al.(41). R12, R20 correspond to the end of 12 weeks of restricted refeeding and 8 weeks ofad libitum refeeding, respectively. R13 corresponds to the first week of ad libitum refeeding.
Proceedings
of
the
Nutrition
Society
potential role in the control of food intake and adaptive thermogenesis.
Body composition autoregulation: a conceptual model On the basis of the findings mentioned earlier, the control systems that operate through the control of energy-parti-tioning, adaptive thermogenesis and hunger–appetite can be incorporated into a conceptual model of autoregulation of body weight and body composition depicted in Fig. 6. In addition to the control of partitioning per se, other control systems operating via the control of food intake and thermogenesis with feedback loops from the lean and/or fat tissue compartments are conceptualised to be dictated by ‘memories’ of the FFM and/or fat compartment; these are,
however, viewed as attenuators of energy imbalance and/or accelerators of tissue recovery that are superimposed over a more ‘basal’ control of energy partitioning.
Implications for ‘Dieting makes some fatter’ One important feature of this model (Fig. 6) is the sharp contrast between the determinants of the two accelerators: whereas the control system operating through increased hunger–appetite is dictated by the degree of depletion both in body fat and FFM, that operating through the adipose-specific suppression of thermogenesis is dictated specifi-cally by the degree of depletion of body fat only (and not by FFM depletion). This differential relationship of hyperphagia and suppressed thermogenesis with regard to the two main energy-containing compartments suggests that there is an asymmetry in the way FFM and fat mass are recovered, with fat being recovered at a faster rate than FFM. Thus, the greater the severity of weight loss (and the degree of fat and FFM depletion), the more the suppression Fig. 6. Conceptual model for autoregulation of body composition
during weight recovery. (I) The control of energy partitioning between lean and fat compartments confers to the individual his/her partitioning characteristic (Pc). The demonstrations that the initial adiposity explains most (about 90 %) of the variability in Pc, and that the Pc of the individual during semi-starvation is conserved during refeeding(40), suggest that the initial body composition expressed as % body fat (which reflects the ratio of fat to fat-free mass (FFM)) provides the individual with a ‘memory of partitioning’ which dictates an autoregulatory control system that underlies partitioning between protein and fat during weight loss and subsequent weight recovery. (II) Thermogenesis, which is suppressed during weight loss, remains suppressed during weight recovery as a function of fat depletion, but unrelated to FFM depletion(42). This leads to the concept for the existence of a ‘fat-stores memory’ which governs the suppression of thermogenesis as a function of the replenishment of the fat stores. Its functional importance is to accelerate specifically fat replenishment, thereby contributing to the disproportionate rate of fat relative to lean tissue recovery. This adipose-specific control of thermogenesis, which specifically accelerates fat recovery is distinct from the ‘non-specific’ control of thermogenesis which functions as an attenuator of energy imbalance, and is dictated by the food energy flux rather than by fat depletion. (III) Hunger– appetite drive leads to hyperphagia, the magnitude of which is determined by the extent to which body fat and FFM are depleted, with the degree of fat depletion being the stronger determinant(41). This hyperphagic response therefore seems to be dictated not only by a memory of the initial fat stores but also by a memory of the initial FFM compartment. The functional importance of this increase in the hunger–appetite sensation, with consequential hyperphagia, is to accelerate the restoration of both lean and fat compartments, as defined by the Pc of the individual.
Fig. 7. (Colour online) (a) Relationship between the extent of fat overshooting and the initial (pre-starvation) percentage body fat. The exponential curve is drawn from data (^) on the twelve men who participated in all phases of the Minnesota experiment. The symbols (^) represent the mean value for men (n 10) participating in each of the Army Ranger training experiments for which body composition data are available(36,38). (b) Mathematical model pre-diction of 12 % weight loss on recovery of body composition and fat overshooting in a lean individual (body weight, 68 kg; % body fat, 13 %) and an obese individual (body weight, 130 kg and % body fat, 45 %); these data are superimposed on Forbes curvilinear relation-ship between FFM and fat mass(60)in lean and obese Caucasians. For the lean data, the dotted line indicates that by the time 100 % fat mass is recovered; FFM recovery is incomplete, with fat over-shooting.
Proceedings
of
the
Nutrition
Society
of thermogenesis that enhances specifically fat deposition (and not FFM deposition) and hence the greater the dis-parity in the rate of fat v. FFM recovery. This would pro-vide an explanation for the fact that when fat recovery in the Minnesota men reached 100 % of pre-starvation values, the FFM recovery was still far from complete (Fig. 1). Since depleted FFM can also drive hyperphagia, a con-sequence of disparity between 100 % fat recovery and incomplete FFM recovery is that the hyperphagia is pro-longed until FFM is also fully recovered. However, since the completion of FFM recovery can only be achieved through the process of energy-partitioning, more body fat is also deposited, which hence underscores the phenom-enon of fat overshooting.
From a perspective of body composition autoregulation therefore, the critical event that eventually leads to the prolongation of hyperphagia and fat overshooting resides in the suppression of thermogenesis which drives fat recovery at a rate that is greater than that determined by the Pc of the individual. As this adipose-specific suppres-sion of thermogenesis (that drives fat acceleration) is a function of fat depletion, and the prolongation of hyper-phagia (after 100 % fat recovery) is a function of depleted FFM still to be recovered, the extent of fat overshooting would therefore depend on the extent to which both fat mass and FFM are depleted; this in turn depends on the Pc of the individual which is dictated primarily by the initial adiposity (Fig. 2(b)). To substantiate this contention, we show here, from the individual body composition data of the twelve men who completed the Minnesota Experiment, that the extent of fat overshooting decreases exponentially with increasing initial adiposity (Fig. 7(a)). Using a math-ematical model (J Jacquet and AG Dulloo, unpublished results) that incorporates the relationships shown in Figs. 2 and 3, the differential body composition responses of an average lean dieter and an average obese dieter losing 12 % of their respective body weight is illustrated in Fig. 7(b); their changes in fat mass and FFM being superimposed on Forbes curve that relates fat mass and FFM(60). Should the lean dieter be subjected to multiple weight cycles, it can also be predicted that the amount of fat overshoot will nonetheless decrease with each successive cycle, since each cycle leads to increased adiposity. The cumulative fat overshoot over several cycles will nonetheless amount to substantial excess of body fat. These results predicting lit-tle or no fat overshooting in obese dieters in accord with studies in which obese individuals subjected to one cycle(61) or three successive cycles(62)of dieting failed to show altered body composition. They are also in line with data from lean individuals who during rehabilitation after losing about 12 % of their weight due to food deprivation (Table 1) showed fat overshooting of about 4 kg(36–38); these data are now superimposed on the curve shown in Fig. 7(a).
Conclusions
Our analysis of how dieting makes some fatter suggests that the lean dieters are at greater risk for fat overshooting than the obese dieters. This contention is in line with
prospective studies indicating more consistent association with increased risks for major weight gain in initially normal-weight subjects than in initially overweight and obese subjects attempting to lose weight(16,24). With the prevalence of dieting increasing among individuals in the normal-weight range (due to pressure for a slim image, body dissatisfaction or athletic performance) and accumu-lating evidence suggesting increased cardiometabolic risks associated with weight fluctuations in the non-obese population groups(4,63), the notion that dieting makes some fatter warrants greater experimental scrutiny and deserves greater public health concern than so far acknowledged.
Acknowledgements
This work was partly supported by a grant from the Swiss National Science Foundation (Grant no. 31–130481). A. G. D. drafted the manuscript. J. J. contributed impor-tantly to data analysis. J. J. and J-P. M. critically revised the manuscript for important intellectual content. All authors have read and approved the final manuscript. The authors have no conflict of interest to declare.
References
1. Procope J (1952) Hippocrates on Diet and Hygiene. London: Zeno.
2. Bacon L & Aphramor L (2011) Weight science: evaluating the evidence for a paradigm shift. Nutr J 10, 9.
3. National Institutes of Health Technology Assessment Con-ference Panel (1993) Methods for voluntary weight loss and control. Ann Intern Med 119, 764–770.
4. Montani JP, Viecelli AK, Pre´vot A et al. (2006) Weight cycling during growth and beyond as a risk factor for later cardiovascular diseases: the ‘repeated overshoot’ theory. Int J Obes 30, Suppl. 4, S58–S66.
5. Kruger J, Galuska DA, Serdula MK et al. (2004) Attempting to lose weight: specific practices among U.S. adults. Am J Prev Med 26, 402–406.
6. Bendixen H, Madsen J, Bay-Hansen D et al. (2002) An observational study of slimming behavior in Denmark in 1992 and 1998. Obes Res 10, 911–922.
7. Lahti-Koski M, Mannisto S, Pietinen P et al. (2005) Pre-valence of weight cycling and its relation to health indicators in Finland. Obes Res 13, 333–341.
8. Mann T, Tomiyama AJ, Westling E et al. (2007) Medicare’s search for effective obesity treatments: diets are not the answer. Am Psychol 62, 220–233.
9. Cannon G & Einzig H (1983) Dieting Makes You Fat. London: Century Publishing.
10. National Task Force on the Prevention and Treatment of Obesity (1994) Weight cycling. JAMA 272, 1196–1202. 11. French SA, Jeffery RW, Forster JL et al. (1994) Predictors
of weight change over 2 years among a population of working adults; The Healthy Worker Project. Int J Obes 18, 145–154.
12. Bild DE, Sholinsky P, Smith DE et al. (1996) Correlates and predictors of weight loss in young adults: the CARDIA study. Int J Obes 20, 47–55.
13. Coakley EH, Rimm EB, Colditz G et al. (1998) Predictors of weight change in men: results from the Health Professionals Follow-up Study. Int J Obes 22, 89–96.
Proceedings
of
the
Nutrition
Society
14. McGuire MT, Wing RR, Hill JO et al. (1999) What predicts weight gain in a group of successful weight losers? J Consult Clin Psychol 67, 177–185.
15. Stice E, Cameron RP, Killen JD et al. (1999) Naturalistic weight-reduction efforts prospectively predict growth in relative weight and onset of obesity among female adoles-cents. J Consult Clin Psychol 67, 967–974.
16. Korkeila M, Rissanen A, Kaprio J et al. (1999) Weight-loss attempts and risk of major weight gain: a prospective study in Finnish adults. Am J Clin Nutr 70, 965–975.
17. Juhaeri J, Stevens J, Chambless LE et al. (2001) Weight change among self-reported dieters and non-dieters in white and African American men and women. Eur J Epidemiol 17, 917–923.
18. Kroke A, Liese AD, Schulz M et al. (2002) Recent weight changes and weight cycling as predictors of subsequent two year weight change in a middle-aged cohort. Int J Obes 26, 403–409.
19. Drapeau V, Provencher V, Lemieux S et al. (2003) Do 6-y changes in eating behaviours predict changes in body weight? Results from the Quebec Family Study. Int J Obes 27, 808–814.
20. Vogels N, Diepvens K & Westerterp-Plantenga MS (2005) Predictors of long-term weight maintenance. Obes Res 13, 2162–2168.
21. Field AE, Aneja P, Austin SB et al. (2007) Race and gender differences in the association of dieting and gains in BMI among young adults. Obesity 15, 456–464.
22. Neumark-Sztainer D, Wall M, Haines J et al. (2007) Why does dieting predict weight gain in adolescents? Findings from project EAT-II: a 5-year longitudinal study. J Am Diet Assoc 107, 448–455.
23. Field AE, Malspeis S & Willett WC (2009) Weight cycling and mortality among middle-aged or older women. Arch Intern Med 169, 881–886.
24. Pietila¨inen KH, Saarni SE, Kaprio J et al. (2011) Does diet-ing make you fat? A twin study. Int J Obes 36, 456–464. 25. Saarni SE, Rissanen A, Sarna S et al. (2006) Weight
cycling of athletes and subsequent weight gain in middleage. Int J Obes 30, 1639–1644.
26. Hill AJ (2004) Does dieting make you fat? Br J Nutr 92, Suppl. 1, S15–S18.
27. Lowe MR & Timko CA (2004) Dieting: really harmful, merely ineffective or actually helpful? Br J Nutr 92, Suppl. 1, S19–S22.
28. Cannon G (2005) Dieting. makes you fat? Br J Nutr 93, 569–570.
29. Keski-Rahkonen A, Neale BM, Bulik CM et al. (2005) Intentional weight loss in young adults: sex-specific genetic and environmental effects. Obes Res 13, 745–753.
30. Dulloo AG (1997) Human pattern of food intake and fuel-partitioning during weight recovery after starvation: a theory of autoregulation of body composition. Proc Nutr Soc 56, 25–40.
31. Benedict FG (1907) The influence of Inanition on Meta-bolism. Carnegie Institute of Washington Publication No. 77. Washington, DC: Carnegie Institute of Washington. 32. Benedict FG, Miles WR, Roth P et al. (1919) Human Vitality
and Efficiency under Prolonged restricted Diet. Carnegie Institute of Washington Publication No. 280. Washington, DC: Carnegie Institute of Washington.
33. Fleisch A (1947) Erna¨hrungsprobleme in Mangelzeiten (Nu-tritional Problems During Food Rationing) Basel: Benno Schwabe & Co.
34. Martin E & Demole M (1973) Une expe´rience scientifique d’alimentation controle´e: le rationnement en Suisse pendant la deuxie`me guerre mondiale (A scientific experiment of
controlled food intake: food rationing in Switzerland during World War II). In Re´gulation de l’Equilibre Energe´tique chez l’Homme, Vol. 1, pp. 185–193 [M Apfelbaum, editor]. Paris: Masson.
35. Keys A, Brozek J, Henschel A et al. (1950) The Biology of Human Starvation. Minnesota: University of Minnesota Press. 36. Nindl BC, Friedl KE, Frykman PN et al. (1997) Physical performance and metabolic recovery among lean, healthy men following a prolonged energy deficit. Int J Sports Med 18, 317–324.
37. Young AJ, Castellani JW, O’Brien C et al. (1998) Exertional fatigue, sleep loss, and negative energy balance increase susceptibility to hypothermia. J Appl Physiol 85, 1210–1217. 38. Friedl KE, Moore RJ, Hoyt RW et al. (2000) Endocrine markers of semistarvation in healthy lean men in a multi-stressor environment. J Appl Physiol 88, 1820–1830. 39. Polivy J & Herman CP (1985) Dieting and bingeing: a causal
analysis. Am Psychol 40, 193–201.
40. Dulloo AG, Jacquet J & Girardier L (1996) Autoregulation of body composition during weight recovery in human: the Minnesota Experiment revisited. Int J Obes 20, 393–405. 41. Dulloo AG, Jacquet J & Girardier L (1997) Poststarvation
hyperphagia and body fat overshooting in humans: a role for feedback signals from lean and fat tissues. Am J Clin Nutr 65, 717–723.
42. Dulloo AG & Jacquet J (1998) Adaptive reduction in basal metabolic rate in response to food deprivation in humans: a role for feedback signals from fat stores. Am J Clin Nutr 68, 599–606.
43. Dulloo AG & Jacquet J (1999) The control of partitioning between protein and fat during human starvation: its internal determinants and biological significance. Br J Nutr 82, 339–356.
44. Dulloo AG (1997) Regulation of body composition during weight recovery: integrating the control of energy partition-ing and thermogenesis. Clin Nutr 16, Suppl. 1, 25–35. 45. Payne PR & Dugdale AE (1977) Mechanisms for the control
of body-weight. Lancet i, 583–586.
46. Henry CJ, Rivers JP & Payne PR (1988) Protein and energy metabolism in starvation reconsidered. Eur J Clin Nutr 42, 543–549.
47. Passmore R, Strong JA & Ritchie FJ (1958) The chemical composition of the tissue lost by obese patients on a reducing regimen. Br J Nutr 12, 113–122.
48. Luke A & Schoeller DA (1992) Basal metabolic rate, fat-free mass, and body cell mass during energy restriction. Metabo-lism 41, 450–456.
49. Major GC, Doucet E, Trayhurn P et al. (2007) Clinical significance of adaptive thermogenesis. Int J Obes 31, 204–212.
50. Rosenbaum M, Hirsch J, Gallagher DA et al. (2008) Long-term persistence of adaptive thermogenesis in subjects who have maintained a reduced body weight. Am J Clin Nutr 88, 906–912.
51. Dulloo AG & Jacquet J (2001) An adipose-specific control of thermogenesis in body weight regulation. Int J Obes 25, Suppl, 5, S22–S29.
52. Carbonnel F, Messing B, Rimbert A et al. (1997) Energy and protein metabolism during recovery from malnutrition due to nonneoplastic gastrointestinal disease. Am J Clin Nutr 65, 1517–1523.
53. Weyer C, Walford RL, Harper IT et al. (2000) Energy metabolism after 2 y of energy restriction: the biosphere 2 experiment. Am J Clin Nutr 72, 946–953.
54. Kissileff HR, Thornton JC, Torres MI et al. (2012) Leptin reverses declines in satiation in weight-reduced obese humans. Am J Clin Nutr 95, 309–317.
Proceedings
of
the
Nutrition
Society
55. Webster AJ (1993) Energy partitioning, tissue growth and appetite control. Proc Nutr Soc 52, 69–76.
56. Waterlow J (1992) Protein Energy Malnutrition. London: Edward Arnold.
57. Millward DJ (1995) A protein–stat mechanism for the reg-ulation of growth and maintenance of the lean body mass. Nutr Res Rev 8, 93–120.
58. Blundell JE, Caudwell P, Gibbons C et al. (2012) Body composition and appetite: fat-free mass (but not fat mass or BMI) is positively associated with self-determined meal size and daily energy intake in humans. Br J Nutr 107, 445–449.
59. Trayhurn P, Drevon CA & Eckel J (2011) Secreted proteins from adipose tissue and skeletal muscle – adipokines,
myokines and adipose/muscle cross-talk. Arch Physiol Bio-chem 117, 47–56.
60. Forbes GB (1987) Lean body mass-body fat interrelation-ships in humans. Nutr Rev 45, 225–231.
61. Wadden TA, Foster GD, Stunkard AJ et al. (1996) Effects of weight cycling on the resting energy expenditure and body composition of obese women. Int J Eat Disord 19, 5–12. 62. Jebb SA, Goldberg GR, Coward WA et al. (1991) Effects of
weight cycling caused by intermittent dieting on metabolic rate and body composition in obese women. Int J Obes 15, 367–374. 63. Dulloo AG, Jacquet J, Seydoux J et al. (2006) The thrifty ‘catch-up fat’ phenotype: its impact on insulin sensitivity during growth trajectories to obesity and metabolic syn-drome. Int J Obes 30, Suppl. 4, S23–S35.