Regional
water quality patterns in an alluvial aquifer: Direct
and
indirect influences of rivers
A. Baillieux,
D. Campisi, N. Jammet, S. Bucher, D. Hunkeler
⁎
Centre for Hydrogeology & Geothermics (CHYN), University of Neuchatel, Rue Emile Argand 11, CH-2000 Neuchatel, Switzerland
a b s t r a c t
The influence of rivers on the groundwater quality in alluvial aquifers can be twofold: direct and indirect. Rivers can have a direct influence via recharge and an indirect one by controlling the distribution of fine-grained, organic-carbon rich flood deposits that induce reducing conditions. These direct and indirect influences were quantified for a large alluvial aquifer on the Swiss Plateau (50 km2) in interaction with an Alpine river using nitrate as an example. The hydrochemistry and stable isotope composition of water were characterized using a network of 115 piezometers and pumping stations covering the entire aquifer. Aquifer properties, land use and recharge zones were evaluated as well. This information provided detailed insight into the factors that control the spatial variability of groundwater quality. Three main factors were identified: (1) diffuse agricultural pollution sources; (2) dilution processes resulting from river water infiltrations, revealed by the δ18OH2O and δ2HH2O contents of groundwater; and (3) denitrification processes, controlled by the spatial variability of flood deposits governed by fluvial depositional processes. It was possible to quantify the dependence of the nitrate concentration on these three factors at any sampling point of the aquifer using an end-member mixing model, where the average nitrate concentration in recharge from the agricultural area was evaluated at 52 mg/L, and the nitrate concentration of infiltrating river at approximately 6 mg/L. The study shows the importance of considering the indirect and direct impacts of rivers on alluvial aquifers and provides a methodological framework to evaluate aquifer scale water quality patterns.
Keywords: Dilution Denitrification Alluvial aquifer Flood plain Stable isotope Diffuse pollution 1. Introduction
Alluvial plains frequently harbor productive aquifers that play an important role for drinking water supply and irrigation. River sediments often form shallow aquifers composed of gravel, sand, silt or clay deposited in river channels or on floodplains (He and Walling, 1997). Alluvial aquifers close to mountain ranges are often particularly permeable and produc-tive due to the presence of coarse material. Alluvial plains are often also hotspots of human activity with traffic routes, settlements and intense agriculture. Soils formed in organic-rich river deposits are fertile (Schaetzl and Anderson, 2005)
and water is abundant for irrigation. Hence, a large fraction of the recharge area might be used for growing crops. As water tables in alluvial aquifers are often shallow and deposits permeable, alluvial aquifers are vulnerable to contamination. Elevated nitrate concentrations can be observed in many aquifers, impacting the quality of drinking water supply wells. It is important to understand the factors that control nitrate levels and groundwater quality patterns in general in view of the long-term exploitation of alluvial aquifers.
Different factors can influence groundwater quality pat-terns in alluvial aquifers. Here nitrate patpat-terns are discussed although spatial patterns of other substances (e.g. pesticides) are influenced by similar factors. Alluvial aquifers often interact with rivers. In humid areas, nitrate levels in larger rivers are frequently fairly low especially in headwater areas since
⁎ Corresponding author.
agriculture is usually less intense compared to downstream plains. Hence, groundwater–surface water interactions can lead to a zone of lower nitrate concentration along rivers, in contrast with nitrate-rich groundwater recharged through farmlands (Debernardi et al., 2008; Hosono et al., 2013; Pinay et al., 1998). At locations dominated by direct recharge, evapotranspiration and water input including irrigation are the main physical processes that influence nitrate concentra-tion as shown in a study that compares five agriculture regions throughout the USA (Green et al., 2008). In addition, nitrate levels might also be influenced by biogeochemical processes, especially plant uptake and denitrification (Bohlke et al., 2002; Haycock and Burt, 1993; Kellogg et al., 2005; McMahon and Bohlke, 1996). Numerous studies have investigated denitrifi-cation in the riparian zone (Burt et al., 1999; Clement et al., 2003; Kellogg et al., 2005; Maitre et al., 2005) and in aquifers in general (Bohlke et al., 2002; Green et al., 2008; Tesoriero and Puckett, 2011). Denitrification in riparian zones has frequently been attributed to shallow water table conditions and/or soil quality. According to Pinay et al. (2000), soil texture in alluvial sediments, particularly the silt and clay fraction, is closely related to the denitrification potential. Similarly, Schilling and Jacobson (2012) linked the lithology of alluvial sediments to the potential of denitrification. They documented greater organic content in fine-textured materials of swale sediments, known to promote denitrification. Hence, rivers might have a two-fold influence on nitrate concentrations: a direct influence via dilution and an indirect one by controlling on a long time-scale spatial patterns of fine-grain, organic-carbon rich sedi-ments that promote denitrification. While the nitrate behavior in the vicinity of streams and at the scale of agricultural parcels has attracted a great deal of attention so far, there is only limited information on nitrate patterns at the scale of entire alluvial aquifers directly and indirectly influenced by rivers.
Rationalizing the spatial variability of nitrate concentrations in the proximity of rivers can be challenging since both biogeochemical and dilution processes affect the concentration, independently of the spatial variability of land use. Several studies have analyzed stable isotopes in nitrate to demonstrate denitrification and to differentiate it from dilution (Hosono et al., 2013; Mariotti et al., 1988). In another study, chemical parameters (e.g., chloride; Pinay et al., 1998) were used to quantify the mixing of surface water and groundwater.
The aim of this study is to identify and quantify the various factors that influence the spatial distribution of nitrate concentrations at the scale of an alluvial aquifer, with a special focus on the effect of a river crossing the aquifer. More specifically, the goal of the study is to evaluate the relative role of dilution vs. denitrification on spatial patterns of nitrate at the aquifer scale, to evaluate how denitrification was related to alluvial plain characteristics and to provide a methodological framework to differentiate the two effects.
The northern part of the Seeland aquifer, located in central Switzerland, was chosen as a study site. The site is well suited since land use is relatively homogeneous throughout the catchment area of the aquifer, fertilizer input rates are constrained by agricultural regulations and irrigation has a negligible effect on the aquifer water balance. Therefore, variations in nitrate concentrations at the scale of the aquifer are expected to be predominantly related to direct or indirect influences of the river rather than due to variations in fertilizer
and water inputs. Furthermore, a dense network of monitoring wells is available throughout the aquifer. The direct influence of river water was mapped based on the stable isotope composi-tion of water as direct recharge by precipitacomposi-tion and river water are expected to have a distinctly different isotope signature due to the origin of the river from a high altitude. Based on the mixing ratios, expected nitrate concentrations due to dilution only were calculated and compared to measured concentrations in order to locate denitrification zones. These zones were related to the alluvial soil quality and processes that control the architecture of the alluvial plain. This approach could be applicable in future studies to better understand the sources and the attenuation mechanisms of groundwater nitrate pollu-tion in alluvial aquifers.
2. Study area
The Seeland region is located in the northwestern part of Switzerland (Fig. 1). The unconfined North-Seeland aquifer was formed by the deltaic depositional system of the Aare River, which took place after the last Pleistocene glaciations (Würm). Basement rocks underlying the aquifer are composed of the Tertiary Molasse of the Swiss Plateau, which constitutes most of the reliefs surrounding the aquifer. During the Riss glacial period, the Rhone Glacier carved out this bedrock valley that is partly filled by ground moraines. These deposits are covered with a series of glacio-lacustrine sediments, repre-sented mostly by clay with locally gravelly lenses, exceeding a thickness of 200 m. During the last glaciations, large amounts of glaciofluvial gravel (‘Seeland gravel’ in Fig. 1) were deposited in front of the Rhone Glacier. The successive avulsions of the meandering Aare River led to a variable lithology of the unconsolidated Quaternary sediments (‘Aare deposits’ in Fig. 1), which varies from well-sorted gravels to clay. The average thickness of these deposits in the alluvial plain is approximately 25 m and can reach 50 m in the Aarberg– Kappelen region. Up to 10 m of flood deposits (‘fine sediments’ in Fig. 1) are observed in the northeast border of the plain. The deltaic depositional system has led to a strong heterogeneity of the sediments, but on a larger scale, the aquifer is relatively homogeneous (Kozel, 1992). Until the 19th century and the first river engineering works (Jura water corrections, 1868–1891), this large area was a floodplain of the Aare River (Kozel, 1992), limiting its exploitation for human activities. After the river engineering works, the swamps and marshes were drained and turned into farmlands.
The Seeland aquifer is the largest aquifer in the Bern region. It is crossed by the Hagneck Canal that divides the aquifer into two main parts. The study area, known as the North-Seeland aquifer, is located in the northern part of the Seeland region and covers a total area of some 50 km2 (Fig. 1). The upstream boundary of the aquifer consists of the Hagneck Canal (Kellerhals and Haefeli, 1988), which corresponds to a water divide caused by the strong infiltration of water. From this southern boundary, groundwater flows to the northeast. Along the eastern boundary, piezometric levels show that exchanges may occur between groundwater and stream water of the Alteaare River, which corresponds to the former course of the Aare River before the Hagneck Canal was constructed. The aquifer discharges into the Nidau-Büren Canal in the north. Several pumping wells are located in the aquifer, a series of five
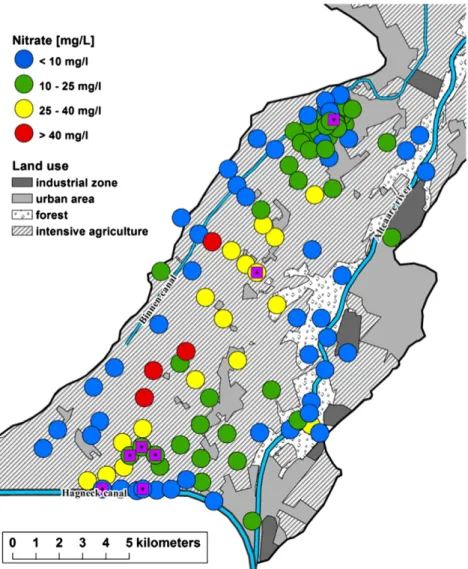
pumping wells near the Hagneck Canal (WVS pumping wells in Fig. 1, for a total of up to 18,700 m3/day) and two main pumping systems in the north of the aquifer, in Kappelen (PW pumping well, 620 m3/day) and in Worben (SWG pumping well, 3000 m3/day). The capture zones of these pumping wells, which were calculated by Jordan (2000), are illustrated in Fig. 1. Intensive agriculture (including meadows) represents the main land use in the aquifer area (Fig. 2), covering almost 75%of the recharge area downgradient of the rivers. Intensive agriculture is known to favor the leaching of nitrate from soils and to increase the nitrate concentrations in the diffuse recharge of the aquifers. We expect that nitrate input is fairly homogeneous at the catchment scale for several reasons. The main physical factors that control nitrate concentrations are N application rates, water inputs and evapotranspiration (Green et al., 2008). Given that similar crop rotations are used throughout the study area and fertilizer rates are tightly controlled by regulations, N application can be assumed to be
fairly homogeneous at the aquifer scale. The rather small agricultural plots further contribute to a homogenization of minor variations of N inputs among plots when considering the aquifer scale. In addition, water inputs by irrigation which can strongly influence nitrate concentrations (Green et al., 2008) account for only about 1.3% of the total groundwater recharge (Geotechnisches Institut AG Bern, 2005).
3. Methods
The study relies on a dense monitoring network covering the entire alluvial plain consisting of 108 monitoring wells and seven pumping wells. A total of 322 samples were collected during the summer period of the years from 2009 to 2012 and analyzed for nitrate, dissolved oxygen and stable isotopes (18O, 2H) of water. Some monitoring wells were
sampled during each campaign to verify that the chemistry did not present a significant intra-annual fluctuation. Concentrations
Fig. 1. Hydrogeological map of the North-Seeland aquifer and geological settings, modified from Geotechnisches Institut AG Bern (2005); location in Switzerland illustrated in the bottom right corner.
were fairly stable from one sampling campaign to another. We noted that in 50% of the sampling points, the relative concentration variations were below 3% for nitrate andδ18O
H2O
variations below 0.5‰. In addition, 80% of the sampling points showed variations below 6% for nitrate and below 0.8‰ for δ18O
H2O, respectively. Due to the small variations among
sampling campaigns and since spatial patterns are of main interest in this study, average values for each monitoring well are reported. In 2012,δ2H
H2Ovalues were not analyzed. In order
to constrain the nitrate concentration of water infiltrating through agricultural fields, six 2 inch shallow monitoring wells reaching to a maximum of 5.3 m below the water table were installed in spring 2012 and sampled together with four existing shallow wells (screen up to 6.2 m below water table). As indicated by the hydrochemistry and stable isotope ratios of water samples and based on their location, these wells sample water that had infiltrated through agricultural fields and is not influenced by river water. Furthermore, with one exception, dissolved oxygen concentrations were N2.5 mg/L (average 5.8 mg/L) suggesting that nitrate concentrations are not influenced by denitrification.
During sampling of all monitoring and pumping wells, the dissolved oxygen O2[mg/l] was measured with a Hach HQ40d
multi-parameter meter, equipped with the LDO101 dissolved oxygen probe. Nitrate concentrations were performed by ion chromatography (DIONEX DX-120). The 18O and 2H stable
isotope composition of water samples were determined using cavity ring-down spectroscopy (Los Gatos Liquid Water DTL). Analysis accuracies are ±0.1 mg/L for dissolved oxygen concentration, ±0.1 mg/L for nitrate concentrations, ±1.0‰ for δ2
HH2O and ±0.3‰ for δ
18
OH2O. The detection limit was
0.3 mg/L for nitrate and 0.1 mg/L for dissolved oxygen. 4. Results and discussion
Fig. 2 illustrates the spatial distribution of nitrate concen-trations. Despite the relatively homogeneous land use at a large scale, dominated by intense agriculture, nitrate concentrations are spatially heterogeneous with concentrations varying between b0.3 and 53.2 mg/L. Elevated concentrations are observed in a central axis of the plain. In contrast, in the vicinity of the northwest boundary of the aquifer, which is an area also
subject to intensive agricultural practices, the nitrate content is very low. Low nitrate concentrations are also observed in the vicinity of the Alteaare river and around the SWG pumping well (northern sector).
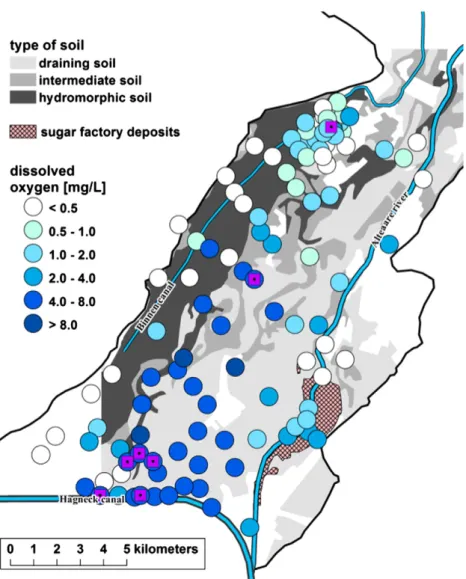
Fig. 3 shows the spatial distribution of dissolved oxygen, which varies from b0.1 to 9.2 mg/L. The lowest dissolved oxygen concentrations are observed along the northwest boundary of the aquifer, in its northern part and down gradient of the sugar factory settling ponds, along the Alteaare River. The highest values occur downgradient of the Hagneck Canal.
Fig. 4 shows the spatial distribution of the δ18OH
2O in
groundwater. The stable isotope composition of groundwater also varied strongly with δ18OH
2Ovalues between −12.0‰ and
−8.7‰ and δ2HH
2O values between −85.8‰ and −61.9‰. A
gradient of the isotopic composition can be observed from the southeastern side, along the Alteaare River and the Hagneck Canal, to the northeast border of the plain where the isotopic composition is heavier (up to −8.7‰). Fig. 5 shows that the
ratios of stable water isotopes are clustered around the Central Swiss Meteoric Water Line (CSMWL).
The linear relationship between 18O and 2H in water supports the hypothesis of a two end-member mixing process in the North-Seeland aquifer, between water with a higher isotopic composition (δ18OH
2O= −8.7‰ and δ
2HH
2O
= −61.9‰) and a lower isotopic composition (δ18OH
2O =
−12.0‰ and δ2
HH2O = −85.8‰). The two end-members
correspond to local precipitation and water imported from the alpine area via the Aare river as confirmed by comparing these values with data from the National Groundwater Monitoring (NAQUA) network (Schurch et al., 2003). The more enriched end-member lies between the average rainwater isotope values for stations located
110 km south west (station of Nyon, δ18OH
2O= −8.3‰) and
20 km south east (station of Bern, δ18OH
2O = −9.6‰) on the
Swiss plateau. The more depleted end-member is close to the average isotope signature of the Aare at the
Fig. 3. Pedological map showing the hydromorphic soil with reducing character, well-drained soil and an intermediate soil, modified from Peyer et al. (1982); location of organic matter deposits (from sugar factory waste); spatial distribution of dissolved oxygen in groundwater [mg/L].
station of Thun (δ18
OH2O = −12.6‰ and δ
2
HH2O = −91.6‰,
13 year time series), located 60 km upgradient of the study site.
The slightly more positive value (δ18OH
2O = −12.0‰) is due
to the contribution of tributaries with a lower catchment altitude between Thun and the study site. Although not investigated in this study, seasonal variations in isotope ratios are expected to be small as the seasonally varying rainwater signature is expected to be smoothed out by the transfer through the 2–10 m thick vadose zone and seasonal variations of the isotope ratios of the Aare at Thun are 0.2‰ for 18O and 2.5‰ 2H due to its passage through Lake Brienz and Lake Thun.
Therefore, in Fig. 5, the sample with the highest δ18O H2O
and δ2HH
2Ovalues can be considered as the local precipita-tion
end-member, while the sample with the lowest δ18OH
2O and
δ2H
H2O can be identified as the river end-member.
Intermediate plotted points of Fig. 5 would be the result of the mixing between recharge by river water and by local precipitation. Based on this assumption, the proportion of these two recharge sources can be calculated for each sampling point. This ratio is calculated using the orthogonal projection of
the points of Fig. 5 onto the linear fit shown in Fig. 5. The linear fit was calculated using the ordinary least squares method. Fig. 4 shows the spatial distribution of the content of river water in the aquifer. In Fig. 4, the river water content was manually interpolated.
The highest river water contents are observed downgradient from the Hagneck Canal and along the upper part of the Alteaare River (Fig. 4). The contents of river water gradually decrease as the distance from the rivers increases. While the WVS pumping wells located close to the canal (WVS 4 and WVS 5) present a river water content of approximately 90%, this value ranges from 61% to 74% in the WVS pumping wells further away (WVS1, WVS2 and WVS3). The river water content is 43% in the PW pumping well, which is located in the center of the aquifer, and 27% in the SWG pumping well, which is located in the northern part of the aquifer. The content drops to below 20% in the northwest area of the aquifer. This pattern is consistent with the functioning of the aquifer. Groundwater from river recharge is increasingly superimposed with water from direct recharge along the flow lines.
Fig. 4. Spatial distribution of stable isotope ratioδ18
O [‰] in groundwater (colored circles); manual interpolation of calculated river water content in groundwater (gray scale).
infiltration. However, when plotting the NO3− concentration vs the river water content (Fig. 6), there is no simple relationship between nitrate concentration and river water fraction. Thus dilution is not the only process that influences NO3− concentrations. The points fall within a triangle with an upper limit forming a rather constant slope. In order to further analyze the relative role of mixing versus other processes, the nitrate concentration of the two dominant end-members, river water and direct recharge from agricul-ture field were included in Fig. 6 connected by a mixing line. The average river water nitrate concentration over a period of 7 years corresponds to 5.6 ± 1.9 mg/L (σ, n = 150) as reported by the federal environmental agency (OFEV, 2013). The average nitrate concentration of water that has recharged through the agricultural fields was estimated by sampling 10 shallow wells reaching to up to 6.2 m below the water table (average 4.2 m). The wells were neither influenced by river water recharge nor by denitrification as suggested by the presence of dissolved oxygen. For these wells an average nitrate concentration of 51.8 ± 10.5 mg/L (n = 10) was obtained. The fairly constant nitrate concen-tration confirms that N inputs from agriculture are fairly homogeneous. Nitrate concentrations of six of the seven pumping wells located close to the Hagneck canal or in the central part of the aquifer follow the mixing line closely. Nitrate concentration of a total of 32 monitoring wells fall within the envelope surrounding the variability of the end members with some scatter (shaded envelope in Fig. 6). One pumping well (SWG) and 76 sampling points fall below the envelope suggesting that they are influenced by processes other than simple mixing of two water types.
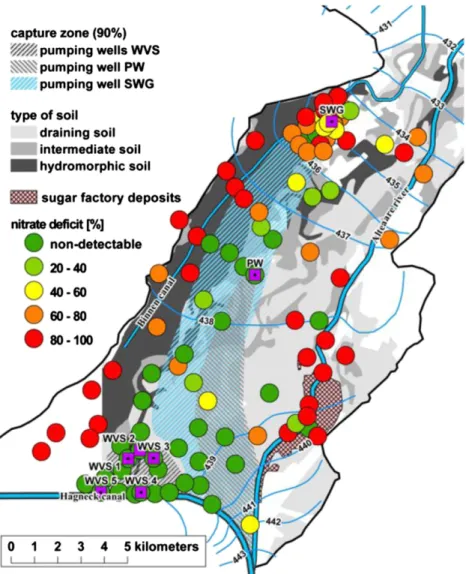
The SWG point presents a river water content of 27% and a nitrate concentration of 18.7 mg/L. According to a simple two end-member mixing model between river water and water infiltrated though the aquifer area, the nitrate concentration of the SWG pumping well should correspond to 41 ±8 mg/L. Hence, the nitrate concentration deficit ranges between 41%and 61% compared to its theoretical value based on a simple mixing model. Using the same mathematical procedure, the nitrate deficit is calculated for each sampling point of the aquifer (Fig. 7).
Based on Fig. 7, the distribution of the nitrate deficit can be related to possible drivers of denitrification, i.e., the hydromor-phic soils with a high content of organic matter and the organic waste pollution from sugar factory settling ponds. In the northwest area along the aquifer boundary, the calculated nitrate deficit exceeds 80%. As shown in Fig. 3, this area presents low oxygen contents and hydromorphic soils that probably have a high organic matter content, thus promoting denitrification. Similar nitrate deficits are observed in the direct downgradient area of the sugar factory settling ponds. This is consistent with the study of Wersin et al. (2001) on the redox plume developed next to these settling ponds, which clearly leads to denitrifying processes. However, in this part of the aquifer, it cannot be excluded that the forested area (Fig. 2) located along the Alteaare River has also an influence on the observed low nitrate concentrations. Using the results of the present study, it is not possible to distinguish which of these two mechanisms is responsible for the observed low nitrate concentration and to quantify their relative importance. In the southern and central parts of the North-Seeland aquifer, the
Fig. 5. The δ2
H vs. δ18O correlation diagram. The Central Swiss Meteoric
Water Line CSMWL [Kullin and Schmassmann (1991)] is represented by the dashed line. Results of the main pumping wells are shown by purple squares.
Low concentrations of nitrate are located in the direct downstream area of the Hagneck Canal, and along the Alteaare River (Fig. 2). This observation is consistent with the mixing of nitrate-rich water from the farmlands with river water
Fig. 6. NO3− vs. river water content correlation diagram. The black line represents the mixing between the river water and the direct recharge. The shaded envelope represents the variability (σ) of the end-members. Main pumping wells are shown by purple squares.
nitrate deficit is non-detectable. This area is characterized by well-drained soils with characteristics that limit the develop-ment of denitrification.
Fig. 7 also shows that intermediate nitrate deficits, ranging from 20% to 80%, are less common. Since most of these sampling points are located at the margin of the denitrifying areas, we can assume that the nitrate concentration at these sampling points is the result of a mixing process between undenitrified groundwater and denitrified groundwater. Finally, the capture zones illustrated in Fig. 7 are useful to explain the groundwater quality observed at the pumping wells. For the pumping wells PW and WVS, the catchment area is dominated by well-drained soil with characteristics that limit the development of denitrificaiton, which explains the absence of a detectable nitrate deficit. However, while the residual nitrate deficit is also non-detectable in most of the sampling points in this area, it locally reaches 20% to 80% in several points. These local zones with denitrification likely reflect smaller scale variations in soil properties and organic carbon content which are not reflected
in the regional scale soil map. The capture zone of SWG covers areas with hydromorphic and well-drained soil (Fig. 7) consistent with the calculated nitrate deficit of 41 to 61%.
5. Conclusion
This study analyzed two major mechanisms whereby a river may influence the nitrate concentration of groundwater in an alluvial aquifer draining an agricultural area. Farming practices are responsible for the high rate of nitrate leaching through soils that causes elevated levels of nitrate concentration in groundwater: up to 53 mg/L in the North-Seeland aquifer. The study demonstrated that the river, associated with an aquifer, contributes to the reduction of nitrate content. The various roles of the river can be classified into direct or indirect impacts. Infiltration of river water into the aquifer directly impacts the nitrate content via a dilution process. This dilution leads to a decrease of nitrate concentrations in the southern part of the aquifer, next to the Hagneck Canal and along the Alteaare River
Fig. 7. Spatial distribution of the deficit in nitrate concentration in groundwater in comparison to the simple dilution process of water from agricultural zones by river water.
(Fig. 2). Moreover, soils from former swamps and flood deposits also related to the river have an impact on the nitrate concentration throughout the aquifer. During flood events, coarser material was likely deposited closer to the river forming well-draining soils and finer grained material further away. The hydromorphic soils that are predominately located further away from the former course of the Aare (Alteaare) can be related to denitrifying processes, which strongly reduce the nitrate concentration in the area (Fig. 2). Hence depositional processes controlling the alluvial plain architecture constitute the indirect impacts of the river on groundwater quality patterns. In addition to these direct and indirect impacts of the river, the organic matter from the settling ponds of the sugar factory may also play a role in locally reducing nitrate in the downstream part of this area.
Using a small number of chemical parameters, the connec-tion between the funcconnec-tioning of the North-Seeland aquifer and the spatial distribution of the nitrate concentration in ground-water was established qualitatively and quantitatively. Stable isotopes of hydrogen and oxygen in the water made it possible to spatially quantify the content of river water within the aquifer as well as the nitrate dilution that can be attributed to it. A simple comparison of the potential dilution with the nitrate contents made it possible to spatially quantify the nitrate deficit that can be attributed to the denitrifying processes. This study demonstrated how direct and indirect impacts of the rivers control the spatial distribution of nitrate concentrations in the aquifer. In the North-Seeland aquifer, denitrifying processes and dilution processes have a comparable effect on nitrate reductions.
As a result of both dilution and denitrification, nitrate levels remain fairly low despite intense agriculture throughout the catchment area. While denitrification processes cannot be directly influenced, it is crucial to ensure river-aquifer connec-tivity to maintain a sufficient groundwater quality for drinking water use in the long term. The study also shows that pumping wells have to be placed carefully within such an aquifer setting considering their catchment zones. Particularly, if wells capture water only from well-drained soils used for intense agriculture, nitrate levels will exceed drinking water levels.
Finally, the North-Seeland aquifer is characterized by rather homogeneous land use in its catchment, and by two types of well-identified recharge zones with contrasting isotopic signa-tures. The simple interpretation presented here may therefore not be directly transferable to other aquifers with more heterogeneous land use and less contrasting isotope data, as typical for non-mountainous agricultural areas. However, the present approach can still be useful to identify the zones where nitrate content cannot be explained by agricultural inputs and the river attenuations. More focused investigations in these zones would then be necessary to pinpoint other mechanisms influencing the groundwater quality.
Acknowledgments
The authors acknowledge the Swiss Federal Office for the Environment (FOEN) for their collaboration and financial support. We also thank Alfred Brechbühler (Wasserverbund Seeland) and Roman Wiget (Seeländische Wasserversorgung) for providing access to their data and sampling points.
References
Bohlke, J.K., Wanty, R., Tuttle, M., Delin, G., Landon, M., 2002.Denitrification in the recharge area and discharge area of a transient agricultural nitrate plume in a glacial outwash sand aquifer, Minnesota. Water Resour. Res. 38 (7).
Burt, T.P., Matchett, L.S., Goulding, K.W.T., Webster, C.P., Haycock, N.E., 1999.
Denitrification in riparian buffer zones: the role of floodplain hydrology. Hydrol. Process. 13 (10), 1451–1463.
Clement, J.C., Aquilina, L., Bour, O., Plaine, K., Burt, T.P., Pinay, G., 2003.
Hydrological flowpaths and nitrate removal rates within a riparian floodplain along a fourth-order stream in Brittany (France). Hydrol. Process. 17 (6), 1177–1195.
Debernardi, L., De Luca, D.A., Lasagna, M., 2008.Correlation between nitrate concentration in groundwater and parameters affecting aquifer intrinsic vulnerability. Environ. Geol. 55 (3), 539–558.
Geotechnisches Institut AG Bern, 2005.Hydrogeologie Seeland Stand 2004. Wasser- und Energiewirtschaftsamt des Kantons Bern (WEA), (78 pp.).
Green, C.T., Puckett, L.J., Bohlke, J.K., Bekins, B.A., Phillips, S.P., Kauffman, L.J., Denver, J.M., Johnson, H.M., 2008.Limited occurrence of denitrification in four shallow aquifers in agricultural areas of the United States. J. Environ. Qual. 37 (3), 994–1009.
Haycock, N.E., Burt, T.P., 1993.Role of floodplain sediments in reducing the nitrate concentration of subsurface run-off: a case study in the Cotswolds, UK. Hydrol. Process. 7 (3), 287–295.
He, Q., Walling, D.E., 1997.Spatial variability of the particle size composition of overbank floodplain deposits. Water Air Soil Pollut. 99 (1–4), 71–80.
Hosono, T., Tokunaga, T., Kagabu, M., Nakata, H., Orishikida, T., Lin, I.T., Shimada, J., 2013.The use of delta N-15 and delta O-18 tracers with an understanding of groundwater flow dynamics for evaluating the origins and attenuation mechanisms of nitrate pollution. Water Res. 47 (8), 2661–2675.
Jordan, P., 2000.Modélisation de la partie nord de l'aquifère du Seeland(Master thesis) University of Neuchatel, (176 pp.).
Kellerhals, D.P., Haefeli, C., 1988.Seeland: Inflitration aus Hagneckkanal und Alter Aare. Wasser- und Energiewirtschaftsamt des Kantons Bern (WEA), p. 93.
Kellogg, D.Q., Gold, A.J., Groffman, P.M., Addy, K., Stolt, M.H., Blazejewski, G., 2005.In situ ground water denitrification in stratified, permeable soils underlying riparian wetlands. J. Environ. Qual. 34 (2), 524–533.
Kozel, R., 1992. Erfassung organischer Spurenbelastungen, insbesondere
durch Pflanzenbehandlungsmittel, in oberflächennahen Lockergesteins-Grundwässern. University of Neuchâtel, Switzerland, p. 392 (Ph.D. thesis).
Kullin, M., Schmassmann, H., 1991.Isotopic composition of modern recharge. In: Pearson, F.J., Balderer, W., Loosli, H.H., Lehmann, B.E., Matter, A., Peters, T., Schmassmann, H., Gautschi, A. (Eds.), Applied Isotope Hydrogeology. A Case Study in Northern Switzerland. Elsevier, Amsterdam, pp. 65–69.
Maitre, V., Cosandey, A.C., Parriaux, A., Guenat, C., 2005.A methodology to estimate the denitrifying capacity of a riparian wetland. J. Environ. Qual. 34 (2), 707–716.
Mariotti, A., Landreau, A., Simon, B., 1988.N-15 isotope biogeochemistry and natural denitrification process in groundwater— application to the chalk aquifer of northern France. Geochim. Cosmochim. Acta 52 (7), 1869–1878.
McMahon, P.B., Bohlke, J.K., 1996.Denitrification and mixing in a stream-aquifer system: effects on nitrate loading to surface water. J. Hydrol. 186 (1–4), 105–128.
OFEV, 2013.Annuaire hydrologique de la Suisse 2009. Etat de l'Environnement N°1321. Office fédérale de l'environnement, Berne.
Peyer, K., Flückiger, R., Walther, H.R., Wüest, O., Zihlmann, U., 1982.Bodenkarte Lyss Blatt 1146.
Pinay, G., Ruffinoni, C., Wondzell, S., Gazelle, F., 1998.Change in groundwater nitrate concentration in a large river floodplain: denitrification, uptake, or mixing? J. N. Am. Benthol. Soc. 17 (2), 179–189.
Pinay, G., Black, V.J., Planty-Tabacchi, A.M., Gumiero, B., Decamps, H., 2000.
Geomorphic control of denitrification in large river floodplain soils. Biogeochemistry 50 (2), 163–182.
Schaetzl, R., Anderson, S., 2005. Soils — Genesis and Geomorphology.
Cambridge University Press, Cambridge (833 pp.).
Schilling, K.E., Jacobson, P., 2012.Spatial relations of topography, lithology and water quality in a large river floodplain. River Res. Appl. 28 (9), 1417–1427.
Schurch, M., Kozel, R., Schotterer, U., Tripet, J.P., 2003.Observation of isotopes in the water cycle— the Swiss National Network (NISOT). Environ. Geol. 45 (1), 1–11.
Tesoriero, A.J., Puckett, L.J., 2011.O2 reduction and denitrification rates in shallow aquifers. Water Resour. 47.
Wersin, P., Abrecht, J., Hohener, P., 2001. Large-scale redox plume in
glaciofluvial deposits due to sugar-factory wastes and wastewater at Aarberg, Switzerland. Hydrogeol. J. 9 (3), 282–296.
![Fig. 4. Spatial distribution of stable isotope ratioδ 18 O [‰] in groundwater (colored circles); manual interpolation of calculated river water content in groundwater (gray scale).](https://thumb-eu.123doks.com/thumbv2/123doknet/14935927.665812/6.816.182.646.68.650/spatial-distribution-isotope-ratioδ-groundwater-interpolation-calculated-groundwater.webp)
![Fig. 5. The δ 2 H vs. δ 18 O correlation diagram. The Central Swiss Meteoric Water Line CSMWL [Kullin and Schmassmann (1991)] is represented by the dashed line](https://thumb-eu.123doks.com/thumbv2/123doknet/14935927.665812/7.816.56.388.71.399/correlation-diagram-central-swiss-meteoric-kullin-schmassmann-represented.webp)