Materials and Methods Sample preparation
In/Si(111) nanowires were grown epitaxially on a Si(111) substrate miscut by 2° towards the [-1 -1 2] direction (MaTecK GmbH). The substrates are p-doped with resistivity 0.075-0.085 cm. Slightly more than 1 monolayer of pure In was evaporated from a home-built Knudsen cell at a rate of around 0.05 monolayers per minute onto a clean Si(111)-7x7 reconstructed surface at room temperature. The pressure during Si flashing never exceeded 1x10⁻⁹ mbar, while during
evaporation a typical pressure of 1x10⁻¹⁰ mbar was maintained. Excess material was then removed by direct current annealing at around 500°C. The optimal coverage of 1 monolayer was judged live from the (4x1) pattern using low energy electron diffraction (LEED) shown in Fig. S1. A high sample surface quality is indicated by the sharp LEED spots and low inelastic background. A diffraction image of the (8x2) phase could not be obtained with the present setup as there is no option for sample cooling in the preparation chamber.
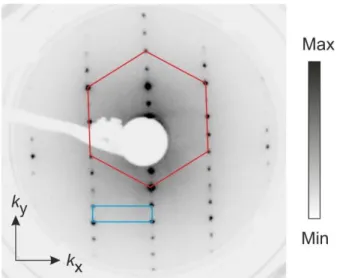
Fig. S1. LEED characterization of In/Si(111)-4x1
Low energy electron diffraction pattern of a freshly prepared In/Si(111)-4x1 phase obtained at 80 eV electron beam energy. The 4x1 (blue) and 1x1 (red) unit cells are overlaid. A single domain phase is obtained by using a substrate with a 2° miscut, thereby breaking the three-fold rotation of the (111) surface.
Sample characterization with static ARPES
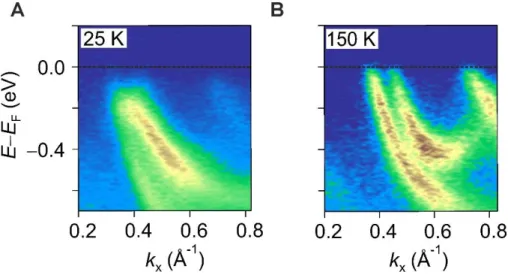
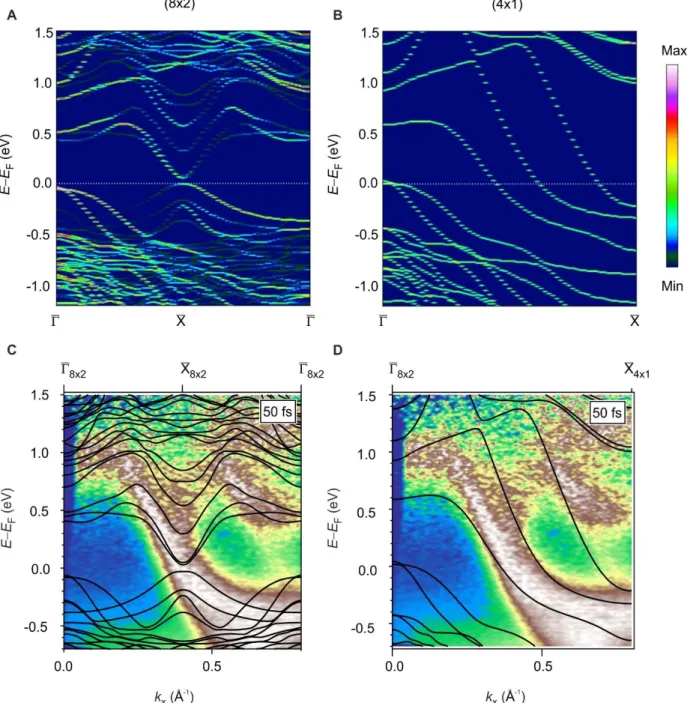
The static ARPES characterization of In/Si(111) in the two thermal phases is shown in Fig. S2, obtained using a He discharge lamp (21.2 eV). The (8x2) phase is reached by cooling the sample to 25 K with a liquid He cryostat. The energy resolution at low temperatures was around 20 meV, better than available with the HHG laser (see below). As can be seen in Fig. S2A the band structure is gapped and does not reach the Fermi level, in direct contrast to the (4x1) band structure that clearly shows the m1, m2, m3 bands crossing EF, shown in Fig. S2B. In the (8x2)
phase the m2/m3 bands open a distinct band gap at around 0.4 Å-1. In addition they coalesce into a
single feature below EF, in marked contrast to the well separated peaks observed in the (4x1) phase.
This clear difference between the two phases reflects the different atomic arrangements of the underlying lattice. We therefore use the splitting between the two peaks to characterize the dynamics of the atomic structure during the ultrafast experiments (see below). In the m1 band
region it is no longer possible to follow a clear band dispersion in the (8x2) phase as the spectral weight is strongly reduced in this region due to the m1 band being lifted above EF. We are therefore
able to spectroscopically distinguish between the two phases in our measurements. The weak residual intensity of the m1 band is likely a result of small areas of the (4x1) phase that persist even
at low temperatures which are pinned by defects or step edges, as commonly observed in the literature (17,27,31–33). Given the small spectral weight in this region it is clear that the area of the residual (4x1) phase is relatively small compared with the (8x2) phase. The dynamics we observe are therefore dominated by those of the (8x2) phase. We note that the apparent higher intensity of the m1 band in the (8x2) phase in Fig. 2A of the main article is due to the logarithmic
color scale chosen to highlight the weak population in the excited states.
Fig. S2. Characterization of In/Si(111) with ARPES
ARPES spectra on a linear scale obtained with a He discharge lamp at 21.2 eV at 25 K (A) in the (8x2) phase and at 150 K (B) in the (4x1) phase. At low temperatures, a gap opens in the m2/m3 band region and the m1 band disappears above EF in contrast to the
clear three band dispersion in the (4x1) phase. EF is marked by a dashed line in both
Time- and angle-resolved photoemission spectroscopy
We have developed a 500 kHz XUV light source at 22 eV produced by high-harmonic generation (HHG) in an Ar gas jet. The HHG is driven by the 1.55 eV output from a home-built OPCPA (34) with pulse energy of 30 µJ, which is then frequency doubled in a BBO crystal before entering the HHG chamber. A small focus spot (15 µm) and high backing pressure (2 - 4 bar) are used to obtain the necessary peak electric-fields and phase matching conditions for efficient HHG. A single harmonic is isolated by a combination of a multilayer XUV mirror, thin Sn filters, and a Si wafer at the Brewster angle to remove the driving frequency. A photon flux of 2x10¹¹ photons/s at the sample position is obtained at 22 eV. Time zero was determined using a bulk WSe2 sample
which shows a non-resonant two-photon response, allowing direct access to the temporal overlap of the two beams. The cross correlation (full width at half maximum) during typical measurements was between 35 fs and 40 fs. The overall energy resolution determined from the photoemission signal from a polycrystalline metallic sample was approximately 150 meV. An incident spot size of 120 x 95 µm2 full width at half maximum was obtained for the probe beam, much smaller than
the pump beam at 300 x 170 µm2. The pump beam was linearly s-polarized and was incident at an angle of 15° to the sample surface normal. ARPES and trARPES measurements are obtained with a 2D hemispherical analyzer (SPECS GmbH) in conjunction with a 6-axis cryogenic manipulator which can be cooled to ~10 K (SPECS GmbH). Measurements were carried out at a base pressure of 2x10-11 mbar.
Computational details
Density-functional theory (DFT) within the local-density approximation (LDA) in the Quantum Espresso implementation (35) is used to determine the atomic and electronic ground-state of In/Si(111). The surface is modelled using the supercell approach. The supercell contains three bilayers of silicon, the bottom layer of which is saturated with hydrogen. The electron-ion interaction is modelled with norm-conserving pseudopotentials. Plane waves up to an energy cutoff of 50 Ry are used to expand the electronic orbitals. The surface Brillouin zone is sampled using a 2x8 Monkhorst-Pack mesh. Quasiparticle band structures for the (8x2) and (4x1) surface phases (Figs. 1E, 1F, 2A, 2D, 4A-C) are obtained within the GW approximation (36), where the one-particle Green’s function G and the screened Coulomb interaction W are obtained from the DFT electronic structure.
Ab initio molecular dynamics (AIMD) simulations of optically excited systems are performed within constrained DFT (37). The occupation of the electronic states is chosen in such a way that a specific excitation scenario is modelled, e.g., according to the Fermi-Dirac distribution for electronic temperature values obtained from the measured electron dynamics. At each time step in the simulation, the electronic structure is populated according to the thermal distribution obtained in the experiment, which is then used to calculate the forces on the atoms. The calculated atom dynamics then follow these forces until the next time step, which has a different population distribution, and so on. In this way the population changes are directly used to calculate the potential energy surface and the evolution of the system. The calculated trajectories are plotted in Fig. 2F and demonstrate the effect of the electronic excitation on the atomic system, and the timescale on which it evolves.
A crystal orbital Hamilton population (COHP) analysis based on a projector augmented wave implementation (38) is used to quantify the surface bond strengths (Fig. 4D-F).
Supplementary Text
Analysis of the photo-induced phase transition
We have analyzed the photo-induced phase transition (PIPT) in terms of three spectroscopic signatures in distinct regions of k-space – the zone boundary (X8𝑥2), zone center (Γ8𝑥2), and m2/m3
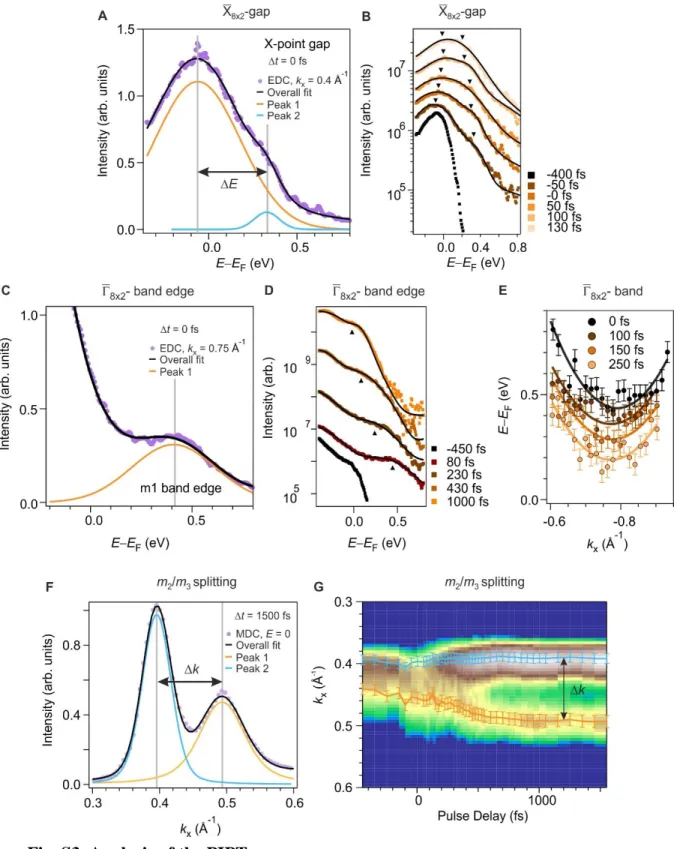
peak splitting – as detailed in the main text (Fig. 2). To exemplify our data analysis, data and fits from each of these regions are shown in Fig. S3.
For the analysis of the band positions and gap closing dynamics at the zone boundary and zone center, energy distribution curves (EDCs) are obtained at kx = 0.4 Å-1 and kx = 0.75 Å-1
respectively, as shown in Fig. S3A and C. The fit as well as the breakdown of the fit into individual components is shown for a single delay. At the zone boundary the EDCs are fitted with two Gaussian peaks plus a background in order to extract the position of both valence and conduction bands at each delay time during the pump-probe experiment; the difference, which corresponds to the band gap, is plotted in Fig. 2E. Data and fits at selected time delays are shown in Fig. S3B. The relevant dynamics at the zone center are those of the m1 band edge at 0.4 eV, which corresponds to the m1 band shifting towards the Fermi level, are fitted with a Gaussian. The overall
fits are shown together with the corresponding EDC at selected delay points in Fig. S3D. To highlight that the dynamics at the zone center are those of a shifting band, which cannot be explained by the redistribution of spectral weight alone, in Fig. S3E we have plotted the k-resolved position of the band at selected delay points. This reveals the gradual downwards shift of the whole m1 band, similar to the data shown in Fig. 4 of the main article.
The simulated band gap dynamics have been extracted from the calculated time-dependent band structure (LDA). Since LDA is well known to underestimate band gap sizes, GW calculations have been carried out for the static (8x2) phase and the LDA structures have then been rescaled to match the GW results.
For the structural transition we followed the splitting of the m2/m3 peaks, obtained from
momentum distribution curves (MDCs) at EF, which are then fitted with two Lorentzian peaks plus
a background (Fig. S3F). In Fig. S3G the position of the two peaks at each delay is overlaid on the corresponding MDC. The curve presented in Fig. 3E of the main text, revealing the structural phase transition dynamics, is obtained by subtracting the two peak positions shown in Fig. S3G. This particular feature of the spectral function was chosen as the occupied state bands are present at all times, even at long delays. The extracted dynamics match well with that found for the structural transition by the time-resolved electron diffraction study (22).
Fig. S3. Analysis of the PIPT.
EDCs of the trARPES data in the (8x2) phase at t = 0 fs at (A) the zone boundary and (C) at the zone center (F = 1.35 mJ cm-2). The overall fits at selected time delays are shown in (B) and (D) respectively. Markers guide the eye. (E) k-resolved dispersion of the excited states at the zone center at selected time points, showing the evolution of the band to lower energies. Solid lines are guides to the eye. (F) MDC at EF at t = 1500 fs
revealing the two peaks of the 4x1 phase. (G) Fit position for the two peaks in (F) overlaid on the respective MDC as a function of delay.
We exclude photovoltage shifts in the dynamics of the band structure, both for the In states close to EF and lower lying Si states, by measuring a pump-probe series of the full photoemission
spectra including the secondary edge. In addition the time scale for surface photovoltage effects are known to be much longer than those that we observe in our measurements (39,40).
The data shown here are obtained in a relatively high fluence regime of close to one electron per unit cell, which implies a homogeneous excitation. This is obtained assuming a pump absorption of 0.5% in the In layer, consistent with Frigge et al. (22). Considering the long absorption length and predominance of indirect transitions at this wavelength in Si, the excitation density in the bulk Si substrate will be much lower than in the In surface layer. We resolve well defined band gaps and band dispersions in our data which suggests that the role played by disorder during the PIPT is negligible. Our analysis shows that we are able to follow in detail the evolution of specific electronic bands in energy, not only at specific momentum points but also momentum resolved (e.g. Fig. S3E). The fact that we can follow gradual changes to entire bands following excitation implies a coherent motion in which all unit cells behave in the same way. This is further corroborated by the comparison to the molecular dynamics simulations, which calculate the deterministic forces acting on all atoms in the unit cell to obtain their dynamics. The excellent agreement between our data and the simulations is therefore strong evidence of directed atomic motion, in which the PIPT evolves homogeneously via the motion of specific atoms within the unit cell, in agreement with previous diffraction studies of this quasi-one dimensional material (22) as well as analogous bulk materials (41). Such directed dynamics cannot be explained by a statistically driven phase transition where different regions of the sample evolve incoherently. The structural dynamics we observe are consistent with the quarter period of the combined frequencies of the atomic motions: 27 cm-1 (1235 fs) and 17 cm-1 (1962 fs) (20). To further emphasize the
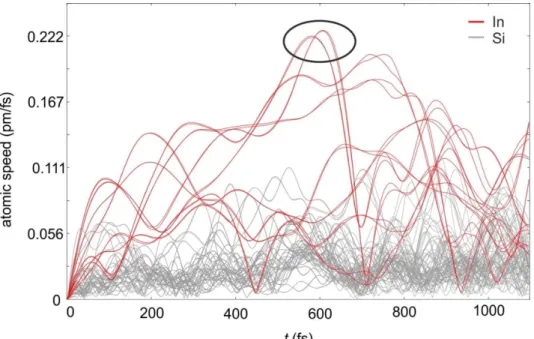
deterministic nature of the PIPT, and that our AIMD simulations provide information also on the atomic dynamics, Fig. S4 shows the atomic speeds for both In and Si atoms following photo-excitation.
Fig. S4. Atomic speeds during the photo-induced phase transition.
Indium atom speeds are given by red curves, while silicon atoms are gray. The In atoms forming the bond shown in Fig. 4 are fastest (circled), about 0.22 pm/fs for a short time.
Distribution of spectral weight in ARPES
A common observation in ARPES measurements during phase transitions to symmetry broken ground states is that the spectral weight in the low-symmetry state has an intensity distribution reminiscent of the high-symmetry state (42). The amount of spectral weight transfer can be entirely accounted for by the electronic band gap that opens: In a mean-field model, the amount of spectral weight transfer is given by the ratio of bare and renormalized dispersions, where the renormalized dispersion is determined by the gap size. Such an approach has previously been used to explain spectral weight distributions in ARPES (43) and trARPES (44) during phase transitions. This is the reason that although the calculated band structure of the (8x2) phase is symmetric around the X̅-point, the observed spectra is not. In order to show this in greater detail, we followed the procedure proposed in Ref. (45) and unfolded the band structure of the (8x2) surface into the Brillouin zone of the (4x1) unit cell as shown in Fig. S5A. In comparison with the band structure of the (4x1) structure Fig. S5B reveals that some (8x2) bands are indeed partially reminiscent of (4x1) bands, particularly in the region around the X̅-point (bands m2/m3). However,
the two phases may be clearly distinguished, as has been discussed in detail in the Materials and Methods section above.
The deviation between the two structures is also clearly seen in the bands above EF, as
shown in Fig. S5, C and D. The data (identical to Fig. 2B, but with each MDC normalized) are obtained after excitation by the pump pulse at a delay of t = 50 fs, well before the phase transition occurs, and each horizontal row (MDC) is normalised to highlight the dispersion of the bands above EF. The data are overlaid by the calculated band structure of the (8x2) phase in C and of the
(4x1) phase in D. A particularly noticeable deviation between the two phases is found in the region of the m1 band (k > 0.5 Å-1). As has been described above, in the (8x2) phase this band is far above
the Fermi level. The data agrees very well with the (8x2) band structure (Fig. S5C) and clearly deviates from the expectations of the (4x1) structure (Fig. S5D). This offers further proof that the sample is indeed in the (8x2) phase before excitation, and only transitions to the (4x1) phase due to photo-excitation. The presence of weak spectral weight following the m1 band of the (4x1) phase
is again visible, as discussed above.
An additional effect found in many photoemission experiments is that the distribution of spectral weight between Brillouin zones is not constant. This is a result of the photoemission matrix element, which places symmetry constraints on the electronic transitions into the final (measured) state. For this reason, the distribution in Fig. 3 is not purely periodic.
Fig. S5. Distribution of spectral weight
(A) Calculated LDA band structure of the (8x2) phase obtained by unfolding the electronic bands of the (8x2) phase into the primitive (4x1) cell according to the approach outlined in (45). The spectral weight is found to strongly favor the original band dispersion of the (4x1) phase (B), but clear differences in the band dispersion are maintained. (C) Normalized MDC images of the data presented in the main article (Fig. 2B) overlaid with the LDA calculated bands structure of the (8x2) phase. The position of the excited m1 band above EF is well
reproduced. (D) Same data as in (C), but overlaid with the calculated (4x1) structure, showing clear discrepancies in the m1 band region (k > 0.5 Å-1).
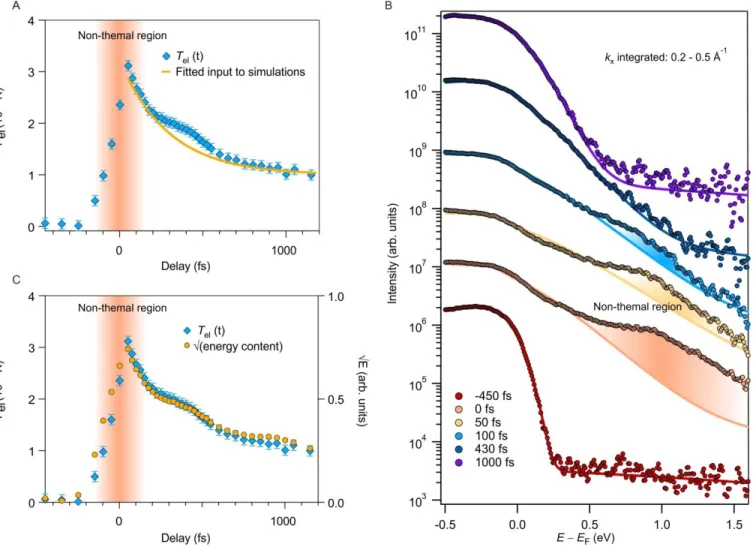
Analysis of the population dynamics: electronic temperature
We have extracted the transient electronic temperature during the PIPT (Fig. S6A) which has been used to constrain our ab initio molecular dynamics simulations (AIMD) (Fig. 2F). In order to assess whether a thermal description is indeed an appropriate description of the electronic population following excitation we compare the EDCs with their respective Fermi-Dirac function fits in Fig. S6B. EDCs are integrated over the region of the m2/m3 bands from 0.2 to 0.5 Å-1, from
which a transient temperature was extracted. The background signal is determined from the traces before excitation and is held constant during the subsequent delay fitting. A clear deviation from thermal behavior is observed during and shortly after excitation. However the deviation is small for t = 50 fs onwards. We therefore assume a thermal distribution to be an appropriate approximation. This time scale is typical for thermalization of the electronic system via electron-electron scattering (46). The electron-electronic temperature curve is fitted with an exponential decay with = 285 fs (Fig. S6A) which is then used directly as an input to the AIMD simulations to determine the constrained electronic population.
To corroborate this, we have evaluated the electronic energy density (ε) in the excited states by energy-weighting the population of states above EF as a function of delay. For a thermal system
the electronic temperature is proportional to the square root of the electronic energy density, since 𝜀(𝑡) = 𝐶𝑒𝑇𝑒(𝑡) = 𝛾𝑇𝑒2, where 𝐶𝑒 = 𝛾𝑇𝑒 is the electronic heat capacity. Both the square root of
the transient energy density and the electronic temperature are plotted in Fig. S6C. At early times during the pump pulse the fit tends to underestimate the temperature, evidenced by the fact that the electronic temperature consistently comes out lower than expected from the energy density. This agrees with the fits in Fig. S6B where the data shows a clear non-thermal component in addition to the thermal fit. The energy content analysis therefore reveals a thermalization time scale in agreement with that obtained from the EDC fit comparison (~50 fs).
The vibrational excitation of the lattice is difficult to address directly. While a simple two-temperature model of the system would indeed suggest a large value of the lattice two-temperature after 1 ps, this fails to account for the actual distribution of energy through the phonon system, which itself will not be thermalized (47). A large number of phonon modes exist in this system and are in fact efficiently excited (22). On which timescale the distribution of energy throughout all these modes thermalizes and leads to a non-equilibrium lattice temperature is non-trivial to address. However, an estimate of the lattice temperature at long delays and at excitation densities comparable with those that we present was obtained by an analysis of the diffuse scattered background (22). From this a maximum temperature increase of 30 K at a fluence of 3.1 mJ cm-2 was obtained, which would keep the lattice well below the transition temperature of 130 K.
Fig. S6. Thermal analysis of population dynamics.
(A) Electronic temperature vs. pump probe delay from the region kx = 0.2 – 0.5 Å-1. The
non-thermal region determined by the EDC analysis shown in (B) is shaded orange. An exponential fit is overlaid, which is used as an input to the molecular dynamics simulations. (B) EDCs at selected delays and their Fermi-Dirac fits, revealing non-thermal components at short delay times. (C) Square root of the energy content extracted from the data shown in (B) compared to the electronic temperature, corroborating the quasi-thermal description after excitation.
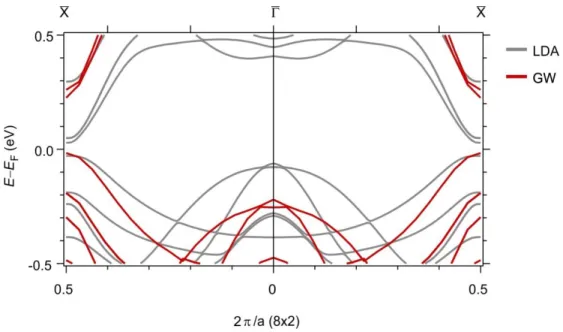
Comparison of LDA and GW band structures
The band structure of In/Si(111) in the (8x2) phase has been calculated within the local-density approximation (LDA) and GW approximation as described in the methods section above. A comparison of the two structures is presented in Fig. S7. Important differences are found at both the zone boundary and zone center. The LDA calculation at the zone boundary (X) produces a gap in the electronic structure with an unrealistically small value (~60 meV) compared with that of the experiment (~350 meV at t = 0 fs). In contrast the GW value (~250 meV) is much closer to the experimentally obtained value. At the zone center (Γ) LDA predicts the Si bands to be close to the Fermi level, only 30 meV below the In valence band states at X. However in the GW calculation the Si states are shifted down by 220 meV to higher binding energies, while the In states remain close to EF. The result is a band structure in which photo-excited holes preferentially sit at the zone
boundary (X-point) as is observed in Fig. 3 of the main text.
Since AIMD simulations at the level of GW are currently prohibitively expensive, we have used the LDA calculated band structure to determine the trajectory of the PIPT. As a result of the above discussion, we have applied a population correction to the LDA-AIMD, in order to more closely approximate the populations in a GW band structure, which better reflects the experimentally observed dispersions. At each time point in the calculation, the band structure is populated by the thermal population extracted and presented in the previous section, except at the Brillouin zone center and boundary where the following population correction is applied for each time point. At the zone center, the electron population close to the Fermi level is held constant by moving thermally excited holes to states at the zone boundary. This is in agreement with the GW calculations presented here and the data in Fig. 3.
Fig. S7. Comparison of LDA and GW band structures.
Comparison of the In/Si(111)-8x2 phase within LDA (grey) and the GW approximation (red). The GW calculation is found to more closely reflect the experimental band gap at the X-point. Additionally, the Si states at the Γ-point are shifted down by ~200 meV with respect to the In states in the LDA calculation, explaining the observed preferential localization of holes at the X-point.
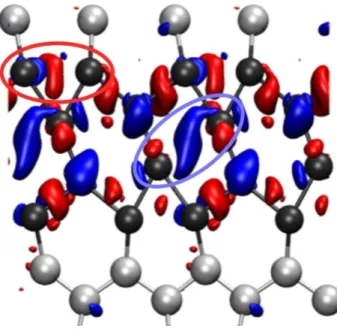
Charge redistribution and bonding during the photo-induced phase transition
The photo-excitation redistributes electron density from In-In dimer bonds parallel to the In chain direction to states above the Fermi level, in particular to states (m1 band) that correspond to
In-In bonds across the In zigzag chains. This pulls the hexagon structure apart and leads to an atomic rearrangement, which in turn lowers the energy of the m1 band towards the Fermi level.
The corresponding bond across the In zigzag chains becomes more populated and is further stabilized. The ab initio calculations thus provide a very clear and detailed picture of the nature and driving force of the phase transition. In order to more clearly relate the momentum space information to a real space picture, Fig. S8 visualizes the excitation-induced charge transfer in real space; regions of electron loss (red) and gain (blue) directly relate to bond breaking and formation respectively of the bonds described above.
Fig. S8. Charge redistribution and bonding during the PIPT.
Calculated charge density difference between the (8x2) phase excited by the electronic distribution described in the main text (thermal distribution plus localized holes) and its electronic ground state. Electron accumulation is colored blue, while depletion is shown as red. A loss of charge/bonding strength at the outer In-In dimer bonds is observed (circled in red). The gain in the diagonal bond across the In hexagon (circled in blue) corresponds to that shown in Fig. 4 of the main text, which has bonding character, and stabilizes the photo-excited (4x1) phase.
Movies in momentum and real space
In Fig. 2 and Fig. 4 of the main text we have presented snapshots of the electronic structure and of the corresponding bond dynamics during the PIPT. In the included movies (S1 and S2) we show more frames relating to this data. In both cases the time delay t is indicated.
Movie S1. Photo-induced phase transition in momentum space.
Photoemission intensity (linear scale) in energy and momentum as a function of pump-probe delay, showing the evolution from the (8x2) to (4x1) phases after photo-excitation at 0 fs.
Movie S2. Ultrafast formation of a chemical bond in real space.
Evolution of the atomic structure and electronic orbitals corresponding to the zone center bands (m1)
over time, revealing the ultrafast formation of a bond across the In hexagons. The color code represents the bond strength, as calculated from a COHP analysis. See main article for details.
15 References and Notes
1. M. Born, J. R. Oppenheimer, Zur Quantentheorie der Molekeln. Ann. Phys. 389, 457–484 (1927). doi:10.1002/andp.19273892002
2. H. Petek, M. J. Weida, H. Nagano, S. Ogawa, Real-time observation of adsorbate atom motion above a metal surface. Science 288, 1402–1404 (2000).
doi:10.1126/science.288.5470.1402Medline
3. H. Öström, H. Öberg, H. Xin, J. LaRue, M. Beye, M. Dell’Angela, J. Gladh, M. L. Ng, J. A. Sellberg, S. Kaya, G. Mercurio, D. Nordlund, M. Hantschmann, F. Hieke, D. Kühn, W. F. Schlotter, G. L. Dakovski, J. J. Turner, M. P. Minitti, A. Mitra, S. P. Moeller, A. Föhlisch, M. Wolf, W. Wurth, M. Persson, J. K. Nørskov, F. Abild-Pedersen, H. Ogasawara, L. G. M. Pettersson, A. Nilsson, Surface chemistry. Probing the transition state region in catalytic CO oxidation on Ru. Science 347, 978–982 (2015).
doi:10.1126/science.1261747Medline
4. T. Ishikawa, S. A. Hayes, S. Keskin, G. Corthey, M. Hada, K. Pichugin, A. Marx, J. Hirscht, K. Shionuma, K. Onda, Y. Okimoto, S. Y. Koshihara, T. Yamamoto, H. Cui, M. Nomura, Y. Oshima, M. Abdel-Jawad, R. Kato, R. J. D. Miller, Direct observation of collective modes coupled to molecular orbital-driven charge transfer. Science 350, 1501–1505 (2015). doi:10.1126/science.aab3480Medline
5. S. Gerber, S.-L. Yang, D. Zhu, H. Soifer, J. A. Sobota, S. Rebec, J. J. Lee, T. Jia, B. Moritz, C. Jia, A. Gauthier, Y. Li, D. Leuenberger, Y. Zhang, L. Chaix, W. Li, H. Jang, J.-S. Lee, M. Yi, G. L. Dakovski, S. Song, J. M. Glownia, S. Nelson, K. W. Kim, Y.-D. Chuang, Z. Hussain, R. G. Moore, T. P. Devereaux, W.-S. Lee, P. S. Kirchmann, Z.-X. Shen,
Femtosecond electron-phonon lock-in by photoemission and x-ray free-electron laser. Science 357, 71–75 (2017). doi:10.1126/science.aak9946Medline
6. D. Wegkamp, J. Stähler, Ultrafast dynamics during the photoinduced phase transition in VO2. Prog. Surf. Sci. 90, 464–502 (2015). doi:10.1016/j.progsurf.2015.10.001
7. F. Schmitt, P. S. Kirchmann, U. Bovensiepen, R. G. Moore, L. Rettig, M. Krenz, J.-H. Chu, N. Ru, L. Perfetti, D. H. Lu, M. Wolf, I. R. Fisher, Z.-X. Shen, Transient electronic structure and melting of a charge density wave in TbTe3. Science 321, 1649–1652 (2008).
doi:10.1126/science.1160778Medline
8. T. Rohwer, S. Hellmann, M. Wiesenmayer, C. Sohrt, A. Stange, B. Slomski, A. Carr, Y. Liu, L. M. Avila, M. Kalläne, S. Mathias, L. Kipp, K. Rossnagel, M. Bauer, Collapse of long-range charge order tracked by time-resolved photoemission at high momenta. Nature 471, 490–493 (2011). doi:10.1038/nature09829Medline
9. C. Monney, M. Puppin, C. W. Nicholson, M. Hoesch, R. T. Chapman, E. Springate, H. Berger, A. Magrez, C. Cacho, R. Ernstorfer, M. Wolf, Revealing the role of electrons and phonons in the ultrafast recovery of charge density wave correlations in 1T-TiSe2. Phys. Rev. B 94,
165165 (2016). doi:10.1103/PhysRevB.94.165165
10. X. Cui, C. Wang, A. Argondizzo, S. Garrett-Roe, B. Gumhalter, H. Petek, Transient Excitons at Metal Surfaces. Nat. Phys. 10, 505–509 (2014). doi:10.1038/nphys2981
11. J. R. Dwyer, C. T. Hebeisen, R. Ernstorfer, M. Harb, V. B. Deyirmenjian, R. E. Jordan, R. J. Miller, Femtosecond electron diffraction: ‘making the molecular movie’. Philos. Trans. A. Math. Phys. Eng. Sci. 364, 741–778 (2006). doi:10.1098/rsta.2005.1735Medline
12. J. C. Polanyi, A. H. Zewail, Direct Observation of the Transition State. Acc. Chem. Res. 28, 119–132 (1995). doi:10.1021/ar00051a005
13. Ashcroft, N. W. & Mermin, N. D. Solid State Physics. (Brooks/Cole, 1976).
14. R. Hoffmann, A chemical and theoretical way to look at bonding on surfaces. Rev. Mod. Phys. 60, 601–628 (1988). doi:10.1103/RevModPhys.60.601
15. T. L. Cocker, D. Peller, P. Yu, J. Repp, R. Huber, Tracking the ultrafast motion of a single molecule by femtosecond orbital imaging. Nature 539, 263–267 (2016).
doi:10.1038/nature19816Medline
16. P. Puschnig, S. Berkebile, A. J. Fleming, G. Koller, K. Emtsev, T. Seyller, J. D. Riley, C. Ambrosch-Draxl, F. P. Netzer, M. G. Ramsey, Reconstruction of molecular orbital densities from photoemission data. Science 326, 702–706 (2009).
doi:10.1126/science.1176105Medline
17. H. Yeom, S. Takeda, E. Rotenberg, I. Matsuda, K. Horikoshi, J. Schaefer, C. M. Lee, S. D. Kevan, T. Ohta, T. Nagao, S. Hasegawa, Instability and Charge Density Wave of Metallic Quantum Chains on a Silicon Surface. Phys. Rev. Lett. 82, 4898–4901 (1999).
doi:10.1103/PhysRevLett.82.4898
18. P. C. Snijders, H. H. Weitering, Colloquium: Electronic instabilities in self-assembled atom wires. Rev. Mod. Phys. 82, 307–329 (2010). doi:10.1103/RevModPhys.82.307
19. C. González, J. Ortega, F. Flores, Metal-insulator transition in one-dimensional In-chains on Si(111): Combination of a soft shear distortion and a double-band Peierls instability. New J. Phys. 7, 100 (2005). doi:10.1088/1367-2630/7/1/100
20. S. Wippermann, W. G. Schmidt, Entropy explains metal-insulator transition of the Si(111)-In nanowire array. Phys. Rev. Lett. 105, 126102 (2010).
doi:10.1103/PhysRevLett.105.126102Medline
21. E. Jeckelmann, S. Sanna, W. G. Schmidt, E. Speiser, N. Esser, Grand canonical Peierls transition in In/Si(111). Phys. Rev. B 93, 241407 (2016).
doi:10.1103/PhysRevB.93.241407
22. T. Frigge, B. Hafke, T. Witte, B. Krenzer, C. Streubühr, A. Samad Syed, V. Mikšić Trontl, I. Avigo, P. Zhou, M. Ligges, D. von der Linde, U. Bovensiepen, M. Horn-von Hoegen, S. Wippermann, A. Lücke, S. Sanna, U. Gerstmann, W. G. Schmidt, Optically excited structural transition in atomic wires on surfaces at the quantum limit. Nature 544, 207– 211 (2017). doi:10.1038/nature21432Medline
23. Further details are available in the supplementary materials.
24. C. M. Heyl, J. Güdde, A. L’Huiller, U. Höfer, High-order harmonic generation with μJ laser pulses at high repetition rates. J. Phys. At. Mol. Opt. Phys. 45, 074020 (2012).
doi:10.1088/0953-4075/45/7/074020
25. H. Wang, Y. Xu, S. Ulonska, J. S. Robinson, P. Ranitovic, R. A. Kaindl, Bright high-repetition-rate source of narrowband extreme-ultraviolet harmonics beyond 22 eV. Nat. Commun. 6, 7459 (2015). doi:10.1038/ncomms8459Medline
17 27. T. Tanikawa, I. Matsuda, T. Kanagawa, S. Hasegawa, Surface-state electrical conductivity at
a metal-insulator transition on silicon. Phys. Rev. Lett. 93, 016801 (2004).
doi:10.1103/PhysRevLett.93.016801
28. Y. Sun, S. Agario, S. Souma, K. Sugawara, Y. Tago, T. Sato, T. Takahashi, Cooperative structural and Peierls transition of indium chains on Si(111). Phys. Rev. B 77, 125115 (2008). doi:10.1103/PhysRevB.77.125115
29. R. Dronskowski, P. E. Blöchl, Crystal Orbital Hamilton Populations (COHP). Energy-Resolved Visualization of Chemical Bonding in Solids Based on Density-Functional Calculations. J. Phys. Chem. 97, 8617–8624 (1993). doi:10.1021/j100135a014
30. S. Maintz, V. L. Deringer, A. L. Tchougréeff, R. Dronskowski, Analytic projection from plane-wave and PAW wavefunctions and application to chemical-bonding analysis in solids. J. Comput. Chem. 34, 2557–2567 (2013). doi:10.1002/jcc.23424Medline
31. J. R. Ahn, J. H. Byun, H. Koh, E. Rotenberg, S. D. Kevan, H. W. Yeom, Mechanism of gap opening in a triple-band Peierls system: In atomic wires on Si. Phys. Rev. Lett. 93, 106401 (2004). doi:10.1103/PhysRevLett.93.106401Medline
32. G. Lee, J. Guo, E. W. Plummer, Real-space observation of nanoscale inhomogeneities and fluctuations in a phase transition of a surface quasi-one-dimensional system: In/Si(111). Phys. Rev. Lett. 95, 116103 (2005). doi:10.1103/PhysRevLett.95.116103Medline
33. H. Morikawa, C. C. Hwang, H. W. Yeom, Controlled electron doping into metallic atomic wires: Si(111)4×1-In. Phys. Rev. B 81, 075401 (2010). doi:10.1103/PhysRevB.81.075401
34. M. Puppin, Y. Deng, O. Prochnow, J. Ahrens, T. Binhammer, U. Morgner, M. Krenz, M. Wolf, R. Ernstorfer, 500 kHz OPCPA delivering tunable sub-20 fs pulses with 15 W average power based on an all-ytterbium laser. Opt. Express 23, 1491–1497 (2015).
doi:10.1364/OE.23.001491Medline
35. P. Giannozzi, S. Baroni, N. Bonini, M. Calandra, R. Car, C. Cavazzoni, D. Ceresoli, G. L. Chiarotti, M. Cococcioni, I. Dabo, A. Dal Corso, S. de Gironcoli, S. Fabris, G. Fratesi, R. Gebauer, U. Gerstmann, C. Gougoussis, A. Kokalj, M. Lazzeri, L. Martin-Samos, N. Marzari, F. Mauri, R. Mazzarello, S. Paolini, A. Pasquarello, L. Paulatto, C. Sbraccia, S. Scandolo, G. Sclauzero, A. P. Seitsonen, A. Smogunov, P. Umari, R. M. Wentzcovitch, QUANTUM ESPRESSO: A modular and open-source software project for quantum simulations of materials. J. Phys. Condens. Matter 21, 395502 (2009). doi:10.1088/0953-8984/21/39/395502Medline
36. R. M. Martin, L. Reining, D. M. Ceperley, Interacting Electrons: Theory and Computational Approaches. (Cambridge University Press, 2016).
37. P. H. Dederichs, S. Blügel, R. Zeller, H. Akai, Ground states of constrained systems: Application to cerium impurities. Phys. Rev. Lett. 53, 2512–2515 (1984).
doi:10.1103/PhysRevLett.53.2512
38. A. Lücke, U. Gerstmann, T. D. Kühne, W. G. Schmidt, Efficient PAW-based bond strength analysis for understanding the In/Si(111)(8 × 2) - (4 × 1) phase transition. J. Comput. Chem. 38, 2276–2282 (2017). doi:10.1002/jcc.24878Medline
39. W. Widdra, D. Bröcker, T. Gießel, I. V. Hertel, W. Krüger, A. Liero, F. Noack, V. Petrov, D. Pop, P. M. Schmidt, R. Weber, I. Will, B. Winter, Time-resolved core level
photoemission: Surface photovoltage dynamics of the SiO2/Si(100) interface. Surf. Sci.
543, 87–94 (2003). doi:10.1016/j.susc.2003.07.005
40. S.-L. Yang, J. Sobota, P. S. Kirchmann, Z.-X. Shen, Electron propagation from a photo-excited surface: Implications for time-resolved photoemission. Appl. Phys., A Mater. Sci. Process. 116, 85–90 (2013). doi:10.1007/s00339-013-8154-9
41. G. Sciaini, M. Harb, S. G. Kruglik, T. Payer, C. T. Hebeisen, F. J. zu Heringdorf, M.
Yamaguchi, M. Horn-von Hoegen, R. Ernstorfer, R. J. D. Miller, Electronic acceleration of atomic motions and disordering in bismuth. Nature 458, 56–59 (2009).
doi:10.1038/nature07788Medline
42. J. Voit, L. Perfetti, F. Zwick, H. Berger, G. Margaritondo, G. Grüner, H. Höchst, M. Grioni, Electronic structure of solids with competing periodic potentials. Science 290, 501–503 (2000). doi:10.1126/science.290.5491.501Medline
43. C. Monney, E. F. Schwier, M. G. Garnier, N. Mariotti, C. Didiot, H. Beck, P. Aebi, H. Cercellier, J. Marcus, C. Battaglia, H. Berger, A. N. Titov, Temperature-dependent photoemission on 1T-TiSe2: Interpretation within the exciton condensate phase model.
Phys. Rev. B 81, 155104 (2010). doi:10.1103/PhysRevB.81.155104
44. C. W. Nicholson, C. Monney, R. Carley, B. Frietsch, J. Bowlan, M. Weinelt, M. Wolf, Ultrafast spin density wave transition in Chromium governed by thermalized electron gas. Phys. Rev. Lett. 117, 136801 (2016). Medline
45. P. V. C. Medeiros, S. Stafström, J. Björk, Effects of extrinsic and intrinsic perturbations on the electronic structure of graphene: Retaining an effective primitive cell band structure by band unfolding. Phys. Rev. B 89, 041407 (2014). doi:10.1103/PhysRevB.89.041407
46. H. Petek, S. Ogawa, Femtosecond time-resolved two-photon photoemission studies of electron dynamics in metals. Prog. Surf. Sci. 56, 239–310 (1997). doi:10.1016/S0079-6816(98)00002-1
47. L. Waldecker, T. Vasileiadis, R. Bertoni, R. Ernstorfer, T. Zier, F. H. Valencia, M. E. Garcia, E. S. Zijlstra, Coherent and incoherent structural dynamics in laser-excited antimony. Phys. Rev. B 95, 054302 (2017). doi:10.1103/PhysRevB.95.054302