HAL Id: hal-01784470
https://hal.archives-ouvertes.fr/hal-01784470
Submitted on 3 May 2018
HAL is a multi-disciplinary open access
archive for the deposit and dissemination of
sci-entific research documents, whether they are
pub-lished or not. The documents may come from
teaching and research institutions in France or
abroad, or from public or private research centers.
L’archive ouverte pluridisciplinaire HAL, est
destinée au dépôt et à la diffusion de documents
scientifiques de niveau recherche, publiés ou non,
émanant des établissements d’enseignement et de
recherche français ou étrangers, des laboratoires
publics ou privés.
Interactome-Transcriptome integration for predicting
distant metastasis in breast cancer
Maxime Garcia, Raphaelle Millat-Carus, François Bertucci, Pascal Finetti,
Daniel Birnbaum, Ghislain Bidaut
To cite this version:
Maxime Garcia, Raphaelle Millat-Carus, François Bertucci, Pascal Finetti, Daniel Birnbaum, et al..
Interactome-Transcriptome integration for predicting distant metastasis in breast cancer.
Bioinfor-matics, Oxford University Press (OUP), 2012. �hal-01784470�
InteractoTranscriptome integration for predicting distant
me-tastasis in breast cancer
Maxime Garcia
1,2,3, Raphaelle Millat-Carus
1,2,3, François Bertucci
1,2,3, Pascal Finetti
1,2,3, Daniel
Birnbaum
1,2,3and Ghislain Bidaut
1,2,3,*
1
Aix-Marseille Univ, Centre de Recherche en Cancérologie de Marseille, F-13284, Marseille, France ; 2
Inserm, Centre de Recherche en Cancérologie de Marseille, F-13009, Marseille, France ; 3
Institut Paoli-Calmettes, F-13009, Marseille, France ;
ABSTRACT
Motivation: High-throughput gene-expression profiling yields
ge-nomic signatures that allow the prediction of clinical conditions in-cluding patient outcome. However, these signatures have limita-tions, such as dependency on the training set, and worse, lack of generalization.
Results: We propose a novel algorithm called ITI
(Interactome-Transcriptome Integration), to extract a genomic signature predicting distant metastasis in breast cancer by superimposition of large-scale protein-protein interaction data over a compendium of several gene-expression data sets. Training on two different compendia showed that the estrogen receptor-specific signatures obtained are more stable (11-35% stability), can be generalized on independent data, and performs better than previously published methods (53-74% accuracy).
Availability and Supplementary Information: The ITI algorithm
source code and supplementary material from analysis are available
under CeCILL from the ITI companion web site:
http://bioinformatique.marseille.inserm.fr/iti.
Contact: [email protected], [email protected]
1 INTRODUCTION
The advent of post-genomic technologies provided the opportunity to potentially decipher the genomic origin of human diseases, in-cluding cancer. Thus, gene expression analysis using DNA micro-arrays allowed improving the classification and prognostication of several types of cancer, including breast cancer (Sørlie et al., 2001), van de Vijver et al., 2002). This approach can also help predict the metastatic recurrence and outcome (Wang et al., 2005). In breast cancer (BC), the current prognostic features poorly reflect the heterogeneous clinical outcome. The consequence is that many patients (70-80%) receive unnecessary adjuvant systemic chemo-therapy. Genomic tools could provide an opportunity to refine prognosis and improve treatment strategy and lay down foundation of personalized medicine in BC.
Several studies have produced signatures linked to BC distant me-tastasis (Sotiriou et al., 2006). The Mammaprint 70-gene signature (van de Vijver et al., 2002) classified BC patients in either good or
poor-prognosis groups. Wang et al (Wang et al., 2005) reported a 76-gene signature specific to Estrogen Receptor (ER) status (60 genes for ER+ patients, and 16 for ER-). These two signatures have an overlap of only 3 genes, which raised concerns about their reliability. Michiels and colleagues (Michiels et al., 2005) reana-lyzed the van de Vijver dataset and concluded that the signatures obtained in such studies are unstable and dependent on the patients training set. From a classification standpoint, any gene classifier can be a good one as long as it performs and generalizes well (Dobbin et al., 2008). However, from either a scientific or clinical standpoint, both the content and stability of signatures are of pri-mary importance, so as to decipher their molecular basis, to rein-force their robustness and widespread acceptance of their routine clinical use, and eventually to lead to new therapeutic targets. Reasons for inherent instability of gene-based signatures have been previously enumerated (Fan et al., 2006, Bertucci et al., 2006). Besides experimental variability, variation in patient sampling and microarray platform bias, other reasons explain the lack of stability of signatures (Ein-Dor et al., 2006). Reasons best explaining this instability are (i) the curse of dimensionality, and (ii) the biological nature of gene expression measurements. The curse of dimension-ality is well known of statisticians and is due to the inherent micro-array data topology (too few samples for too many variables). The biological nature of instability is the following. Microarrays meas-ure messenger RNA transcript abundance. To the extent that per-turbations linked to a particular phenotype are reflected by changes in messenger RNA transcript levels, microarrays may be useful for measuring perturbations linked to a particular phenotype. Genes, however, are not independent but their products act in concert through protein-protein interaction network(s). Our hypothesis is that phenotypes such as cancer result from isolated and subtle mo-lecular perturbations (changes in gene expression and/or mutations for example) in driver genes that may provoke expression changes of greater amplitude in downstream genes (Chuang et al., 2007). Statistics for differential expression detect changes of greater am-plitude and reveal only these downstream genes. Superimposing an interaction network to expression changes can detect driver genes associated with more subtle expression changes (Chuang et al., 2007). Factors cited previously may be more problematic for
Associate Editor: Dr. Trey Ideker
Bioinformatics Advance Access published January 11, 2012
at INSERM on January 12, 2012
http://bioinformatics.oxfordjournals.org/
2
markers for subtle changes in differential expression but we expect their effect to be attenuated by combination of several datasets. Such genes, used as biomarkers, have proved to be more robust in predicting distant metastasis of breast tumors profiled on heteroge-neous platforms than genes detected without network information. Several network-based approaches have been published for micro-array analysis. They include generating condition-dependent net-works on differential expression, where no prior information on interaction data is used, which somewhat limits the biological rele-vance of the results (Gill et al., 2010). Co-clustering expression and graph data were proposed earlier by constructing a novel dis-tance based on expression and network interactions (Hanisch et al., 2002). Support vector machines (SVM) in combination with spec-tral decomposition data denoising was proposed for analyzing transcriptional response in yeast (Rapaport et al., 2007). A net-work-based method was proposed to detect differentially-expressed subnetworks in existing Protein-Protein Interaction (PPI) data by local subnetwork aggregation (Chuang et al., 2007). Using a stricter statistical framework, an SVM variation for directly using interaction data within a classifier was applied to microarray clas-sification (Zhu et al., 2009).
These methods addressed the biological issues mentioned before. However, the data dimensionality issue was still not taken into account because training and testing were done on a single dataset with a relatively low number of samples.
We propose here a multi-dataset re-implementation of the method proposed by Chuang et al. (2007) to integrate analysis of several gene expression datasets so as to extract subnetworks discriminat-ing BC distant metastasis. We demonstrate the performance of our method, called Interactome-Transcriptome Integration (ITI) on a large compendium of publicly available data. To avoid potential bias in subnetwork selection, we performed a stratified ten-fold cross-validation and combined the obtained networks. Validation was then done on two independent BC gene expression datasets (Desmedt et al., 2008, van de Vijver et al., 2002). Using this ap-proach, we significantly increased the classification performance as compared to three previously published signatures while lower-ing the dependence of the signature on the trainlower-ing set. Independ-ent classification on two studies by van de Vijver and coworkers (2002) and Wang and coworkers (2006) achieved 53 and 74% accuracy, respectively. We detail here our ITI algorithm and report statistical validation, patient classification results, as well as bio-logical validation of the subnetworks thus defined.
2 METHODS
To detect protein complexes with subtle expression changes, we superim-posed a large scale PPI map to a compendium of BC expression profiles. The strategy implemented in ITI consists in detecting interactome subsets (subnetworks) whose expression is significantly correlated with Distant Metastasis-Free Survival (DMFS) in several datasets simultaneously. These subnetworks are then validated subsequently by shuffling interaction data and gene expression data. To train and test the system, six public datasets were chosen according to the criteria section 2.2. Four analyses were per-formed (two different validation datasets held out for independent testing for study 1 (Desmedt’s dataset) and study 2 (van de Vijver’s dataset) and separate analysis according to positive or negative ER tumor status) to assess the impact of training data on the detected subnetworks and to un-derstand their generalization capability. For each study, a ten-fold cross-validation was performed by carefully stratifying the training (90% of
samples) and test sets. The aim of stratification was to properly balance each of the ten training sets to keep the same ER+/ER- and DMFS events proportions in each of the 10 iterations.
2.1 Protein-Protein Interaction data integration
The following interaction data sets were used: Human Protein Resource Database release 9 (HPRD Keshava Prasad et al., 2009), Molecular INTer-action database (MINT, Ceol et al., 2010), INTAct (Aranda et al., 2010), Database of Interacting Proteins (DIP, Salwinski et al., 2004), and the human interactome generated in silico with the Cocite algorithm (Ramani et al., 2005). All data were downloaded the 8/9/2010, and parsed to remove self-interactions, duplicates and proteins marked as “unknown”. Self inter-actions were removed from the files as they are not quantified by the algo-rithm, and interaction maps were integrated by uniqueness of NCBI gene ID accession numbers. Annotations were homogenized within datasets for proper display within the system. Resulting interactions obtained by cross-ing all interaction data totaled a number of 70530 scross-ingle interactions among a total of 13202 proteins.
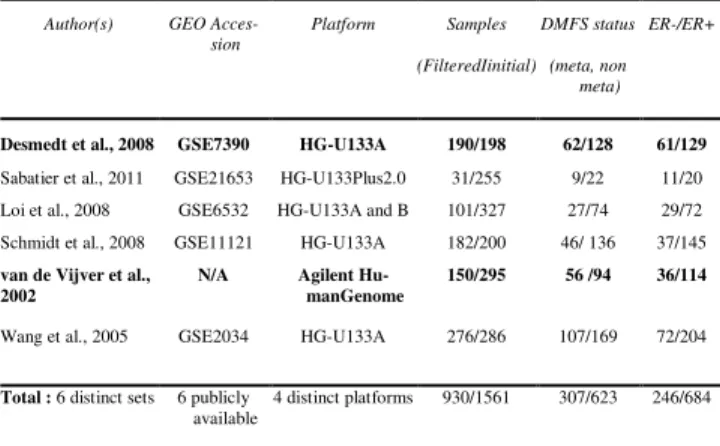
2.2 Breast cancer compendium (BCC)
The public datasets (see Table 1) were selected and included in a Breast Cancer Compendium (BCC) on the basis of the following criteria: early breast cancer, availability of clinical information related to metastasis (event information and delay between the BC diagnosis, and the relapse or the last follow-up) and immunohistochemical ER status (ER+, ER-) and absence of post-operative adjuvant chemotherapy. A total of 930 tumors were retained for analysis from the initial pool of 1561 tumors through 6 datasets. Sampling size, platform types and ER status are detailed in Table 1. DMFS status was censored if follow-up was less than 5 years for all datasets.
Table 1. Datasets included in the breast cancer compendium. Two
ings (study 1 and 2) were performed using different combinations of train-ing and testtrain-ing data (on bold): On the study 1, Desmedt tumors were held out for independent testing, and training was done on the rest. Van de Vijver dataset was respectively held out for the study 2.
Raw data sets were downloaded from National Center for Biotechnological Information (NCBI) Gene Expression Omnibus repository (Barrett et al., 2009) when available, and normalized using the GCRMA method from Bioconductor1. The van de Vijver dataset was downloaded as
supplemen-tary material from the publication (van de Vijver et al., 2002). Datasets were collapsed from probe expression to gene expression as described in
1 http://www.bioconductor.org/packages/release/bioc/html/gcrma.html Author(s) GEO
Acces-sion Platform Samples (FilteredIinitial) DMFS status (meta, non meta) ER-/ER+
Desmedt et al., 2008 GSE7390 HG-U133A 190/198 62/128 61/129
Sabatier et al., 2011 GSE21653 HG-U133Plus2.0 31/255 9/22 11/20
Loi et al., 2008 GSE6532 HG-U133A and B 101/327 27/74 29/72
Schmidt et al., 2008 GSE11121 HG-U133A 182/200 46/ 136 37/145
van de Vijver et al., 2002
N/A Agilent
Hu-manGenome
150/295 56 /94 36/114
Wang et al., 2005 GSE2034 HG-U133A 276/286 107/169 72/204
Total : 6 distinct sets 6 publicly available
4 distinct platforms 930/1561 307/623 246/684
at INSERM on January 12, 2012
http://bioinformatics.oxfordjournals.org/
=
∑
∈ ( , ), ( ) 1 ) ( max , e g d cc d n corr DS n n S s g d d d s∑
∈ = DS d sd s S NS S , 1Reyal et al. (2005). When multiple probesets were available for a gene, we used the probeset having the highest median signal. Following this, ‘nx_at’ marked probes were removed. HG-U133A and HG-U133B were integrated as a virtual combined platform.
2.3 Dataset stratification, Imbricated ten-fold cross-validation and independent testing
To detect discriminative subnetwork while avoiding over-fitting, cross-validation was performed by building training/testing sets while taking into account the clinical and molecular status of the tumors. Hence, stratifica-tion was done to balance ER+/ER- and distant metastasis rate between training and testing sets, leading to ten randomly selected training sets. Preservation of both molecular and clinical status proportions in each da-taset allowed increasing training and testing sets homogeneity and avoided molecular bias.
For each test/train set, subnetworks were detected with the ITI algorithm (see section 2.4) and validated by gene expression and PPI shuffling (sec-tion 2.5), yielding five subnetwork lists. The lists were combined into a single signature (section 2.6) whose discriminative power was tested on datasets held apart, as described section 2.7.
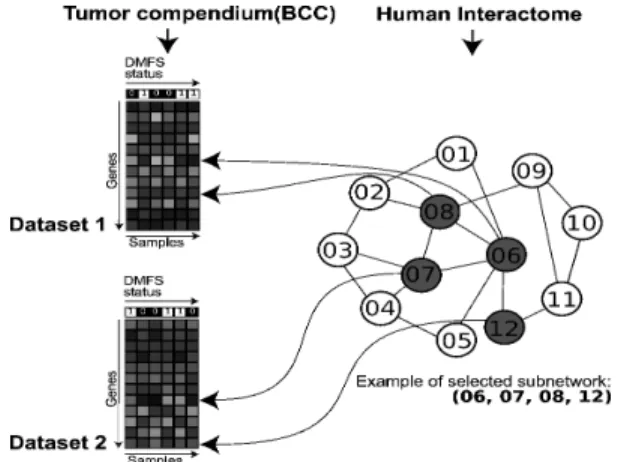
2.4 Interactome Transcriptome Integration - Con-structing subnetworks
Each couple of training/testing set was searched for discriminative subnet-works whose average expression was linked to distant metastasis using the ITI algorithm. The latter is derived from the algorithm of (Chuang et al., 2007), with the added capability of detecting subnetworks on a compendi-um (Figure 1). ITI was implemented as a pipeline developed with open source interpreters Perl and Bash and statistical validation was implement-ed with Matlab Statistical Toolbox R2010b (The Mathworks (c) Natick, MA, USA). Subnetwork detection was parallelized and implemented on a Beowulf Cluster to reduce computing costs. Subnetworks visualization was obtained with the graph layout package GraphViz (AT&T Research, USA). To detect discriminative subnetworks, correlations between clinical status and gene expression were computed for each dataset. Then, the interactome was exhaustively explored for discriminative regions (see Figure 1) by individually considering each node as a potential seed and aggregate recur-sively neighbors on the basis of a score measuring correlation of expression with DMFS status (see equation 1). Neighbors were aggregated until sub-network score could not be improved above a certain threshold (improve-ment score threshold = 0.03). Then, the following node in interactome was processed. Parallelization was done by subdividing interactome over avail-able scores. Subnetworks overlapping by more that 50% with already de-tected subnetworks were rejected. Overlap between subnetworks A and B was calculated by maximum inclusion score of subnetwork A in B and B in A. Inclusion score of A to B was measured by counting common genes included in subnetwork A to B and dividing by the total number of genes contained in subnetwork A. As an example, with a minimal threshold score th = 0.3, analysis led to a total of 2986 subnetworks for study 1(ER+) -01 (run where the Desmedt dataset was held for independent testing, and sub-networks were detected on training stratification 01 – see Figure 2). Each subnetwork was characterized by a score Ss,d (equation 1) on each
dataset measuring absolute correlation between the averaged subnetwork gene expression and the clinical information for this dataset. A global score Ss, defined by equation 2, was computed by averaging individual scores
over all datasets (not used for further computation).
[1]
[2]
Ss is the global score of subnetwork s, computed on the dataset d from the
compendium (groups of datasets DS of size NS), corr is the Pearson corre-lation measured between the averaged gene expression e(g,d) for genes belonging to s with the binary vector cc containing labels linked to clinical conditions of patients in datasets d, weighted appropriately by the square root of the number ndof samples in dataset d divided by the maximum
number of samples in all datasets in DS.
Fig. 1. Interactome-Transcriptome integration (ITI) algorithm. Two data
types were fed to the algorithm, the 5 training breast cancer datasets and an interactome. Expression was simultaneously inspected on several datasets to aggregate discriminative subnetworks, i.e. discriminative regions in the interactome, as described section 2.4.
2.5 Validating subnetworks - filtering
To validate subnetworks statistically, two random distributions of score were drawn. The first random distribution assessed the significance of algorithm that extracts subnetworks. It was obtained by randomly selecting subnetworks, i.e. by randomly accepting whether a subset of the interac-tome is a subnetwork without taking gene expression data into account. The second distribution assessed statistical significance of the biological link expression-protein-protein interaction. It was obtained by shuffling clinical conditions. To keep random subnetworks comparable to detected subnetworks, their distribution of size was forced to match that of the se-lected subnetworks by Gaussian modeling. Next, the distributions of ran-dom subnetwork scores were modeled by mixture of two Gaussian distribu-tions. Once obtained, these distributions were used to fix scores thresholds independently over all datasets at significance levels of p-values, and fil-tered statistically significant subnetworks. Shuffling random interactions to obtain a random interactome did not yield subnetworks at reasonable score levels, confirming the strong link between gene expression levels and pro-tein-protein physical interaction(s). Finally, we kept only the subnetworks with a score higher than expected by chance both on subnetwork randomi-zation (p<1.10-4 on 2 datasets) and shuffling of expression (p<1.10-4 on 2
datasets).
2.6 Constructing a common subnetwork signature for each training set
Using this filter, 10 subnetworks sets for each training tumor subset were generated. Next, these sets were combined by examining subnetworks pair by pair across datasets and combining them if overlap was larger than 50%. Using this method, clusters of overlapping subnetworks were built. Finally, a subnetwork list was constructed from the list of subnetwork clusters by
at INSERM on January 12, 2012
http://bioinformatics.oxfordjournals.org/
4
keeping only subnetworks appearing at least twice. For a given cluster, only the subnetwork with the highest score was kept. Final subnetwork sets size are detailed Table 2.
2.7 Tumor classification and distant metastasis pre-diction of ER+ and ER- tumors on two independ-ent datasets
The subnetwork list obtained section 2.6 was used for independent classifi-cation using two different settings, namely study 1 (in which Desmedt’s data was held out) and 2 (in which van de Vijver’s dataset was held out). In each setting, training was performed separately on tumors from all datasets except the held out dataset, yielding 5 SVM models. Classification on the validation sets was done by majority vote (weighted by sample size for each dataset) on the 5 SVM models. A complete organization chart is pre-sented in Figure 2.
To use subnetworks as unique SVM input variables, gene expression within a subnetwork was averaged over genes and used as a discriminative profile for both training and testing. Several SVM models were tested for increas-ing number of subnetworks. A final subnetwork list was retained by max-imizing accuracy.
Classification results (accuracy, true and false positives) are reported in section 3, along with a comparison with previously published classifiers.
Fig. 2: Complete data workflow. Interactome is assembled from multiple
sources (see section 2.1). Gene expression datasets forming our Breast Cancer Compendium (BCC) assembled section 2.2 are pooled to form a training dataset. Ten groups were then formed on a 10% leave-out basis (section 2.3). Subnetworks were detected on human interactome on each training set using ITI (section 2.4) and validated twice by shuffling interac-tions and expression, as described section 2.5. Retained subnetworks were combined (section 2.6) to train a Support Vector Machine (section 2.7). Final set was then used as a set of markers for classifying independent data by majority vote on the 5 SVM models (section 2.7).
2.8 ITI on-line resource - Gene Ontology category enrichment
To detect pathways associated with BC distant metastasis, we computed enrichment of biological process gene ontology in each subnetwork detect-ed by ITI using the ErmineJ program (Gillis et al., 2010) and the reference list of Biological Process from Gene Ontology (The Gene Ontology in 2010: extensions and refinements, 2010). ErmineJ provided corrected p-values for enrichment of ontological terms computed with hypergeometric distribution. These were systematically computed for all subnetworks to associate them to known molecular processes defined in the Gene Ontolo-gy.
The resulting data were organized in a dedicated on-line resource (http://bioinformatique.marseille.inserm.fr/iti). This resource describes
subnetworks detected with ITI and gives a thorough description of the included genes. Subnetworks and gene lists are downloadable for further processing. Subnetworks p-values calculated according to random distribu-tions described in section 2.5 were also included, along with combined Fisher scores (Hong et Breitling, 2008). Genes were annotated with direct NCBI EntrezGene links and links to other subnetworks are provided. To understand expression changes of genes included in subnetworks, color-coded gene graphs are provided, with correlation expression/DMFS status superimposed on subnetworks. The correlation score is provided for all datasets separately.
3 RESULTS
3.1 Establishment of two discriminative subnetworks sets (ER+ and ER-) from a joined compendium of 930 tumors
Two separate signatures were generated for ER+ and ER- BC sub-types for two studies. In study 1, Desmedt’s data (Desmedt et al., 2008) was held out, and in study 2, van de Vijver’s data (van de Vijver et al., 2002) was held out, as described in section 2.3. Thus, four sets of subnetworks were assessed (see Table 2).
Table 2. p-values thresholds and signature size for the four training
config-urations (study 1 = all BCC but Desmedt, study 2 = all BCC but van de Vijver). The optimal number of subnetworks for classification depends on the training set and is lower for ER+ tumors, which reflects a higher homo-geneity.
The optimal signature size retained in Table 2 is the one that max-imizes the average accuracy on the 10 training sets for each analy-sis. For the study 1, discriminative subnetworks had an average
score of 0.49 (ER+) and 0.54 (ER-) confirming the high correlation of co-expression and proximity in the PPI network. Signature size was respectively of 6 (ER+) and 165 subnetworks (ER-). For the study 2, the ER+ signature yielded an optimal classification score on independent data for 14 subnetworks, and the ER- signature for 122 subnetworks. They correspond to lists of 175 (Study 1, ER+), 2310 (Study 1, ER-), 272 (Study 2, ER+), and 1481 (Study 2, ER-) genes, respectively, many genes being represented in several sub-networks. These numbers are larger than what is reported for other signatures. This suggests that we detected a large panel of genes significantly linked to distant metastasis, realistically reflecting both the biological footprint of metastasis and the scale of pertur-bations at the gene expression level. Redundancy of genes within subnetworks may be explained by the high connectivity of several hubs (for instance TP53), which makes them likely to be included in several subnetworks.
Dataset p-value threshold – n datasets
# subnet-works
# genes
Study 1 (ER-) 1e-4 – 2 165 2310
Study 1 (ER+) 1e-4 – 2 6 175
Study 2 (ER-) 1e-4 – 2 122 1481
Study 2 (ER+) 1e-4 – 2 14 272
at INSERM on January 12, 2012
http://bioinformatics.oxfordjournals.org/
Table 3. Benchmark classification results comparison for ITI and other signatures on the two test datasets of Desmedt (Dt) and van de Vijver (vdV), for ER+
and ER- tumors. The four subnetworks sets defined in Section 2.3 were used to measure ITI classification performance. The following code was used: N= number of tumors to classify, TN = True Negative, TP = True Positive, FP = False Positive, TP = True Positive, ACC = Accuracy, SV = Sensitivity, SP = Specificity, FPR = False Positive Rate. Subnetworks classification accuracy was superior to gene expression classification for metastasis prediction for Desmedt’s dataset and around the same level for van de Vijver’s dataset.
3.2 Classification results on independent data shows superiority of subnetwork-based classification over independent gene signatures of the compen-dium
To assess the performance of signatures constructed with ITI, we compared them with previously established signatures. The 128 probes Genomic Grade Index (GGI) (Sotiriou et al., 2006), the Mammaprint 70-gene signature (van de Vijver et al., 2002), and the 76-gene ER status-specific signature (Wang et al., 2005) were tested. Performance was measured on the same tumors (Desmedt and van de Vijver datasets), separately on ER+ and ER- tumors. The classification methods from the respective original publica-tions were used for each signature. For van de Vijver’s signature, distances to mean centroïds from relapse and non-relapse groups are calculated (van de Vijver et al., 2002). For Wang’s signature, a relapse score is calculated for each patient by a linear combination of gene expression weighed by standardized Cox’s coefficients (Wang et al., 2005). Because the GGI and Mammaprint signatures are probe-specific, the tests were done with the probes present in the test dataset. Results and performance measurements are de-tailed in Table 3. They show that ITI generalization performance is vastly superior to previously published signatures. The GGI classi-fication showed the highest accuracy on the [47%-68%] range, the 70-gene signature on the [41%-62%] range, and the 76-gene signa-tures on the [37%-63%] range.
ITI gave a better accuracy as compared to the Wang signature on Desmedt’s data (ER+); an accuracy of 74% (specificity of 92%) was obtained versus an accuracy of 60% (specificity of 56%) with the 76-gene signature. ITI gave superior results also on Desmedt’s ER- tumors with an accuracy of 54% (specificity of 65%) versus an accuracy of 38% (specificity of 41%) for the Wang signature. This held true for the Mammaprint 70-gene signature, which works mostly for van de Vijver patients. ITI showed an accuracy of 53%
associated with a specificity of 90% on van de Vijver’s data (ER-) and an accuracy of 52% with a specificity of 65% on van de Vijver’s ER+ tumors. This performance is inferior to what was obtained on study 1 and may reflect a bias towards Affymetrix induced by the training compendium. The Mammaprint signature had a lower performance of 41% on ER+ and of 42% on ER- Desmedt tumors. Similarly, ITI showed performance superiority over the GGI for ER- patients. Overall, ITI was able to generalize better with a lower accuracy bound of 52%.
On a different comparison basis, Chuang and coworkers (2007) achieved 48.8% accuracy on van de Vijver samples with training on Wang samples and 55.8% reciprocally.
Specific contributions of the interaction data or gene expression data are not quantified, since they are not easily separable in the current setting. However, Chuang and coworkers (2007) already demonstrated that an expression approach increased signature ro-bustness, and several studies showed that gene expression meta analysis also increased classification performance (Xu et al., 2005, Fishel et al., 2007).
We performed a survival analysis between good and poor progno-sis groups in study 1 (ER+) (Figure 3). Log-rank test gave a p-value of 4.89x10⁻⁵, suggesting good separation between the two groups. This is higher than p-values obtained with other signatures (Wang signature gave p=4.11x10⁻³, and GGI gave p=1.34x10⁻³). The Mammaprint signature was not able to separate Desmedt’s patients in significant groups. Even though ITI was not specifically designed to obtain good log rank score, it was able to separate patients with higher survival and patients with lower survival ex-pectancy. An alternative could have been to compute subnetwork score directly on genes log-rank p-values.
Status ER- ER+
Dataset Desmedt van de Vijver Desmedt van de Vijver
Signature GGI 70 g 76 g ITI(165) GGI 70 g 76 g ITI(122) GGI 70 g 76 g ITI(6) GGI 70 g 76 g ITI(14)
N 61 61 61 61 36 36 36 36 129 129 129 129 114 114 114 114 TN 6 0 14 22 3 2 12 17 63 28 53 86 57 39 50 49 FP 28 34 20 12 16 17 7 2 31 66 41 8 18 36 25 26 TP 23 27 9 11 14 17 8 2 21 25 25 9 20 32 22 10 FN 4 0 18 16 3 0 9 15 14 10 10 26 19 7 17 29 ACC 0.475 0.442 0.377 0.541 0.472 0.528 0.556 0.528 0.651 0.411 0.604 0.736 0.675 0.623 0.632 0.518 SV 0.852 1 0.333 0.407 0.823 1 0.471 0.118 0.600 0.714 0.714 0.257 0.512 0.821 0.564 0.256 SP 0.176 0 0.411 0.647 0.157 0.106 0.632 0.895 0.670 0.298 0.563 0.915 0.760 0.520 0.667 0.653 at INSERM on January 12, 2012 http://bioinformatics.oxfordjournals.org/ Downloaded from
6
Fig. 3. Kaplan-Meyer estimator of good-prognosis (lower risk of distant
metastasis) and poor-prognosis groups (higher risk of distant metastasis) survival rates as defined by ITI, Mammaprint, Wang’s signature and GGI for the ER+ Desmedt dataset. ITI gave the lowest p-value of 4.89.10-5 with
a Log-rank test among all tested signatures.
3.3 Signatures obtained with ITI show a stability of 11.5-32.8% for different training sets
Wang and van de Vijver signatures have only 3 genes in common, which represent less than 5% of all the genes in the two signatures. We compared the two signatures obtained with ITI for ER+ and ER- samples with the Desmedt and van de Vijver tumors. A total of 937 genes were found in common between the Desmedt and the van de Vijver signature for ER- samples, and 46 genes between the Desmedt and van de Vijver signatures for ER+ samples. This rep-resents an overlap of respectively 32.8% (ER-) and 11.5% (ER+). These relatively low values reflect the fact that datasets and plat-forms are biased. However, this is largely superior to the 3 com-mon genes between the Wang and van de Vijver signatures. This overlap between subnetwork sets could probably be improved by using a larger training compendium.
3.4 Biology of the discriminative subnetwork set is meaningful
We examined the enriched annotations from the Gene Ontology biological process for the subnetworks obtained in study 1. Table 4 shows several enriched GO terms for both ER+ and ER- signa-tures. Ontology terms found in discriminative subnetworks are linked to regulatory processes disrupted in cancer (cell cycle, DNA damage checkpoint) and in metastasis (immune system, cell prolif-eration, focal adhesion, cell migration and cytoskeleton organiza-tion) in both ER+ and ER- tumors.
As an example, we describe here a subnetwork significantly asso-ciated with metastasis in study 1 (ER-) (subnetwork 6693, repre-sented in Figure 4). Subnetwork 6693 contained genes with well known function in ER- BCs and metastasis, such as the tumor
sup-pressor gene (TSG) TP53 and the tyrosine kinase receptors ERBB2 and EGFR.
Fig. 4. Graphical representation of part of subnetwork 6693 (Study 1, ER-).
This illustrates a discriminative subnetwork from the Sabatier and cowork-ers dataset. Nodes and edges correspond to genes encoding proteins and protein-protein interactions, respectively. Yellow and blue nodes denote an over-expression and an under-expression, respectively, among patients with distant metastasis compared with the other ones.
The subnetwork contained also several cell cycle kinases and regu-lators (CDK2, CDKN1A, CDKN2A), NQO1, whose altered ex-pression has been associated with various forms of cancer. PIN1 is present in the subnetwork, and was recently found to promote ag-gressiveness in BC. Insulin receptor was also present; its deregu-lated expression correlates with poor response to anti IGF-FR ther-apy in triple negative BC. It also contained several well known oncogenes and genes not previously linked to cancer, but which may be acting as BC driver genes.
Table 4. Enriched Gene Ontology annotations of ER+ and ER-
subnet-works. Several enriched ontologies for subnetworks extracted in study 1 (ER-) and study 1 (ER+) studies are related to cancer.
Gene Ontology GO Corrected p-value
ER+
mRNA cleavage GO:0006379 1,25E-08
regulation of growth hormone secretion
GO:0060123 2,18E-07 positive regulation of
cytoskele-ton organization
GO:0051495 2,06E-04 regulation of insulin secretion GO:0050796 1,55E-05
regulation of chemotaxis GO:0050920 4,29E-07
ER-
natural killer cell mediated immunity
GO:0002228 2,93E-06 positive regulation of MAP
kinase activity
GO:0043406 4,76E-10
muscle cell development GO:0055001 1,06E-11
interphase of mitotic cell cycle GO:0051329 4,08E-11 Wnt receptor signalling
path-way through beta-catenin
GO:0060070 6,22E-10
at INSERM on January 12, 2012
http://bioinformatics.oxfordjournals.org/
4 DISCUSSION
We conceived a network-based algorithm (Interactome-Transcriptome Integration) to identify prognostic genomic signa-tures generalizable over multiple and heterogeneous microarray datasets. This algorithm works in two steps: first it integrates data from a compendium of BC microarray datasets, and second it finds subnetworks, i.e. interacting gene complexes, whose expression discriminates two conditions of interest. Subnetworks are filtered by statistical validation.
We applied the ITI algorithm to the particularly important but still unresolved question of finding markers for BC distant metastasis for which a large body of public data is available.
Our approach illustrates the feasibility of integrating gene expres-sion data compendia (930 BC tumor samples were integrated) and large scale PPI data; it represents a potential data mining tool for gene expression repositories. It features inclusion of prior data under the form of PPI interactions and clinical annotations. We produced two ER status-specific signatures that were validated on independent datasets held out from training. Repeating the ex-periments for two datasets (Desmedt and van de Vijver) yielded higher classification performance than previously published classi-fiers in both cases [74% for Desmedt (ER+) and 53% for van de Vijver (ER+)]. Our subnetwork-based signatures reflect the large biological footprint of metastasis and is consequently larger that previously published signatures. The classifier obtained with ITI subnetworks was less sensitive to platform bias than previously published classifiers, since performance obtained was similar on the two training compendia. It also showed high specificity, which is critical to make a decision on avoiding unnecessary adjuvant systemic treatment.
The ITI algorithm is currently extended to incorporate other data types, including DNA copy number variation data [SNPs, Compar-ative Genomic Hybridization arrays (CGH) and DNA methylation profiles]. ITI capability to handle the curse of dimensionality makes it suitable to detect biomarkers yielded by deep sequencing analysis. In next versions, PPI interaction type will also be taken into account at the interactome integration and subnetwork aggre-gation steps. Also, classification performance is inherently tied to molecular subtypes and finer subtyping is necessary to render this technology suitable for clinical use. A significant increase in ER- classification was observed by separating early and lately relapsing patients (data not shown). Further clinical validation could be envi-sioned through a phase-2 clinical trial with customized microarrays for adjuvant chemotherapy treatment decision making.
ACKNOWLEDGEMENTS
Funding: Research was funded by the Institut National du Cancer, the Ligue Nationale Contre le Cancer and the Institut National de la Santé et de la Recherche Médicale. Support for the Beowulf cluster was obtained from Fondation pour la Recherche Médicale. Maxime Garcia is funded by an Institut National de la Santé et de la Recherche Médicale - Région Provence-Alpes Côte d’Azur Fel-lowship. Thanks to Sabrina Carpentier for helpful discussions on the method, and Dr Françoise Birg and Wahiba Gherraby for proofing the manuscript.
Conflict of interest: none declared.
REFERENCES
Aranda, B., Achuthan, P., Alam-Faruque, Y., Armean, I., Bridge, A., Derow, C., Feuermann, M., Ghanbarian, A. T., Kerrien, S., Khadake, J., et al. (2010). The IntAct molecular interaction data-base in 2010. Nucleic Acids Res 38, D525-531.
Barrett, T., Troup, D. B., Wilhite, S. E., Ledoux, P., Rudnev, D., Evangelista, C., Kim, I. F., Soboleva, A., Tomashevsky, M., Mar-shall, K. A., et al. (2009). NCBI GEO: archive for high-throughput functional genomic data. Nucleic Acids Res 37, D885-890. Bertucci, F., Finetti, P., Cervera, N., Maraninchi, D., Viens, P., et Birnbaum, D. (2006). Gene expression profiling and clinical out-come in breast cancer. OMICS 10, 429-443.
Ceol, A., Chatr Aryamontri, A., Licata, L., Peluso, D., Briganti, L., Perfetto, L., Castagnoli, L., et Cesareni, G. (2010). MINT, the molecular interaction database: 2009 update. Nucleic Acids Res
38, D532-539.
Chuang, H.-Y., Lee, E., Liu, Y.-T., Lee, D., et Ideker, T. (2007). Network-based classification of breast cancer metastasis. Mol. Syst. Biol 3, 140.
Desmedt, C., Haibe-Kains, B., Wirapati, P., Buyse, M., Larsimont, D., Bontempi, G., Delorenzi, M., Piccart, M., et Sotiriou, C. (2008). Biological processes associated with breast cancer clinical outcome depend on the molecular subtypes. Clin. Cancer Res 14, 5158-5165.
Dobbin, K. K., Zhao, Y., et Simon, R. M. (2008). How large a training set is needed to develop a classifier for microarray data? Clin. Cancer Res 14, 108-114.
Ein-Dor, L., Zuk, O., et Domany, E. (2006). Thousands of samples are needed to generate a robust gene list for predicting outcome in cancer. Proc. Natl. Acad. Sci. U.S.A. 103, 5923-5928.
Fan, C., Oh, D. S., Wessels, L., Weigelt, B., Nuyten, D. S. A., Nobel, A. B., van’t Veer, L. J., et Perou, C. M. (2006). Concord-ance among gene-expression-based predictors for breast cConcord-ancer. N. Engl. J. Med 355, 560-569.
Fishel, I., Kaufman, A., et Ruppin, E. (2007). Meta-analysis of gene expression data: a predictor-based approach. Bioinformatics
23, 1599-1606.
Gill, R., Datta, S., et Datta, S. (2010). A statistical framework for differential network analysis from microarray data. BMC Bioin-formatics 11, 95.
Gillis, J., Mistry, M., et Pavlidis, P. (2010). Gene function analysis in complex data sets using ErmineJ. Nat Protoc 5, 1148-1159. Hanisch, D., Zien, A., Zimmer, R., et Lengauer, T. (2002). Co-clustering of biological networks and gene expression data. Bioin-formatics 18 Suppl 1, S145-154.
Hong, F., et Breitling, R. (2008). A comparison of meta-analysis methods for detecting differentially expressed genes in microarray experiments. Bioinformatics 24, 374-382.
Keshava Prasad, T. S., Goel, R., Kandasamy, K., Keerthikumar, S., Kumar, S., Mathivanan, S., Telikicherla, D., Raju, R., Shafreen, B., Venugopal, A., et al. (2009). Human Protein Reference Database--2009 update. Nucleic Acids Res 37, D767-772.
Loi, S., Haibe-Kains, B., Desmedt, C., Wirapati, P., Lallemand, F., Tutt, A. M., Gillet, C., Ellis, P., Ryder, K., Reid, J. F., et al. (2008). Predicting prognosis using molecular profiling in estrogen recep-tor-positive breast cancer treated with tamoxifen. BMC Genomics
9, 239.
Michiels, S., Koscielny, S., et Hill, C. (2005). Prediction of cancer outcome with microarrays: a multiple random validation strategy. Lancet 365, 488-492.
Ramani, A. K., Bunescu, R. C., Mooney, R. J., et Marcotte, E. M. (2005). Consolidating the set of known human protein-protein
at INSERM on January 12, 2012
http://bioinformatics.oxfordjournals.org/
8
interactions in preparation for large-scale mapping of the human interactome. Genome Biol 6, R40.
Rapaport, F., Zinovyev, A., Dutreix, M., Barillot, E., et Vert, J.-P. (2007). Classification of microarray data using gene networks. BMC Bioinformatics 8, 35.
Reyal, F., Stransky, N., Bernard-Pierrot, I., Vincent-Salomon, A., de Rycke, Y., Elvin, P., Cassidy, A., Graham, A., Spraggon, C., Désille, Y., et al. (2005). Visualizing chromosomes as transcrip-tome correlation maps: evidence of chromosomal domains contain-ing co-expressed genes--a study of 130 invasive ductal breast car-cinomas. Cancer Res 65, 1376-1383.
Sabatier, R., Finetti, P., Cervera, N., Lambaudie, E., Esterni, B., Mamessier, E., Tallet, A., Chabannon, C., Extra, J.-M., Jacque-mier, J., et al. (2011). A gene expression signature identifies two prognostic subgroups of basal breast cancer. Breast Cancer Res. Treat 126, 407-420.
Salwinski, L., Miller, C. S., Smith, A. J., Pettit, F. K., Bowie, J. U., et Eisenberg, D. (2004). The Database of Interacting Proteins: 2004 update. Nucleic Acids Res 32, D449-451.
Schmidt, M., Böhm, D., von Törne, C., Steiner, E., Puhl, A., Pilch, H., Lehr, H.-A., Hengstler, J. G., Kölbl, H., et Gehrmann, M. (2008). The humoral immune system has a key prognostic impact in node-negative breast cancer. Cancer Res 68, 5405-5413. Sørlie, T., Perou, C. M., Tibshirani, R., Aas, T., Geisler, S., John-sen, H., Hastie, T., EiJohn-sen, M. B., van de Rijn, M., Jeffrey, S. S., et al. (2001). Gene expression patterns of breast carcinomas distin-guish tumor subclasses with clinical implications. Proc. Natl. Acad. Sci. U.S.A 98, 10869-10874.
Sotiriou, C., Wirapati, P., Loi, S., Harris, A., Fox, S., Smeds, J., Nordgren, H., Farmer, P., Praz, V., Haibe-Kains, B., et al. (2006). Gene expression profiling in breast cancer: understanding the mo-lecular basis of histologic grade to improve prognosis. J. Natl. Cancer Inst 98, 262-272.
The Gene Ontology in 2010: extensions and refinements (2010). Nucleic Acids Res 38, D331-335.
van de Vijver, M. J., He, Y. D., van’t Veer, L. J., Dai, H., Hart, A. A. M., Voskuil, D. W., Schreiber, G. J., Peterse, J. L., Roberts, C., Marton, M. J., et al. (2002). A gene-expression signature as a pre-dictor of survival in breast cancer. N. Engl. J. Med 347, 1999-2009.
Wang, Y., Klijn, J. G. M., Zhang, Y., Sieuwerts, A. M., Look, M. P., Yang, F., Talantov, D., Timmermans, M., Meijer-van Gelder, M. E., Yu, J., et al. (2005). Gene-expression profiles to predict distant metastasis of lymph-node-negative primary breast cancer. Lancet 365, 671-679.
Xu, L., Tan, A. C., Naiman, D. Q., Geman, D., et Winslow, R. L. (2005). Robust prostate cancer marker genes emerge from direct integration of inter-study microarray data. Bioinformatics 21, 3905-3911.
Zhu, Y., Shen, X., et Pan, W. (2009). Network-based support vec-tor machine for classification of microarray samples. BMC Bioin-formatics 10 Suppl 1, S21.
at INSERM on January 12, 2012
http://bioinformatics.oxfordjournals.org/