HAL Id: hal-00304599
https://hal.archives-ouvertes.fr/hal-00304599
Submitted on 1 Jan 2001HAL is a multi-disciplinary open access archive for the deposit and dissemination of sci-entific research documents, whether they are pub-lished or not. The documents may come from teaching and research institutions in France or abroad, or from public or private research centers.
L’archive ouverte pluridisciplinaire HAL, est destinée au dépôt et à la diffusion de documents scientifiques de niveau recherche, publiés ou non, émanant des établissements d’enseignement et de recherche français ou étrangers, des laboratoires publics ou privés.
relationship to circulation indices
C. Rodríguez-Puebla, A. H. Encinas, J. Sáenz
To cite this version:
C. Rodríguez-Puebla, A. H. Encinas, J. Sáenz. Winter precipitation over the Iberian peninsula and its relationship to circulation indices. Hydrology and Earth System Sciences Discussions, European Geosciences Union, 2001, 5 (2), pp.233-244. �hal-00304599�
Winter precipitation over the Iberian peninsula and its relationship to circulation indices
Hydrology and Earth System Sciences, 5(2), 233–244 (2001) © EGS
Winter precipitation over the Iberian peninsula and its relationship
to circulation indices
C. Rodríguez-Puebla
1*, A.H. Encinas
2and J. Sáenz
31Dept. de Física de la Atmósfera. Facultad de Ciencias Universidad de Salamanca. Spain 2Dept. de Matemática Aplicada. Facultad de Ciencias. Universidad de Salamanca. Spain 3Dept. de Física Aplicada II. Universidad del País Vasco. Spain
*email for corresponding author: [email protected]
Abstract
Winter precipitation variability over the Iberian peninsula was investigated by obtaining the spatial and temporal patterns. Empirical Orthogonal Functions were used to describe the variance distribution and to compress the precipitation data into a few modes. The corresponding spatial patterns divide the peninsula into climatic regions according to precipitation variations. The associated time series were related to large scale circulation indices and tropical sea surface temperature anomalies by using lag cross-correlation and cross-spectrum. The major findings are: the most influential indices for winter precipitation were the North Atlantic Oscillation and the East Atlantic/West Russian pattern; coherent oscillations were detected at about eight years between precipitation and the North Atlantic Oscillation and some dynamic consequences of the circulation on precipitation over the Iberian peninsula were examined during drought and wet spells. In the end statistical methods have been proposed to downscale seasonal precipitation prediction.
Keywords: winter precipitation, circulation indices, Iberian peninsula climate, climate variations, precipitation trend
Introduction
The major objective of this study was to obtain relationships between precipitation variability over the Iberian Peninsula (IP) on an interannual time scale and the circulation patterns represented by the teleconnection indices. This study was motivated by the interest in precipitation prediction for hydrological and agricultural activities and because the methods based on General Circulation Models (GCMs) are not accurate enough (Bardossy, 1995). Since links exist between air mass distribution over large areas and local precipitation, an approximate solution to the problem by statistical means is proposed.
Many studies have been concerned with the relationships between circulation and precipitation; some of them proposed downscaling methods for precipitation prediction (Heyen et al., 1996; Zorita and von Storch, 1997; Cavazos, 1999; Kidson and Thompson, 1998; von Storch et al., 1993), while others attempted to justify extreme rainfall conditions (Kutiel et al., 1996). In general, the relationships are based on a selection of weather types that relate most closely to the occurrence of precipitation (Zorita et al., 1995; Goodess and Palutikof, 1998; Romero et al., 1998). The atmospheric circulation can be classified by subjective criteria such as
the Lamb weather type catalogue (Perry and Mayes, 1998), or the Font weather types for the Iberian peninsula (Font Tullot, 2000); however, it is preferable to obtain weather patterns using essentially objective methods based on numerical relationships between data, such as were proposed by Wallace and Gutzler (1981) or Barnston and Livezey (1987). In the present study, the teleconnection circulation indices distributed by the National Climatic Environmental Prediction (NCEP) based on objective criteria were used. The indices refer to recurring and persistent large patterns of pressure and atmospheric circulation anomalies that span vast geographical areas.
Data
Monthly precipitation observations provided by the National Meteorological institutes of Spain and Portugal corresponding to 56 stations spread throughout the whole peninsula (Fig. 1) and for the period 1949 to 1998 were the primary dataset available. These data were quality controlled and checked for inhomogeneities (Peterson et al., 1998; Rodriguez-Puebla et al., 1998). The accumulated winter precipitation was then separated by adding NDJ (November-December-January), DJF (December-January-February) and
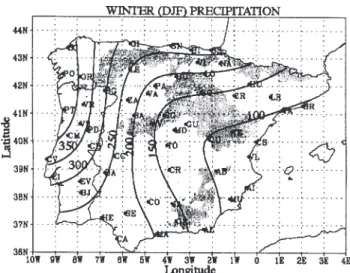
JFM (January-February-March) data. Three months accumulated precipitation is used instead of monthly precipitation because Johansson et al. (1998) recommended using a season to identify a significant signal to noise ratio. Figure 1 shows the distribution of accumulated winter (DJF) precipitation over the whole peninsula: much higher precipitation is produced towards the north-western part of the peninsula (more than 300 mm in the three months) than in the south-eastern half (less than 100 mm). The winter season with slightly higher precipitation corresponds to NDJ with 205 mm on average for the whole IP, while in DJF it is 190 mm and in JFM it is 168 mm.
To obtain Fig. 1, gridded data with a resolution of 0.5*0.5 degree latitude*longitude were derived from the 56 stations located at different elevations from sea level up to 1380 m (PD in Fig. 1). The Barnes interpolation scheme used (Krishnamurti and Bounoua, 1996) does not consider the orographic precipitation effect; therefore, the precipitation distribution is an approximation of the true one. To obtain a model of precipitation distribution depending on the orography is complicated since the climate in smaller areas must be examined (Basist et al., 1994). In winter and for the whole IP, the longitude is the most influential geographic factor in precipitation distribution, which is related to the prevailing winds. The accuracy of the interpolation scheme was evaluated by comparing the observations and the nearest interpolated gridpoint values using correlation analysis, the correlation coefficient being higher than 0.9 for the three moving seasons.
Application of statistical methods requires the data to behave in a Gaussian fashion. However, the accumulated
winter precipitation is not so distributed so a natural logarithmic transformation was applied to the data. Two tests to verify normal behaviour were considered:
(1) The comparison of the probability plot of the average precipitation time series and of the natural logarithm for the same time series (Fig. 2). The average precipitation time series was obtained from the winter (DJF) data corresponding to the 56 locations. The solid line of Fig. 2 (raw data) shows a significant slope, while the dashed line (transformed data) is almost horizontal, revealing that the mean and the median of the transformed precipitation data coincide (von Storch and Zwiers, 1999).
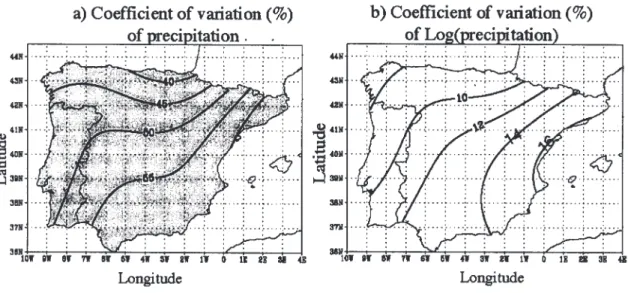
(2) The coefficient of variation distribution of winter (DJF) precipitation (CVP) in Fig. 3a and of the logarithm of winter precipitation (CVLP) in Fig. 3b reveal that the CVP is large enough (>25%) to be Gaussian (Groisman and Easterling, 1994) while the CVLP is lower than < 25%, thus fulfilling the normal requirements. Hence, the logarithm of accumulated precipitation was used for the study. After the transformation, the higher variability corresponding to the Mediterranean area must be considered in the analysis. The precipitation data were tested for trend and autocorrelation. The map with the distribution of the Mann-Kendall trend test (Z), computed according to Sneyers (1990) and Schonwiese and Rapp (1997), for DJF is shown in Fig. 4. Z values lower than ±2 indicate the absence of a significant trend and the mean can be considered independent of time. This condition is present for the entire 50 year period
Fig. 1. Map of the Iberian Peninsula showing locations of
observation data. The elevation higher than 900 m is shaded. The contour lines represent the spatial distribution of winter (DJF)
precipitation. The contour interval is 50 mm.
Fig. 2. Probability plot for the (DJF) averaged winter precipitation
(solid line), and for the natural logarithm of the same time series (dashed line). The average precipitation time series was obtained from the winter (DJF) precipitation data corresponding to the 56
Winter precipitation over the Iberian peninsula and its relationship to circulation indices
of winter precipitation. The mean value of the Z test for the 56 locations was –0.08, the minimum value was –1.48, the maximum value was 1.92 and the standard deviation 0.70. However, the Mann-Kendall test for the period 1949 to 1973 revealed a positive trend since the range of Z varied between –1.22 to 2.77 with a mean value of 1.04 for the 56 locations; while from 1974 to 1998 the range of Z varied between –1.64 to 1.64 with a mean of -0.09 for the 56 locations. These results differ from those obtained by Hanssen-Bauer and Forland (1998), who identified a positive and significant trend from 1960 to 1997 in Norway.
The data were also tested for autocorrelation. There is no large autocorrelation for the first lag because the values varied between 0.0 and 0.4 with a mean value of 0.18 for the 56 locations. However, previous studies (Rodriguez-Puebla and Encinas, 1997) showed that the precipitation time series had interannual fluctuations, the second moment was a function of time and, to perform this study, the precipitation process must be assumed to be weakly cyclo-stationary (von Storch and Zwiers, 1999).
Other data considered in this study were the teleconnection indices which refer to circulation anomalies at 700 hPa that span vast geographical areas and reflect an important part of both the interannual and interdecadal variability of atmospheric dynamics. The Climate Prediction Center (CPC) (Bell and Halpert, 1995) monitors and documents teleconnection indices. The patterns were explained in the papers of Wallace and Gutzler (1981) and Barnston and Livezey (1987).
The following indices affect winter precipitation over the IP:
l North Atlantic Oscillation (NAO): this refers to a
meridional seesaw of anomalies in the atmospheric mass. Some different indices have been proposed to measure the NAO (Hurrel, 1995; Jones et al., 1997, Barnston and Livezey, 1987). In this study, the index given by the CPC was obtained following the technique of rotated EOF (Barnston and Livezey, 1987); this NAO consists of a north-south dipole of anomalies, with one centre located over Greenland and the other of opposite sign spanning the central latitudes of the North Atlantic
Fig. 3. (a) Coefficient of variation (%) for the winter precipitation (DJF); b) Coefficient of variation (%) of the natural logarithm for the same
time series. Values greater than 30% are shaded.
Fig. 4. Spatial distribution of the Mann-Kendall test (Z) in winter (DJF) precipitation. The contour interval is 0.25, positive values
between 35–40N.
l East Atlantic pattern (EA): this consists of a north-south
dipole of anomaly centres which span the entire North Atlantic Ocean; the anomaly centres are displaced towards the southeast with respect to the NAO.
l East Atlantic/West Russia (EA/WR): this consists of
two main anomaly centres, located over the Caspian Sea and western Europe in winter. The patterns change in spring and autumn.
l Polar/Eurasia (POL): the pattern consists of one main
anomaly centre over the polar region and separate centres of opposite sign to the polar anomaly over Europe and northeastern China. It reflects major changes in the strength of the circumpolar circulation. The geopotential and wind data at 700 hPa level were taken from the monthly dataset produced from NCEP/NCAR reanalysis data described by Kalnay et al., 1996. The monthly means are averages of four 6-hourly analyses on a 2.5 º latitude*longitude grid.
The El Niño/Southern Oscillation event (ENSO) is the best known mode of interannual variability and many studies attempt to relate anomalous precipitation patterns over the globe to the ENSO (Ropelewski and Halpert, 1996). To explore the consequences of the ENSO events on winter precipitation over the peninsula the Southern Oscillation Index (SOI) represented by the standardised surface pressure anomalies between Tahiti and Darwin was used.
Modes of precipitation variations
The dominant modes of winter precipitation variability were obtained from the standardised anomalies of the logarithm of the precipitation by the Singular Value Decomposition (SVD) method (Bretherton et al., 1992; von Storch and
Navarra, 1995). The modes include: the spatial patterns or Empirical Orthogonal Functions (EOFs); the Principal Components (PCs) or expansion coefficients, and the eigenvalues which indicate the relative importance of the modes. To identify the modes which are statistically significant, the selection rules N or resampling test (Preisendorfer and Mobley, 1988; Cahalan, 1983) and the North significant test, which gives the typical error of the estimated EOFs (North et al., 1982), were estimated. When one eigenvalue stands out and has a small sampling error, the mode may have a physical explanation. Consistent with this criterion, three modes were significant in NDJ, while four modes could be significant in DJF (Fig. 5) and JFM. The spatial patterns that account for statistical significance were then rotated orthogonally by the varimax method because this procedure provides a better representation of the variance over different domains of the IP and the modes
Fig. 5. Eigenvalue spectrum of winter (DJF) precipitation (solid
line); noise eigenvalue (dashed line) and eigenvalue error (sdt).
Table 1. Variances (VAR) described by the EOFs. Correlation (CORR) between the principal components (PC) and the
teleconnection indices (INDEX) for the three winter seasons: NDJ, DJF and JFM.
Season NDJ DJF JFM
Mode VAR % INDEX CORR VAR% INDEX CORR VAR% INDEX CORR
PC1 46 NAO12 –0.43 36 EA2 0.38 33 NAO2 –0.30
NAO2 –0.33 POL2 –0.30
PC2 20 NAO12 –0.55 22 NAO12 –0.59 25 NAO1 –0.41
NAO1 –0.37 A/SSTA2 0.31
PC3 12 EA/WR11 –0.40 14 EA/WR12 –0.42 13 EA/WR1 –0.37
EA/WR1 –0.38
Winter precipitation over the Iberian peninsula and its relationship to circulation indices
would become more stable and robust with respect to the unrotated EOFs (Richman, 1986; White and Richman, 1991).
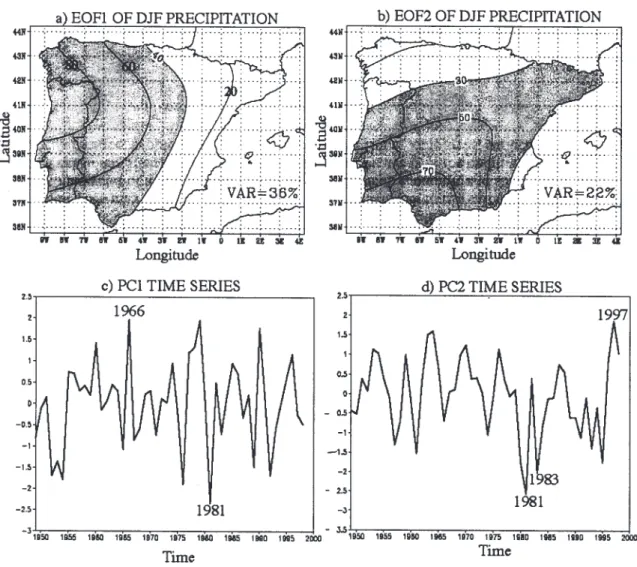
Table 1 depicts the variances described by the modes and Figs. 6a, 6b, 8a and 8b show the spatial distribution of the modes for DJF, given by the correlation coefficient between the corresponding PC and the precipitation time series. Since there are not many differences among the EOF modes for NDJ, DJF and JFM, only the Figs. for the DJF season are shown.
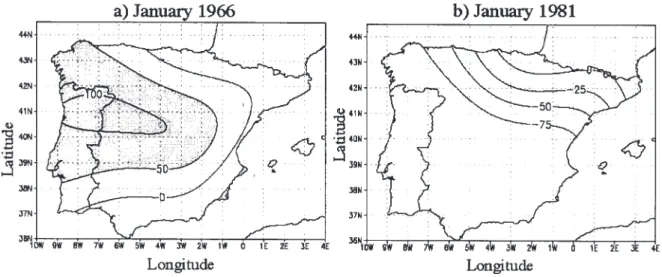
The first mode (Fig. 6a) shows a higher contribution in the northwestern part of the peninsula. The time series associated with the mode (Fig. 6c) indicates heavy precipitation in the winter of 1966, while the winter of 1981 was essentially dry in the regions represented by the first and second mode (western part of the IP). The patterns of relative precipitation anomalies in percentages for January 1966 and January 1981 are shown in Figs. 7a and 7b; they
show positive (negative) anomalies towards the west of the IP. Font Tullot (1988) reported an unusual frequency of storm-tracks over the peninsula in winter 1966 and the persistent drought in 1981.
The second mode (Fig. 6b) shows higher values from southwest to northeast and the associated time series (Fig. 6d) indicates that the 1997 winter was essentially wet while the 1981 and 1983 winters were characterised by low precipitation. The extraordinary drought from December 1982 to February 1983 was mentioned by Font Tullot (2000) who reported the absence of rain in Madrid (MD in Fig. 1) from 27 November to 21 February.
The third mode (Fig. 8a) represents the variability in the northern part of the peninsula. The associated time series (Fig. 8c) indicates that the winter of 1961 was the rainiest in the Basque County (this was also reported by Font Tullot, 1988) while the 1992 winter was the driest in that region. The pattern of relative precipitation anomalies in percentages
Fig.6. First and second modes of winter precipitation: on the top the Empirical Orthogonal Functions (EOFs), the contour interval is 20%; on
Fig. 7. Patterns of relative precipitation anomalies (%) in January 1966 and January 1981. Values greater than 50 are shaded.
Fig. 8. Third and fourth modes of winter precipitation: on the top the Empirical Orthogonal Functions (EOFs), the contour interval is 20%;
Winter precipitation over the Iberian peninsula and its relationship to circulation indices
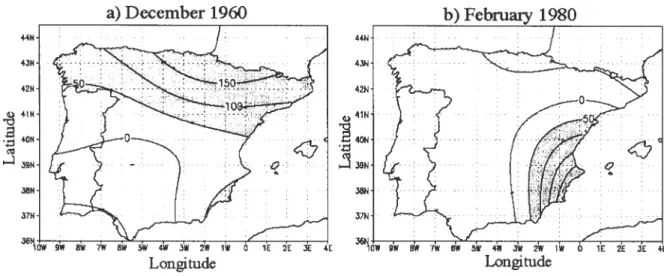
for December 1960 (Fig. 9a) resembles the third mode of precipitation variability.
The fourth mode (Fig. 8b) is less significant and describes the variability towards the eastern regions, winter 1980 being the rainiest and that of 1995 the driest (Fig. 8d) towards the Mediterranean coast. Fig. 9b shows the precipitation anomalies in February 1980, which depicts a configuration similar to the fourth spatial pattern.
Interpretations of the spatial and
temporal modes
The significant modes of precipitation variations are supposed to contain dynamic signals. A simple method for identifying links is cross-correlation analysis. The expansion coefficients or principal components were thus analysed by lag cross-correlation with the teleconnection indices proposed in the NCEP.
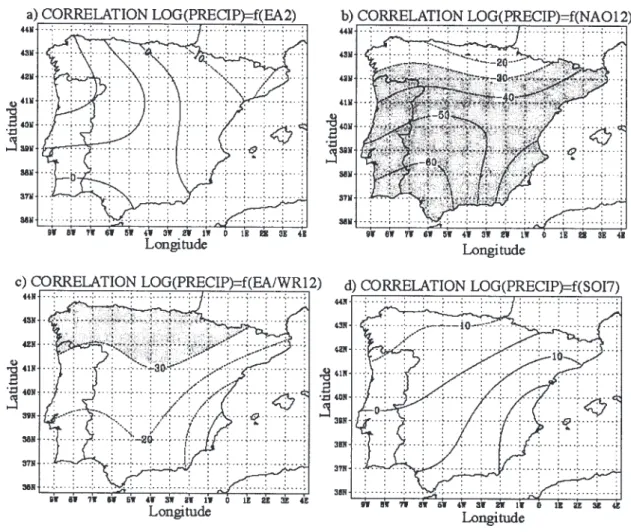
Table 1 depicts the indices that produce most variations in winter rainfall over the IP; the number with the indices stands for the month of greatest influence. For two random uncorrelated Gaussian time series a correlation is significant at the 95% level when it is greater than 0.28. The correlation patterns performed between the indices and the logarithm of winter precipitation provided structures similar to the modes of precipitation variability and indicated the regions where the indices have a strong influence (Fig. 10a - d). The results of Table 1 and Fig. 10 confirmed that the NAO is the major source of interannual variability in winter precipitation over the IP, which is in agreement with previous studies by Hurrel (1995), Lamb and Pepler (1987). The EA/ WR pattern is also important and negatively related to precipitation because the negative phases of this pattern
cause an increase in the northern geostrophic flow over the northern part of the peninsula.
In NDJ, the NAO and EA/WR indices explain precipitation variations; in DJF, besides the NAO and EA/ WR, the EA and SOI are related to precipitation distribution; finally, in the late winter season (JFM), signals of tropical influences account for precipitation variations.
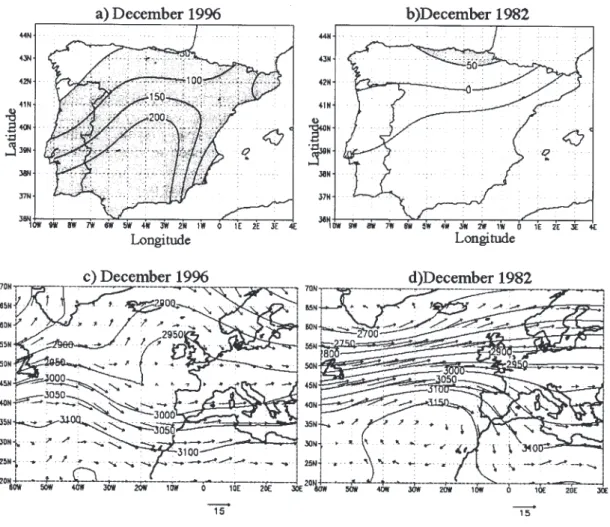
To explore precipitation variability it is important to link wet/dry spells to the atmospheric circulation. This kind of study has been performed by Mitchell and Blier (1997), Mo and Higgins (1998) in California. Figures 11a–b show the patterns of relative precipitation anomalies in percentages and Figs. 11c–d show the atmospheric circulation, represented by the 700 hPa geopotential and wind, for two months with extreme values of the NAO; these were December 1996 (NAO=–1.2) and December 1982 (NAO=1.7). A comparison of Figs. 11c and 11d reveals that displacement of the westerlies to lower latitudes causes heavy precipitation mainly in the southwestern regions of the peninsula (Fig. 11a), while drought conditions (Fig. 11b) correspond to a displacement of the westerlies to higher latitudes (Fig. 11d). Therefore, the negative phases of the NAO cause changes in the direction of westerlies that bring moist air over the peninsula and above normal precipitation. Authors such as Dai et al. (1997) and Ulbrich et al. (1999) demonstrated close relationships between the NAO and humidity advection, cyclone occurrence and upper air variability.
It is likely that the shift of westerlies towards lower latitudes that enhanced precipitation over the IP may be a consequence of the weakness of Hadley circulation. On the other hand, anomalous sea surface temperature (SST) is an important forcing mechanism for circulation anomalies over
Fig. 9. Patterns of relative precipitation anomalies (%) in (a) December 1960 and (b) February 1980. The contour interval is 50%, value s
Fig. 10. Heterogeneous correlation patterns between the teleconnection indices and logarithm of DJF precipitation. Contour interval 10%,
values greater than ±30% are shaded.
the mid-latitudes. Graham et al. (1994) showed that variability in the winter circulation arises from changes in tropical oceans, and Palmer (1986) associated the warm sea surface temperatures with the attenuation of the Hadley circulation strength. In agreement with these studies, a significant positive correlation has been obtained between tropical sea surface temperature anomalies in the Atlantic sector (A/SSTA) (5N–20N, 30W–60W) and precipitation over the IB peninsula for the late winter season (JFM) (Table 1).
The SOI does not show an effect on winter precipitation over the IP, which is consistent with the results of Moron and Ward (1998) and Rocha (1999). However, in the late winter season (JFM), variations in precipitation towards the eastern part of the peninsula point to the influence of the July SOI. An explanation of the lag is stated by Enfield and Mestas-Nuñez (2000) “the ENSO-SST variability is strongest in the Pacific ocean but extends to the tropical Atlantic and Indian Oceans with systematic lags of one to three seasons”.
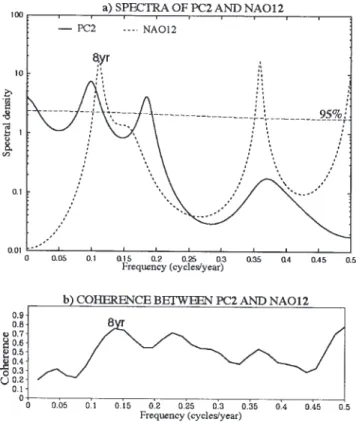
Cross-spectral analysis helps to reveal interactions between the components of the climate system. Schonwiese (1987) used cross-spectral analysis to provide physical reasons for periodic signals included in temperature series. More recently, Benner (1999) measured the coherence by cross-spectral analysis to explore the connections between the prominent oscillations in temperature in central England and solar activity. In the present study, cross-spectral and coherence analysis have been used to examine variations of precipitation in conjunction with circulation indices. When two time series have significant peaks at particular frequencies and the peaks are coherent, the local and global information constitutes a true climate signal. Singular Spectral Analysis (SSA) and Maximum Entropy Method (MEM) are used to perform the spectral analysis. SSA is designed to extract information from short and noisy time series (Ghil and Yiou, 1996); the noise components identified by SSA were filtered out prior to applying MEM. The spectra for the second mode (PC2) of DJF precipitation and NAO12 are shown in Fig. 12a, a quasi-periodic
Winter precipitation over the Iberian peninsula and its relationship to circulation indices
oscillation of approximately eight years is present in winter precipitation and in the NAO12. The cross-spectral analysis is obtained by Fast Fourier Transform (FFT) with a bandwidth of 0.078 cycles/year. The squared correlation for
the coherent frequency band between the modes in winter precipitation and the teleconnection indices are shown in Table 2. The NAO contributes, basically, to the low frequency precipitation variations while the EA/WR, SOI
Fig. 11. The upper figures are the patterns of relative precipitation anomalies (%), values greater than 50% are shaded : a) December 1996; b)
December 1982. The lower figures are the 700 hPa Geopotential and wind direction: c) December 1996; d) December 1982.
Table 2. Coherences (COHE) between the principal components (PCs) of precipitation variations and the teleconnection
indices (INDEX) for the coincident peaks (PER).
Season NDJ DJF JFM
Mode PER(yr) INDEX COHE PER(yr) INDEX COHE PER(yr) INDEX COHE
PC1 8 NAO12 0.85 2.2 EA2 0.72 11 NAO2 0.85
9 NAO2 0.76 16 POL2 0.60
PC2 8 NAO12 0.93 8 NAO12 0.85 2.5 NAO1 0.86
2.4 NAO1 0.86 5.8 A/SSTA2 0.74
PC3 5 EA/WR11 0.80 4 EA/WR12 0.68 3.5 EA/WR1 0.67
2.5 EA/WR11 0.92 3.8 EA/WR1 0.82
Fig. 12. (a) Spectra of the second principal component (PC2) of
winter (DJF) precipitation (solid line) and NAO of December (dashed line); (b) coherence for the two time series PC2 and
NAO12.
and A/SSTA contribute to the high frequency bands. The results revealed not only that the NAO is the most influential index on Iberian winter precipitation but also the presence of quasi-periodic oscillations at about eight years that must be signals of variations because they are coherent at about 0.8 squared correlation. The critical value for the coherency estimates (0.45) at a 95% significance level (von Storch and Zwiers, 1999) (Figure 12b).
Conclusions
In the present study, the precipitation observations for the winter seasons over the Iberian peninsula have been examined to characterise the variability in precipitation over the Iberian peninsula and to explain the variations by finding teleconnections with circulation indices. The data used were the logarithms of winter precipitation because they fit Gaussian behaviour.
A breakdown of precipitation variability has provided some insight into the physical sources of winter precipitation variations. Empirical Orthogonal Functions divide the peninsula into four regions with homogeneous precipitation variability. The spatial configurations and the temporal
evolution of the modes have been justified by finding relationships with teleconnection circulation indices. The main findings are: the North Atlantic Oscillation was the major source of interannual variability in winter precipitation over the Iberian peninsula; the regions most affected lay from the southwest to the northeast. The time series of precipitation and the NAO show a significant coherence for a common peak at about eight years.
Some examples concerning the possible cause of enhanced (decreased) precipitation in the region were identified by comparison with a displacement of the westerlies to lower (higher) latitudes; these changes in wind direction may be forced by positive anomalies in sea surface temperature in the tropical Atlantic (5N–20N, 30W–60W) (A/SSTA), because a positive association between A/SSTA and precipitation was obtained. The results are consistent with previous interpretations given by other authors and may be useful for predicting anomalous seasonal precipitation.
The East Atlantic/West Russian pattern is important in explaining precipitation variations in the northern part of the peninsula. However, the contribution of the Southern Oscillation Index to winter precipitation variations is very weak or may be masked by cyclone activity.
On the basis of these results, statistical models to characterise and predict the temporal and spatial variability of winter precipitation over the Iberian peninsula have been proposed. Because the models depend on atmospheric circulation indices, it will be necessary to develop reliable methods to forecast the circulation indices.
Acknowledgements
The authors wish to thank the Spanish and Portuguese National Meteorology Institutes for providing the precipitation data; the NCEP/NCAR and National Weather Service of the US for the teleconnection indices and Reanalysis data; the developers of GrADS and the two anonymous reviewers for their recommendations and comments. This paper was supported by the “Comision Interministerial de Ciencia y Tecnología, Programa Nacional”, Project CLI99-0845-CO3-02 and the collaboration of the “Consejería de Educación y Cultura de la Junta de Castilla y León y de la Unión Europea (Fondo Social Europeo)”, Project SA57/99. Finally, the help of D. Garvey in the English review is appreciated.
References
Bardossy, A., 1995. Stochastic downscaling of GCM-output results using atmospheric circulation patterns. In: Space and time scale variability and interdependencies in hydrological processes.
Winter precipitation over the Iberian peninsula and its relationship to circulation indices
Reinder A. Feddes (Ed.). Cambridge University Press, UK. 119– 123.
Basist, A., Bell, G. and Meentemeyer, V., 1994. Statistical relationships between topography and precipitation patterns. J. Climate, 7, 1305–1315.
Barnston, A.G. and Livezey, R.E., 1987. Classification, seasonality and persistence of low-frequency atmospheric circulation patterns. Mon. Weather Rev., 115, 1083–1126.
Bell, G.D. and Halpert, M.S., 1995. NOAA Atlas N0 12. Interseasonal and interannual variability: 1986 to 1993. Climate Analysis Center, US, NOAA, 256.
Benner, T.C., 1999. Central England temperatures: long-term variability and teleconnections. Int. J. Climatol., 19, 391–403. Bretherton, C., Smith, C. and Wallace, J.M., 1992. An intercomparison of methods for finding coupled patterns in climate data. J. Climate, 5, 541–560.
Cahalan R.F., 1983. EOF spectral estimation in climate analysis. Proc. 2nd Int. Meeting on Statistical Climatology, Lisbon, Portugal, 4.5.1–4.5.7.
Cavazos, T., 1999. Large-scale circulation anomalies conducive to extreme precipitation events and derivarion of daily rainfall in Northeastern Mexico and Southeastern Texas. J. Climate,
12, 1506–1523.
Dai, A., Fing, I.Y. and del Genio, A.D., 1997. Surface observed global land precipitation variations during 1900-98. J. Climate,
10, 2943–2962.
Enfield, D.B. and Mestas-Nuñez, A.M., 2000. Global modes of ENSO and non-ENSO sea surface temperature variability and their association with climate. In: El Niño and the Southern Oscillation. Multiscale variability and global and regional impacts. H.F. Diaz and V. Markgraf, (Eds.). Cambridge University Press, UK. 89-112.
Font Tullot, I., 2000. Climatología de España y Portugal (Nueva versión). Universidad de Salamanca, Spain.
Font Tullot, I., 1988. Historia del clima de España. Cambios climáticos. Instituto Nacional de Meteorología, Spain. Ghil, M. and Yiou, P., 1996. Spectral methods: what they can and
cannot do for climatic time series. In: NATO ASI Series, vol. I 44. Decadal climate variability. Dynamics and predictability. D.L.T. Anderson and J. Willebrand (Eds.). Springer-Verlag. Goodess, C. and Palutikof, J., 1998. Development of daily rainfall
scenarios for southeast Spain using a circulation-type approach to downscaling. Int. J. Climatol., 18, 1051–1083.
Graham, N.E., Barnett, T.P., Wilde, R., Ponater, M. and Schubert, S., 1994. On the roles of tropical and midlatitudes SSTs in forcing interannual to interdecadal variability in the Winter Northern Hemisphere Circulation. J. Climate, 7, 1416–1440. Groisman, P. and Easterling, D.R., 1994. Variability and trends of
total precipitationand snowfall over the United States and Canada. J. Climate, 7, 184–204.
Hanssen-Bauer, I. and Forland, E.J., 1998. Annual and seasonal precipitation variations in Norway 1896-1997. DNMI Report 27/98. Norwegian Meteorological Institute, Oslo, Norway. Heyen, H., Zorita, E. and von Storch, H., 1996. Statistical
downscaling of monthly mean North Atlantic air pressure to sea level anomalies in the Baltic Sea. Tellus, 48, 312–323. Hurrel, J.W., 1995. Decadal trends in the North Atlantic
Oscillation: regional temperatures and precipitation. Science,
269, 676–679.
Johansson, A., Barnston, A., Saha, S. and van den Dool, H., 1998. On the level and origin of Seasonal Forecast skill in Northern Europe. J. Atmos. Sci., 55, 103–127.
Jones, P.D., Jonsson, T. and Wheeler, D., 1997. Extension to the North Atlantic oscillation using early instrumental pressure observations from Gibraltar and south-west Iceland. Int. J. Climatol., 17, 1433–1450.
Kalnay, E., Kanamitsu, R., Kistler, R., Collins, W., Deaven, D., Gandin, L., Iredell, M., Saha, S., White, G., Woolen, J., Zhu, Y., Chelliah, M., Ebisuzaki, W., Higgins, W., Janowiak, J., Mo, K.C., Ropelewski, C., Wang, J., Leetmaa, A., Reynolds, R., Jenne, R. and Joseph, D., 1996. The NCEP/NCAR 40-year reanalysis project. Bull. Amer. Meteorol. Soc., 77, 437–471. Kidson, J.W. and Thompson, C.S., 1998. A comparison of
statistical and model-based downscaling techniques for estimating local climate variations. J. Climate, 11, 735–753. Krishnamurti, T.N. and Bounoua, L., 1996. Numerical weather
prediction techniques. CRC press.
Kutiel, H., Maheras, P. and Guika, S., 1996. Circulation and extreme rainfall conditions in the eastern Mediterranean during the last century. Int. J. Climatol., 16, 73–92.
Lamb, P.J. and Pepler, R.A. 1987. North Atlantic Oscillation and an application. Bull. Amer. Meteorol. Soc., 68, 1218–1225. Mitchell, T.P. and Blier, W., 1997. The variability of wintertime
precipitation in the region of California. J. Climate, 10, 2261– 2276.
Mo, K.C. and Higgins, R.W., 1998. Tropical influences on California precipitation. J. Climate, 11, 412–430.
Moron, V. and Ward, M.N., 1998. ENSO teleconnections with climate variability in the European and African sectors. Weather,
53, 287–295.
North, G.R., Bell, T.L., Cahalan, R.F. and Moeng, F.J., 1982. Sampling errors in the estimation of Empirical Orthogonal Functions. Mon. Weather Rev., 110, 699–706.
Palmer, T. 1986. Influence of the Atlantic, Pacific and Indian Oceans on Sahel rainfall. Nature, 322, 251–253.
Perry, A. and Mayes, J., 1998. The Lamb weather type catalogue. Weather, 53, 222–229.
Peterson, T.C., Easterling, D.R., Karl, T.R., Groisman, P., Nicholls, N., Plummer, N., Torok, S., Auer, I., Bohem, R., Gullet, D., Vincent, L., Heino, R., Tuomenvirta, H., Mestre, O., Szentimrey, T., Salinger, J., Forland, E.J., Hanssen-Bauer, I., Alexandersson, H., Jones, P. and Parker, D.,1998. Homogeneity adjustment of in situ atmospheric climate data: a review. Int. J. Climatol., 18, 1493–1517.
Preisendorfer, R.W. and Mobley, C.D. 1988. Principal Component analysis in Meteorology and Oceanography. Elsevier, Amsterdam, The Netherlands.
Richman, M.B. 1986. Rotation of principal components. J. Climatol., 6, 29–35.
Rocha, A. 1999. Low-frequency variability of seasonal rainfall over the Iberian peninsula and ENSO. Int. J. Climatol., 19, 889– 901.
Rodríguez-Puebla, C and Encinas, A.H., 1997. Interannual variability in precipitation observations over the Iberian peninsula. Climate Variations. American Meteorological Society. Preprints, 359–362.
Rodriguez-Puebla C., Encinas, A.H., Nieto, S. and Garmendia, J., 1998. Spatial and temporal patterns of annual precipitation variability over the Iberian peninsula. Int. J. Climatol., 18, 299– 316.
Romero, R., Ramis, C. and Guijarro, J.A.,1998. Daily rainfall patterns in the Spanish Mediterranean area: an objective classification. Int. J. Climatol., 19, 95–112.
Ropelewski, C.F. and Halpert, M.S., 1996. Quantifying Southern Oscillation precipitation relationships. J. Climate, 9, 1043–1059. Schonwiese, C.D., 1987. Moving spectral variance and coherence analysis and some applications on long air temperature series. J. Clim. Appl. Meteorol., 26, 1723–1730.
Schonwiese, C.D. and Rapp, J., 1997. Climate Trend Atlas of Europe. Based on observations 1891-1990.Kluwer, Dordrecht, The Netherlands.
observations. W.M.O. Nº 415, Technical Note Nº 143. Ulbrich, U., Christoph, M., Pinto, P. and Corte-Real, J., 1999.
Dependence of winter precipitation over Portugal on NAO and baroclinic wave activity. Int. J. Climatol., 19, 379–390. von Storch, H. and Zwiers, F.W., 1999. Statistical analysis in
climate research. Cambridge University Press, UK.
von Storch, H. and Navarra, A., 1995. Analysis of climate variability. Applications of Statistical techniques. Springer-Verlag.
von Storch, H., Zorita, E. and Cubasch, U., 1993. Downscaling of Global Climate Change estimates to regional scales: an application to Iberian rainfall in wintertime. J. Climate, 6, 1161– 1171.
Wallace, J.M. and Gutzler, D.S., 1981. Teleconnection in the Geopotential Height field during the Northern Hemisphere Winter. Mon. Weather. Rev., 109, 784–812.
White, D. and Richman, M., 1991. Climate regionalization and rotation of principal components. Int. J. Climatol., 11, 1–25. Zorita, E. and von Storch, H., 1997. A survey of statistical
downscaling techniques. GKSS 97/E/20, 42.
Zorita, E., Hughes, J.P., Lettemaier, D.P. and von Storch, H., 1995. Stochastic characterization of regional circulation patterns for climate model diagnosis and estimation of local precipitation. J. Climate, 8, 1023–1042.