HAL Id: hal-00304931
https://hal.archives-ouvertes.fr/hal-00304931
Submitted on 1 Jan 2004HAL is a multi-disciplinary open access archive for the deposit and dissemination of sci-entific research documents, whether they are pub-lished or not. The documents may come from teaching and research institutions in France or abroad, or from public or private research centers.
L’archive ouverte pluridisciplinaire HAL, est destinée au dépôt et à la diffusion de documents scientifiques de niveau recherche, publiés ou non, émanant des établissements d’enseignement et de recherche français ou étrangers, des laboratoires publics ou privés.
without acidity, on the growth and below-ground
dynamics of a young Sitka spruce stand growing on an
acid peat: implications for sustainability
L. J. Sheppard, A. Crossley, F. J. Harvey, U. Skiba, P. Coward, K. Ingleby
To cite this version:
L. J. Sheppard, A. Crossley, F. J. Harvey, U. Skiba, P. Coward, et al.. Effects of five years of frequent N additions, with or without acidity, on the growth and below-ground dynamics of a young Sitka spruce stand growing on an acid peat: implications for sustainability. Hydrology and Earth System Sciences Discussions, European Geosciences Union, 2004, 8 (3), pp.377-391. �hal-00304931�
Effects of five years of frequent N additions, with or without
acidity, on the growth and below-ground dynamics of a young
Sitka spruce stand growing on an acid peat: implications for
sustainability
Lucy J. Sheppard
1, Alan Crossley
1, Frank J. Harvey
1, Ute Skiba
1, Paul Coward
2and
Kevin Ingleby
11Centre for Ecology and Hydrology, Edinburgh, Bush Estate, Penicuik, EH26 0QB Scotland, UK
2Centre for Ecology and Hydrology, Lancaster Environment Centre, Library Avenue, Bailrigg, Lancaster LA1 4AP, UK
Email for corresponding author: [email protected]
Abstract
A field manipulation study was established to demonstrate effects of simulated wet N and S deposition on a young (planted 1986) stand of Sitka spruce growing on a predominantly organic soil in an area of low (810 kg N ha1 yr1) background N deposition in the Scottish borders.
From 1996, treatments (six) were applied to the canopies of ten-tree plots in each of four blocks. N was provided as NH4NO3, either with
H2SO4 (pH 2.5) at 48 or 96 kg N ha-1 yr-1 inputs or without, at 48 kg N ha1 yr1 along with wet (rain water) and dry controls (scaffolding) and
a S treatment (Na2SO4). Positive responses (+ >20% over 5 years) with respect to stem area increment were measured in response to N inputs,
irrespective of whether acid was included. The positive response to N was not dose related and was achieved against falling base cation concentrations in the foliage, particularly with respect to K. The results suggest young trees are able to buffer the low nutrient levels and produce new growth when there is sufficient N. Inputs of 96 kg N ha1 yr1, in addition to ambient N inputs, on this site exceeded tree demand
resulting in elevated foliar N, N2O losses and measurable soil water N. These excessive N inputs did not reduce stem area growth. Keywords: acid, canopy application, nitrogen, acid organic soil, simulated wet deposition, soil water, sulphur, young Sitka spruce
Introduction
Pollution effects on forests in the UK have not been widely studied by comparison with those in Europe and North America. This probably reflects the relatively low incidence of visible damage in UK forests that can with confidence be attributed to pollution. The apparently low level of detrimental effects is itself interesting given the long history of enhanced N and S emissions in the UK (Fowler et al., 2004) and the sensitivity of many UK soils to acidification (NEGTAP 2001). In the light of historical inputs and given the absence of significant levels of acute damage symptoms, such as necrotic needles, what is the prognosis for UK coniferous forests under continuing elevated N deposition? A considerable amount of work on the impacts of S, acidity and N the major pollutants in wet deposition since the 1980s has shown how the major ions SO2, H+, NH+ and NO
can acidify soils and influence tree growth; this was summarised comprehensively in Stjernquist and Sellden (2002) and Jönsson et al., (2003). Decreases in soil pH, coupled with the mobile anion effect, whereby soluble, mobile cations move down the soil profile and out of the rooting zone accompanying strong mobile anions e.g. NO
3-and SO42- can both impoverish soil and enhance the solubility
of toxic metal ions, i.e. Al3+ (Jentschke and Godbold, 2000;
deVries et al., 1995; NEGTAP 2001). It is predicted that, where the removal of base cations, both through leaching and N-led increases in the uptake of base cations by trees, exceeds the ability of the soil to replenish supplies, any benefits arising from eutrophication through N deposition will be reversed or worse (Sverdrup et al., 1994). This is because acidification can restrict growth, through increases in the solubility of A13+, which is toxic to roots and interferes
with Ca2+ uptake by roots (Foy, 1974), and reductions in
the availability of P, via the slowing down of mineralisation and increased P fixation (Carreira et al., 1997). As a result of the indirect effects of acidification on nutrient uptake and availability Emmett (1999) concluded that the impacts of enhanced N deposition on tree growth were variable and depended on soil type, i.e. chemical characteristics.
On a Ferric Stagnopodzol mineral soil in Wales using a 35-year-old Sitka spruce forest where N availability was relatively high, a N manipulation study that applied N every two weeks in solution to the soil surface, at 35 or 70 kg N ha1yr1 did not affect growth. Low P availability was thought
to be restricting the ability of the trees to make use of the additional N (summarised in Gundersen et al., 1998). On a base rich soil, not typical of soils where Sitka spruce is planted, a combination of acid + N (H2SO4+NH4NO3)
reduced stem area increment significantly; this was attributed to negative interactions between acidity and P availability restricting the potential for the trees to use the N (see Crossley et al., 1997,; Carreira et al., 1997). Generally, Sitka spruce forests have been planted on low fertility sites, ranging from peats to acid, Al dominated, P fixing soils (Barr
et al., 1993) where tree growth can be N limited but may
also be compromised by the low availability of P and K (McIntosh, 1981, 1983). Organic soils in particular have low levels of available P and K since mineralisation rates are low and they contain few weatherable minerals (Clymo, 1983). The low availability of P and K at many Sitka spruce sites suggests that any positive growth responses to N enrichment from atmospheric N deposition would not be sustainable, but would they be detrimental?
This paper reports changes in height, stem area increment and fine roots, foliar nutrition, litterfall and soil water chemistry in a young stand of Sitka spruce receiving various N and S treatments in a field manipulation study. Ammonium nitrate (NH4NO3) was applied, at canopy height, with and
without sulphuric acid (H2SO4) to a commercial forest of
Sitka spruce (Picea sitchenis Bong. Carr.) for five years. The trees were growing on a drained soil with an upper layer comprising 0.3 to 0.6 m of peat in the Scottish Borders. The aim of the study was to determine whether N inputs, supplied frequently at realistic low ionic concentrations, simulating wet deposition, would stimulate and maintain elevated growth rates despite the low availability of base cations. The following hypotheses were addressed: (1) Acidified N treatments would increase base cation availability but only for a short time. (2) Excess N would lead to reductions in growth through the induction of deficiencies of other nutrients e.g. K, P and base cations.
Methods
The site was part of a commercial forest, fertilised at planting but not subsequently, and drained using a double mole board plough that created ditches separating two lines of trees (Fig. 1). Treatments, described in Table 1, provided nitrogen (N) and sulphur (S) independently, together with acid at pH 2.5 (NSAcid). Ambient N deposition at the site was low, approximately 8 kg N ha1 yr1 divided almost equally
between wet and dry and oxidised and reduced (Fowler et
al., 1996) changing by ± 12 kg depending on the rainfall
amount. Each of the six treatments was provided to four plots, one per block, each plot containing 10 trees arranged in two parallel lines. Spray treatments, applied from one cone sprayer on either side of, or above the top whorl of each tree, were applied between April and November, pre bud burst to post growth cessation, but not over the winter when there was a risk of frost damaging the pipes. Wet and dry controls were included to assess the impact of the additional water. The experiment is unique in providing the treatment to the canopy with minimal changes to the immediate microclimate. Lateral movement of treatment was minimal as the plots were separated by at least 20m that included several rows of trees. Full details of the experimental set up can be found in Sheppard et al. (1999).
GROWTH
Basal stem area increments were measured using Vernier girth bands fitted between whorls 8 and 9. These were replaced as necessary and were read every two weeks between March and November. Diameter at breast height (DBH) was assessed annually using a diameter tape. Height increments were assessed retrospectively in September 2000 back to 1995, using an extending measuring pole placed on a fixed post at soil level with an observer on the scaffolding supporting the sprayers, level with the canopy.
FOLIAR NUTRITION
Annual sampling of one and two year old shoots was undertaken in December or January using second order laterals taken from the upper quartile. Shoots were removed from all 10 trees and bulked by plot. Samples were separated by age, dried at 75oC, the needles removed and ground.
Weights of 100 needles were taken by plot for one and two year old needles each year, (see Sheppard and Crossley, 2000). Chemical analyses for N determined by automated colorimetry (Skalar) and P, K, Ca, Mg and S using ICP-OES (Jobin-Yvon JY38Plus) were undertaken on digested samples at CEH Merlewood. The methodologies follow those in Allen (1989) and certified reference samples were
Table 1. Treatments applied in rainwater, collected on site, to a Sitka spruce stand
planted in 1986 on an acid peat at Deepsyke forest (Scottish borders)
Treatment Components Concentration Dose
mol m-3 kg ha-1yr-1 S N pH NSAcid NH4NO3 + H2SO4 1.6, *3.2 50 48 2.5 S Na2SO4 1.6 50 4.5 2NSAcid NH4NO3 + H2SO4 1.6, *3.2 100 96 2.5 N NH4NO3 1.6 48 4.5 Control NH4NO3 + H2SO4 0.01 <1 <1 4.5
No Spray framework only
*3.2 mol m-3 = H+ ion concentration. Ambient deposition provides an additional 8-10 kg N
ha-1yr-1. Treatment enhances the amount of precipitation during the growing season by 20%
or 40% for the 2NSAcid treatment, which is achieved by spraying twice as frequently, ie. on 100 occasions.
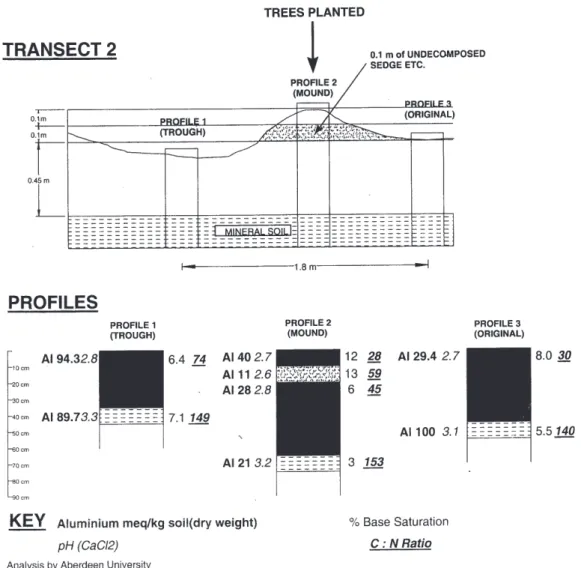
Fig. 1. Effect of ploughing on the soil profile taken at the middle of the Deepsyke forest experimental site in the Scottish borders where the N, S Acid manipulation study was undertaken. The soil is drained, predominantly organic but the profile differs between the ridge, resulting from the upturn of the ploughed material, and the undisturbed area in the middle. Descriptions of the soil pits and the soil chemistry were undertaken by Aberdeen University (M. Cresser and co-workers).
included in all analytical runs for validation.
LITTERFALL
Fallen needles were collected in 1 m2 of guttering, 100 mm
diameter PVC, in a herringbone arrangement across the plot, with a section of guttering under each tree. Gutters were emptied in April before bud burst and again in August. Litter was dried at 30 0C for one to two weeks and weighed. FRUIT BODY RECORDING, ROOT SAMPLING AND ECTOMYCORRHIZA ASSESSMENT
Numbers and species of epigeous, basidiomycete fruit bodies (putative ectomycorrhizal (ECM) and saprophytic fungi) were recorded on 8 August and 5 September 2000. Abundance of Tylospora fibrillosa, the most commonly found fungus, which is fully resupinate, without discrete fruit bodies, was ranked from 06 likewise and is the only one to be reported here. Six soil cores (10 cm diam. by 10 cm depth, 150 cm3) were removed from the central area of each
plot midway between the trees. The roots were removed by pre soaking followed by gentle washing over a series of graded sieves. Roots were assessed by counting root tip numbers, scored on their appearance as live or dead then sorted into ECM and non-mycorrhizal tips. ECM root tips were categorised by their morphological types (Ingleby et
al., 1990). SOIL WATER
In May 1999 ten zero-tension lysimeters (plastic childs spades) per plot were inserted into the side of the mounds beneath the trees and just below the rooting zone, between 10 and 20 cm depth. These spades deflected the soil water via the short cylinder which normally takes the spade handle, through a bag containing the biocide thymol, which also doubled up as a coarse filter, into a 150 ml polyethylene bottle secured over the shaft attachment, which was emptied approximately 10 times per year. Solutions were bulked by plot, weighed to calculate volume, and stored at 4°C until the chemistry was analysed. pH and conductivity were measured before samples were vacuum filtered using a glass fibre pre filter over a 0.20 mm cellulose nitrate membrane filter. Cations, Na+, K+, Ca2+, Mg2+, A13+, Mn2+, Fe3+ were
measured using ICP-OES, NH4-N and PO4-P by Scalar
colorimetry and SO42, NO
3, and C1 using Dionex IC at
CEH Merlewood, where a range of quality control assessments are included within the analyses (Sheppard et
al., 2001).
SOIL CHEMISTRY
pH in CaCl2 and H2O (1:5 vol:vol) was assessed 36 times
per year and 10 times in 2000. In addition, bulk density, loss on ignition (LOI), % total N, P and C on digested samples (Parkinson and Allen, 1975) exchangeable cations and acidity were measured using standard techniques (Allen, 1989) on bulked soil cores: five per plot from the middle undisturbed area between the trees, air-dried, sieved soil cores (6 by 15 cm), taken from below the litter layer in May 2000 .
N2O FLUXES AND EXTRACTABLE NH4+ AND NO3
In 2000, ten measurements of N2O fluxes were made
between January and November using static chambers inserted into the ground. Gas samples were withdrawn from sealed chambers after one hour using a one-litre syringe, decanted into Teflon bags and N2O analysed by ECD gas
chromatography. Soil temperature was measured on each occasion and samples were taken for N analysis and gravimetric water content. Soil samples, taken with a screw auger down to 10 cm below the litter, five per plot, were returned to the laboratory where gravimetric moisture was calculated from the fresh and dry weights. Extractable N was measured on these soil samples which had been stored frozen at 20oC, defrosted immediately prior to extraction
for 30 min in 1M KCl, filtered and the filtrate stored frozen prior to NH4+ and NO3 in the filtratebeingmeasured using
continuous-flow colorimetry at CEH Merlewood.
STATISTICAL ANALYSIS
When the experiment was laid down, tree growth did not vary from plot to plot and, although a gradient in peat depth/ wetness from south-east to north-west was identified, the site had been drained and thus this was not accounted for in the blocking structure (Sheppard et al., 1999). However, after several wet summers, it became obvious that the soil in some plots was very much wetter than in others and that tree growth reflected this. In addition, plots with a deeper layer of peat had a smaller proportion of mineral soil, a prominent factor in some of the plots towards the top of the site. Where the peat was less deep the plough had incorporated pockets of mineral material into the peat. The plots with a lower than average peat depth were thus likely to have more available K a situation further enhanced by the lower potential water holding capacity of soils with a higher mineral content.
An indication of plot mineral to peat ratio was obtained from bulk density (BD) and loss on ignition (LOI) measurements. Since BD and LOI are strongly correlated
with soil moisture, a mean of the 10 soil moisture measurements was taken as the best representation of between-plot variability in soil composition. All the results presented were adjusted to remove the effect of soil heterogeneity using soil moisture as a covariate. The dependence of each variable on the covariate (soil moisture status) was examined, before transforming the variables as appropriate to give the best linear fit to the covariate model. Data were analysed by ANOVA (Genstat V, 1990) using Fishers least significant difference test (P <0.05) to separate the means where the F-test probability was <0.05.
Results
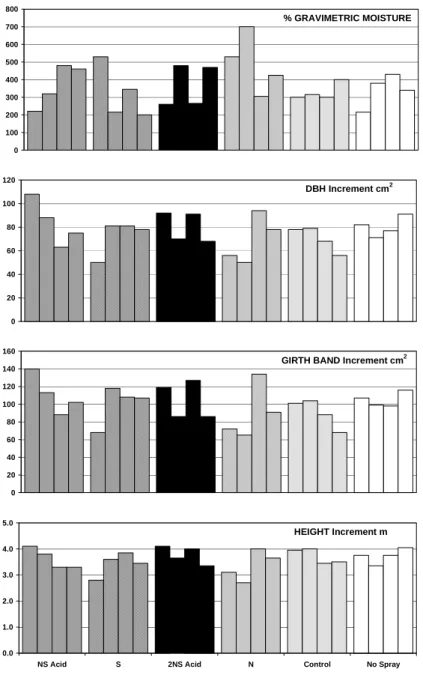
GROWTHBar charts of moisture status and stem area increment (Fig. 2) show how plots with high moisture contents produced the smallest growth increments, irrespective of treatment. Multivariate correlation and regression techniques confirmed that up to 60% of the variation in stem area increment (SAI) across the site could be explained by differences in the proportion of mineral soil and soil moisture, probably mediated by their influence on K availability. Differences in soil mineral content explained 62% of the variability in soil moisture, justifying the use of soil moisture as a covariate to remove the effects of inherent plot variation prior to testing treatment effects.
Over the five years of the experiment, tree heights doubled to between 6.8m (S) and 7.2m (N), but there were no significant treatment effects on height (Table 2, Fig. 3). Stem area at breast height demonstrates the significant positive effect of the additional N and the influence of nutrient manipulation on stem allometry. Stem area increments over five years increased by over 20% compared to controls in response to annual N inputs of 48 kg N ha1, irrespective of
Table 2. Adjusted percent differences in height (m) and stem area
increments (cm2) of Sitka spruce at the girth band (GB) and at
breast height diameter (DBH) relative to the control (+/), after five years of treatment.
Height GB increment DBH increment increment NS Acid +0.3 +25.2* +19.2* S -9.4 +7.1 -1.9 2NS Acid +3.6 +16.1* +16.3 N +0.3 +24.5* +20.7* No Spray +0.3 +15.5 +13.9 *significant P<0.05
Table 3. Nutrient status (% dry wt) in current year foliage of Sitka
spruce in 1995, pre treatment, when the trees had been growing on the site for 9 years, in relation to mean values reported by Innes (1993) for a national UK survey.
Deepsyke range National survey
Nitrogen 1.35 1.43 1.34
Phosphorus 0.16 0.17 0.17
Potassium 0.47 0.56 1.00
Magnesium 0.13 0.15 0.09
Calcium 0.32 0.38 0.32
the addition of acidity (Table 2). After five years, trees in the NSAcid and N treatments were moderate to tall with wide girths whereas S treated trees were short and fat compared with the tall thin control trees. Relative stem area increments (SAI) (values after 5 years compared to the size pre treatment) ranged from 320 to 430%, indicating a near quadrupling in SAI, confirming that the trees were in the exponential growth phase. A comparison of the No Spray versus the spray control shows that the additional 20% precipitation over the period April to November itself was detrimental to growth.
FOLIAR NUTRITION
Pre-treatment nutrient concentrations are reported in Table 3 in relation to the UK mean values reported by Innes (1993). Nutrient levels were judged to be adequate for N, P and Ca but on the low side for K and Mg. Concentrations of foliar nutrients are influenced by needle weight (Linder, 1995). Weights were 1030% higher in current year needles from all treatments in years three and five. The weight of one-year old needles almost doubled over the course of the five years (Crossley et al., 2001). Needle weights were not significantly affected by treatment but tended to be greater in the +N treatments (Crossley et al., 2001).
Over the treatment period, mean foliar N concentrations in current year foliage did not differ significantly between treatments with the exception of the 2NSAcid treatment, which had significantly higher N concentrations, by approximately 20% in three of the five years (Fig. 3). N concentrations were higher, but not significantly, in the N treatments and were maintained between 1.2 and 1.5% except in year 2000 when they were lower in all treatments reflecting the very heavy needles, i.e. starch accumulation that year. By contrast, one-year-old needle concentrations decreased continuously from between 1.25 and 1.35% in year 2 (1997) down to between 0.95 and 1.15% (Fig. 4) indicating the superior sink strength of the current year
0 20 40 60 80 100 120 DBH Increment cm2 0 20 40 60 80 100 120 140 160
GIRTH BAND Increment cm2
0.0 1.0 2.0 3.0 4.0 5.0
NS Acid S 2NS Acid N Control No Spray HEIGHT Increment m
Fig. 2. Percent gravimetric moisture in relation to stem area increment (cm2) at 1.2m, girth band and height for the 24 plots arranged in groups
of 4 replicates for NSAcid, S 2NSAcid, N, wet control and No Spray treatments reading from left to right. Note the greater increments on plots with the lowest mean annual water content.
foliage and that the system could be N limited. The fall in foliar N was apparent even in the N treatments, implying a significant N demand.
In some years, significant treatment effects were observed for foliar K (Fig. 3) with the 2NSAcid and control foliage having the lowest K concentrations. The process of spraying caused significant leaching of K and over the duration of the experiment there was a strong decline in foliar K, irrespective of treatment, to levels below 0.3%. A similar pattern was seen for one year old needles (Fig. 4b) with a halving of K concentrations over five years from 0.30.45% down to 0.20.33%.
Current year P concentrations remained fairly stable irrespective of year or treatment, at between 0.14 and 0.16% (Figs. 3c and 4c). The 2NSAcid treatment had the lowest P concentrations in both age classes of foliage with significantly lower concentrations than the No spray or S treatments, by about 20% in the older foliage.
Mg concentrations were significantly reduced in the NSAcid treatments with the greatest effect in the 2NSAcid treated foliage (Fig. 3d). By contrast trees receiving N alone often had significantly elevated current year Mg status by comparison with controls. No significant effects were seen for one-yr-old foliage (Fig. 4d).
0 100 200 300 400 500 600 700 800 % GRAVIMETRIC MOISTURE
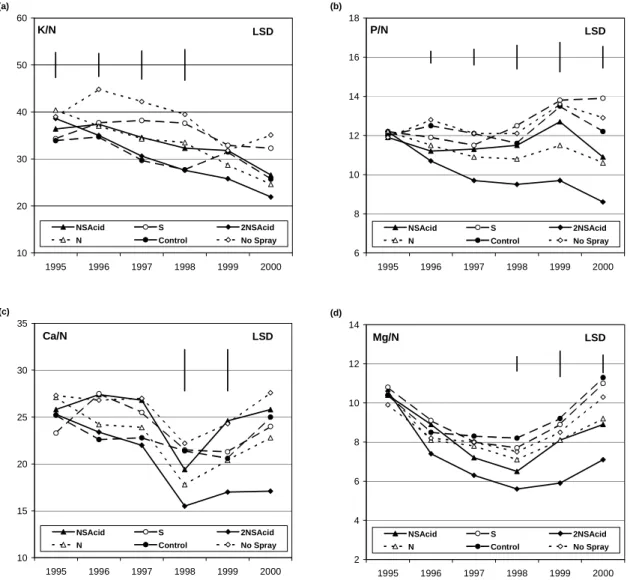
Expressing nutrient concentrations as ratios to N removes the effects of interannual variation in needle weight (Figs. 5 and 6). Foliar K concentrations tended to fall in relation to N concentrations in the treatments that supplied N. By contrast P levels remained stable in relation to N except in the 2NSAcid treatments, suggesting that, in that treatment, P supply was failing to meet growth demands. For the base cations, Ca and Mg, there was a trend for lower ratios in the 2NSAcid treatments partly reflecting the elevated foliar N. Effects with respect to N in the 2NSAcid treatment reflected the accumulation of N.
LITTER PRODUCTION
The litter collectors were installed in 1998 in response to canopy interlocking and the potential for self shading causing needle loss, 12 years after planting as 1 + 1 transplants. Losses were significantly higher among trees treated with NSAcid in a dose response and the N treatment (Table 4). Litter loss was particularly high (65% of the total)
in the final year of treatment, commensurate with the enhanced growth in the year 2000, though more likely reflecting the high level of spruce aphid attack particularly on the 2NSAcid treatment, where the relative increase in litter that year was 4 fold higher than in the other treatments.
FINE ROOT GROWTH
Numbers of root tips present in cores removed in October 2000 showed that the N treatment significantly enhanced root tip numbers (+58%). In addition numbers of live roots were also much greater in the N treatment compared with the NSAcid or S treatments (Table 5). The dominant mycorrhizal fungus, Tylospora, was three times more abundant in the N treatment than in the other treatments. Treatment with NSAcid did not increase the number of root tips infected with Tylospora and relatively more dead roots were present in the acid treatments.
0.08 0.10 0.12 0.14 0.16 0.18 0.20 1995 1996 1997 1998 1999 2000 %P NSAcid S 2NSAcid N Control No Spray (c) 0.70 0.90 1.10 1.30 1.50 1.70 1.90 1995 1996 1997 1998 1999 2000 %N NSAcid S 2NSAcid N Control No Spray LSD (a) 0.00 0.10 0.20 0.30 0.40 0.50 0.60 0.70 0.80 1995 1996 1997 1998 1999 2000 %K NSAcid S 2NSAcid N Control No Spray LSD (b) 0.04 0.06 0.08 0.10 0.12 0.14 0.16 1995 1996 1997 1998 1999 2000 %Mg NSAcid S 2NSAcid N Control No Spray LSD (d)
Fig.3 (a-d). Mean current year foliar nutrient concentrations (% dry wt) in Sitka spruce treated with N S / Acidity. N (a), K (b), P (c) and Mg (d) for years 1995 (pre-treatment) to year 2000. LSDs are given where treatment effects were significant P < 0.05.
0.10 0.20 0.30 0.40 0.50 0.60 1996 1997 1998 1999 2000 %K NSAcid S 2NSAcid N Control No Spray (b) 0.05 0.07 0.09 0.11 0.13 0.15 0.17 1996 1997 1998 1999 2000 %Mg NSAcid S 2NSAcid N Control No Spray (d) 0.06 0.08 0.10 0.12 0.14 0.16 0.18 1996 1997 1998 1999 2000 %P NSAcid S 2NSAcid N Control No Spray LSD (c) 0.80 0.90 1.00 1.10 1.20 1.30 1.40 1.50 1.60 1996 1997 1998 1999 2000 %N NSAcid S 2NSAcid N Control No Spray LSD (a)
Table 4. Treatment effects on mean litter weights (g m2) collected in 1m2 of plastic gutter, in a
herringbone arrangement with one gutter section per tree running from the stem to the centre of the plot and emptied twice a year in April and August.
April19981999 April19992000 April20002001 Total19982001
NSAcid 98b 169ab 478b 746b
S 54cd 81c 241c 376c
2NSAcid 144a 200a 637a 981a
N 78bc 137b 387b 602b Control 64cd 76c 254c 394c No Spray 50d 69c 222c 341c Fpr treat <0.001 <0.001 <0.001 <0.001 LSD 25 50 121 177 CV% 19.4 25.2 20.4 19.2
Differences indicated by Fishers least significant difference test. Values in the same column followed by the same letter are not significantly different P > 0.05.
Fig. 4 (a-d.) Mean one-year-old foliar nutrient concentrations (% dry wt) in Sitka spruce treated with N S / Acidity. N (a), K (b), P (c) and Mg (d) for years 1996 to year 2000. LSD s are given where treatment effects were significant P < 0.05.
SOIL WATER CHEMISTRY
The acidity of the soil water samples at this site ranged from pH 4.3 to 3.7 down to 3.3 in the most acid treatment. Soil water acidity given as the H+ ion concentration was
significantly affected by the presence of acidity in the treatment solution (Table 6). In winter, in the absence of treatment, effects were less pronounced. The addition of NHNO over two years did not acidify the soil water and
10 15 20 25 30 35 1995 1996 1997 1998 1999 2000 Ca/N NSAcid S 2NSAcid N Control No Spray LSD (c) 2 4 6 8 10 12 14 1995 1996 1997 1998 1999 2000 Mg/N NSAcid S 2NSAcid N Control No Spray LSD (d) 6 8 10 12 14 16 18 1995 1996 1997 1998 1999 2000 P/N NSAcid S 2NSAcid N Control No Spray LSD (b) 10 20 30 40 50 60 1995 1996 1997 1998 1999 2000 K/N NSAcid S 2NSAcid N Control No Spray LSD (a)
Fig.5. Nutrient ratios for K, P, Ca and Mg in relation to N (*100) for current year foliage in Sitka spruce treated with N S / Acidity for years 1995 (pre-treatment) to year 2000. LSDs are given where treatment effects were significant P < 0.05.
Table 5. Treatment effects on fine root tips, proportion of live roots and the numbers of tips infected with Tylospora
the dominant fungus, adjusted for plot moisture, after 5 years of treatment.
NSAcid S 2NSAcid N Con. No Spray P value
Total root tips# 1962b 1933b 2234b 3796a 2406b 1914b 0.007
Live root tips# 243b 334b 337b 977a 594ab 374b 0.018
Live/dead ratio 0.14 0.22 0.19 0.36 0.34 0.25 0.158
Tylospora 174b 176b 226b 842a 326b 150b 0.005
#logn+1 and square root transformations were performed on root tip numbers for statistical analysis. Differences indicated by Fishers least significant difference test. Values in the same row followed by the same letter are not significantly different P > 0.05
10 20 30 40 50 1996 1997 1998 1999 2000 K/N NSAcid S 2NSAcid N Control No Spray LSD (a) 6 7 8 9 10 11 12 13 1996 1997 1998 1999 2000 P/N NSAcid S 2NSAcid N Control No Spray (b) 25 30 35 40 45 50 55 60 65 70 75 1996 1997 1998 1999 2000 Ca/N NSAcid S 2NSAcid N Control No Spray LSD (c) 5 7 9 11 13 1996 1997 1998 1999 2000 Mg/N NSAcid S 2NSAcid N Control No Spray LSD (d)
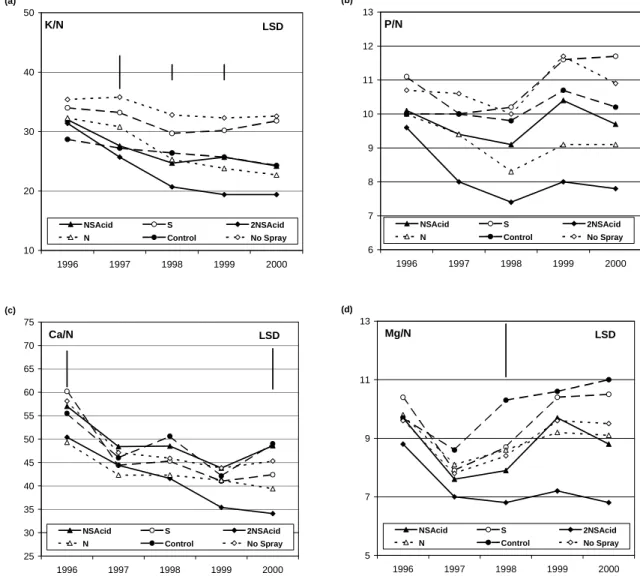
Fig 6. Nutrient ratios for K, P, Ca and Mg in relation to N (*100) for one-year-old foliage in Sitka spruce treated with N S / Acidity for years 1996 to year 2000. LSDs are given where treatment effects were significant P < 0.05.
H+ concentrations were consistently lower in this treatment.
Al3+ concentrations were significantly higher in the 2NSAcid
treatment, as would be predicted from the more acid pH, over the treatment period. Concentrations were low in the other treatments even in the NSAcid, again reflecting pH and the fact that this is a predominantly organic soil with the only source of Al3+ being that of the mineral soil
incorporated with the peat when the site was drained. Soil water NH4+ concentrations were low, <10 mmolc l1 except
where the treatment contained N. However, even then the increases were not dose dependent. Concentrations were always higher in the soil water in the absence of additional H+ ions and were 4 fold higher in the 2NSAcid treatment
(Table 6). In the summer of 1999, coincident with the treatment period, NO3 concentrations were generally higher
than NH4+ concentrations with the exception of the 2NSAcid
treatment.
The presence of SO42 in the soil water was stochastically
treatment dependent, being significantly lower in the absence of treatment and where the treatment did not include S. K+ concentrations were negligible, especially in the N
treatment, ranging between 0 and 40 mmolc l1 and not
treatment sensitive (data not shown). Ca2+ concentrations
were highest in the summer and in the 2NSAcid, NSAcid and N treatments, though not in relation to dose, ranging between 150 and 250 mmolc l1. Likewise for Mg2+, acid
addition increased concentrations but not in response to dose. The N treatment had the lowest concentrations but treatment effects were not significant. Mg 2+ concentrations
ranged between 20 and 60 mmolc l1. Phosphate
concentrations were low, 0-6 mmolc l1 and not sensitive to
Table 7. Mean soil characteristics (not adjusted for covariate)
based on all treatment plots ± SD measured in April 2000 in the undisturbed region between the two lines of trees.
Units Mean Fpr treat.
LOI % 84.2 ± 6.6 0.52 Bulk density (BD) g cm-3 0.2 ± 0.02 0.27 C : N ratio 21.7 ± 1 0.95 Total N % 2.2 ± 0.2 0.65 Total P % 0.12 ± 0.01 0.95 Extractable PO4-P mg/kg 23.2 ± 4.4 0.29 CEC meq/kg120 ± 3 0.92 % K % CEC 1.2 ± 0.5 0.35 % Ca % CEC 14.8 ± 2 0.79 % Mg% CEC 14.6 ± 3 0.07 % A1 % CEC 47.4 ± 7.7 0.33 %H % CEC 13.8 ± 0.8 0.99 Acidity cmolckg12.6 ± 1.4 0.52 SOIL CHEMISTRY
The plots in the experiment were very heterogeneous, both within the plot area and between plots. None of the soil chemical properties assessed in the relatively undisturbed area between the lines of trees, for 010 cm below the undecomposed litter showed significant treatment effects (Table 7).
The soil chemistry was dominated by exchangeable Al3+
(47%) with only very small amounts of K, occupying < 1.2% of the exchange sites compared to 1415% each for Ca and Mg. Interestingly in the N treatment exchangeable Mg occupied 21% of the exchange sites (P=0.07) and foliar Mg concentrations were high in this treatment although soil water Mg2+ concentrations tended to be lower.
N2O FLUX, EXTRACTABLE NO3- AND NH4+ ANDPH
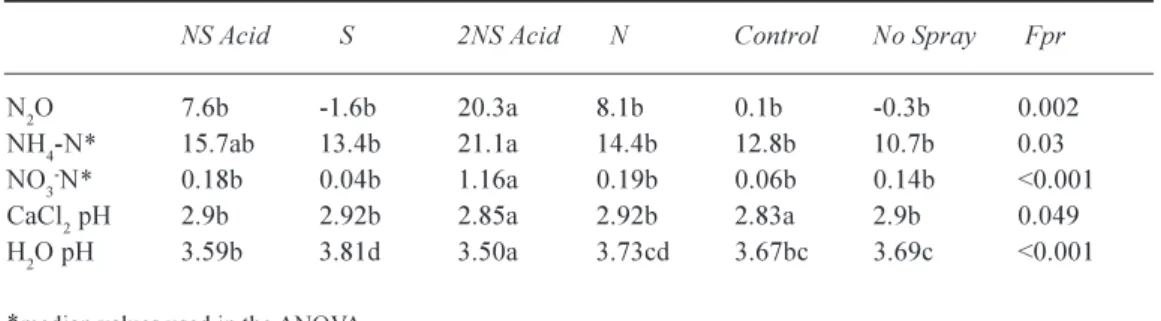
Measurable fluxes of N2O indicate there is sufficient N in
the system to support denitrifying bacteria in addition to the demands of the tree roots. A significant treatment effect was found, with a much larger N2O flux (+21 fold) in the
2NSAcid than in the other treatments (Table 8). N2O fluxes
were enhanced (+8 fold) but not significantly in the N and
NSAcid treatments. Positive N2O fluxes were barely
measurable over the non-treatment period indicating the microbial population was responding to current inputs and
Table 6. Treatment effects on soil water chemistry, (mmolcl) collected from the rooting zone 0-10 cm
by zero tension for the treatment periods 1999 (Spr99), winter 1999 2000, (win9900), treatment 2000 (Spr00) and winter 2000 2001 (win0001), adjusted for soil moisture. Values are only included where significant treatment effects were found. Values in the same row followed by the same letter are not significantly different (P>0.05).
NSAcid S 2NSAcid N Control No spray Fpr
H+ Spr99 124b 65c 286a 19c 75bc 43c <0.001
H+ win9900 126ab 79b 172a 101b 133ab 84b 0.032
H+ Spr00 139b 91bc 222a 61c 105bc 68c <0.001
H+ win0001 329b 153c 492a 126c 200bc 141c <0.001
Al3+ Spr99 27b 20b 95a 22b 7b 16b <0.001
Al3+ win9900 28 22 29 17 19 22 0.165
Al3+ Spr00 18b 19b 44a 17b 13b 15b 0.0130
Al3+ win0001 26b 31ab 46a 20b 19b 29b 0.030
NH4+ Spr99 21b 6b 161a 41b 3b 6b <0.001 NH4+ win9900 8b 6b 21a 11b 7b 7b <0.001 NH4+ Spr00 8c 1c 53a 12b 1c 1c <0.001 NH4+ win0001 11 7 20 15 1 8 0.328 NO3- Spr99 28c 3c 129a 73b 4c 6c <0.001 NO3- win9900 4c 2c 16a 9b 1c 2c <0.001 NO3- Spr00 9b 0b 44a 29a 0b 1b <0.001 NO3- win0001 3c 0c 15a 8b 0c 1c 0.003 SO42- Spr99 354b 505ab 770a 16c 142bc 107bc <0.001
SO42- win9900 127ab 120ab 155a 80b 77b 72b 0.026
SO42- Spr00 252b 325a 408a 35c 73c 60c <0.001
that a large proportion of the added N was being immobilised.
Amounts of KCl extractable NH4+ were high by
comparison with soil water NH4+ concentrations and were
significantly higher (+30%) in the 2NSAcid treatment cf. the control. However, additions of 48 kg N ha1 yr1 (N
treatment) did not significantly increase NH4+ levels.
Amounts of KCI extractable NO3 were small, especially
by comparison with NH4+ by almost 2 orders of magnitude,
only treatment with 2NSAcid significantly increased NO3 -N.
Treatment differences in CaCl2 pH were found, with the
2NSAcid and the control treatments being significantly more acidic. The large difference between pH in CaCl2 and H2O
showed that soil pH was largely determined by exchangeable H+, probably from organic acids, rather than through a
mobile anion effect. pH measurements in water tend to be more sensitive to short-term treatment effects. The treatments were ranked with respect to their H ion input showing 2NSAcid > NSAcid > control, No Spray, N and S (Table 8).
Discussion
The purpose of this study was to manipulate N and acidified S inputs to simulate polluted wet precipitation to a first rotation Sitka spruce forest and monitor the speed of change above and below-ground. The forest was young, pre canopy closure, established on a drained site that had previously been dominated by Molinia and similar moorland grasses. Inputs of 48 kg N and 50 kg S ha1 yr1 in wet deposition for
the UK represent an extremely N polluted site, with the exception of sites within 0.5 km of intensive animal units affected by dry deposition of NH3 (Pitcairn et al., 1998).
Current measurements and modelling of N deposition
indicates most UK forest sites receive <30 kg N ha1 yr1,
although, due to their surface roughness, deposition to forests, especially older forests and forest edges, is considerably higher than to smoother vegetation canopies (Fowler et al., 1989). Over the five years of this experiment, there were no indicators that suggested the annual 48 kg N ha1 treatment input exceeded tree demand, whereas annual
inputs of 96 kg N ha1exceeded the ability of the ecosystem
to immobilise N. In the double dose treatment, indicators of excess N were many; significantly increased current year foliar N concentrations, significantly increased N2O fluxes,
extractable NH4+ and NO3,and soil water NH4+ and NO3.
Changes in soil water NO3 status appeared to reflect
biological activity, nitrification potential and tree demand whereas NH4+ concentrations reflected the availability of
exchange sites. At both inputs, but especially the higher N input, the effect of the additional N was further magnified through its positive impact on N mineralisation.
At this site, the predominantly organic soil (2.2% N) represents a large N reserve (Table 7), approximately 440 g N m-2 based on the top 10 cm being equivalent to 20 kg
soil m2 with a bulk density of 0.2, compared to inputs of
4.8 or 9.6 g m2 of mineral N. However, N mineralisation
rates calculated from soil core experiments in the laboratory and adjusted to a soil temperature of 7.6oC with a Q10 of
1.8 were low at 0.35 g m2 yr1 (R. Rees, pers. comm.),
indicating that N availability could be restricting tree growth. Treatment with 2NSAcid (9.8 g m2yr1), despite the strong
acidity, significantly enhanced mineralisation rates to approximately 3.2 g m2 yr1 compared to 1.2, 0.7 and 0.35
g m2 yr1 in the N, NSAcid and controls respectively. Thus,
in addition to supplying mineral N, the N treatments also increased the availability of the soil organic N. Mineralisation rates calculated in the laboratory have to been seen as very approximate due to the artificial environment.
Table 8. Treatment effects on N2O fluxes (mgN2O m2hr-1), KCl extractable NH4+ - N, NO3- - N (mgNg-1 dry
soil) and pH in water and 10-2 M CaCl
2. Averages of 10 measurements (3 cores per plot) made throughout
the year in 2000. Statistical analysis on transformed data (N2O). Values in the same row followed by the
same letter are not significantly different P>0.05.
NS Acid S 2NS Acid N Control No Spray Fpr
N2O 7.6b -1.6b 20.3a 8.1b 0.1b -0.3b 0.002
NH4-N* 15.7ab 13.4b 21.1a 14.4b 12.8b 10.7b 0.03
NO3-N* 0.18b 0.04b 1.16a 0.19b 0.06b 0.14b <0.001
CaCl2 pH 2.9b 2.92b 2.85a 2.92b 2.83a 2.9b 0.049
H2O pH 3.59b 3.81d 3.50a 3.73cd 3.67bc 3.69c <0.001
However, the low N mineralisation rates are consistent with the growth stimulation in response to N additions. Thus, for this young forest planted on a soil with low mineralisation rates, an increase in N deposition at the current measured inputto UK forests for 33 kg N ha1 yr1 (NEGTAP, 2001),
would appear to be beneficial. How sustainable will be the enhancement will depend on the availability of other nutrients. The 20% N-driven growth enhancement, while consistent with indicators of N availability, did not represent a large or rapid enhancement, taking five years to become significant. N manipulation studies in Europe (Wright and Rasmussen, 1998) and North America, summarised in Aber
et al. (2003), have also shown that tree growth can take up
to eight years to respond to N deposition, except where the stand was strongly N deficient as at Skogaby (Nilsson and Wiklund, 1994).
S emissions have fallen markedly in recent years although reductions in S deposition show non-linearity, with smaller reductions in S deposition further from the source, i.e. in the remote areas where spruce plantations are most widely planted (NEGTAP, 2001). This experiment has shown that the presence of acidified S does modify the impact of NH4NO3, particularly where exchange reactions at the soil
and leaf surface influence adsorption/uptake. In the N alone treatments, up to 50% more NH4-N was absorbed via the
foliage than from the NS Acid (Cape et al., 2001; Chiwa et
al., 2003). Soil water NO3 concentrations were lower in
the presence of acidity possibly due to the restrictive effects of acidity on nitrification (Bengtsson and Bergwall, 2000). Likewise, NH4+ concentrations appeared to be higher in the
soil solution in the acid treatments, suggesting that there may have been competition for exchange sites between H+
ions and NH4+ ions. The high incidence of spruce aphid
attack on the 2 NS Acid treatment, together with data (Stadler
et al., 2001) confirming aphid preference for trees treated
with S, suggests that aphid attacks should be less of a problem for forests in the future if S emissions continue to fall.
The inclusion of acid in the experimental treatments allowed testing of whether increasing soil acidity increases the availability of base cations, as suggested by Tamm and Wiklander (1980). Soil water Ca2+ was increased in
treatments, cf. (Sverdrup et al., 1994; de Vries et al., 1995) that contained NSAcid and N, but there was no dose response and both the NS Acid and N treatments produced similar responses, similarly for Mg2+. Levels of K were too small to
show any significant effects. No effects of any of the treatments were found for exchangeable cations due to the heterogeneity of the soil chemistry, even in the undisturbed central area of the plots, which may have masked any treatment effects. Foliar nutrient ratios, where the effects of
growth dilution and inter-annual differences are removed, did not indicate any positive or negative effects of the acid treatment. Interpreting the 2NSAcid treatment to answer this question is not possible because N accumulated in this treatment, causing the Ca/N and Mg/N ratios to fall. Potassium levels fell irrespective of treatment but there was no evidence that at 0.2% foliar K growth was adversely affected. Except for the K/N ratio, which was considerably below the target 35 quoted for Norway spruce (Thelin, 2000) in the 2NSAcid treatments after 5 years, the target ratios of 25, 4 and 10 for Ca/N, Mg/N and P/N were still acceptable. Irrespective of the low availability of K, manifest as very low levels of foliar K, and the low foliar N, tree growth at this site was rapid, with a projected yield class of 27. Foliar nutrient status at this site was not representative of potential tree growth.
Throughfall studies on these trees demonstrated the high mobility of K+ ions (Cape et al., 2001: Chiwa et al., 2003)
and considerable leaching losses, even with ambient rainfall. The NSAcid treatments especially, along with the N treatment, shed the most needles so it is possible that although actual foliar levels were low there was sufficient K cycling within the system to maintain rapid growth. This would suggest that, particularly in the NSAcid treatment, litter fall provided the trees with a mechanism to improve K supply to meet the extra growth potential made possible by the increase in mineral N from the treatments. The greater litter loss in response to acid inputs as opposed to N alone could offset the restricted ability to forage for nutrients in the acid treatments. In contrast to the NSAcid treatments, fine root growth was significantly enhanced in the N alone treatment, greatly increasing the potential for nutrient uptake. These data suggest that despite their high nutrient demand these young trees, at this stage in their growth, can maintain rapid growth even when their nutrient status is on the low side. Thelin (2000) in his investigations of nutrient imbalance in Norway spruce made a similar observation. He found that young trees had a greater capacity to buffer against nutrient deficiencies than older trees because they were more able to move nutrients to the growing sinks than were older trees. In this context it is interesting to note that in the course of the N manipulation study at Skogaby Sweden, where the trees were 25 years old at the start of the experiment, both the positive and eventually negative effects of N, manifest via micronutrient disorders were much more pronounced (growth was more than doubled) than the responses in the young stand reported here.
The peat soil in this study was already quite acidic and even though acidity increased bringing significant amounts of Al3+ into solution root tip vitality was not compromised.
consistent with the relationship between stem growth of Norway spruce and the soil water (Ca+Mg+K/Al) ratio exceeding 1 (Sverdrup et al., 1994). The results suggest these acid peat systems have considerable buffering capacity and that young stands of Sitka spruce growing on such sites will not be at risk from current levels of wet N deposition. Because of the short duration of most experiments in relation to the life of a forest, systems have to be challenged with larger than realistic doses to show how they might respond in the long-term. This study shows that once biogeochemical cycles are overloaded with N, N increases in tree foliage in relation to other nutrients, occurs in the soil waters and can be emitted as N2O, as was found in the
N manipulation study in Wales where N leakage was measured even with 35 kg N ha-1 yr-1. The problem of N
leaking to streams in response to N deposition is likely to precede detrimental effects on tree growth and may represent a more immediate issue than that of forest sustainability, given that UK spruce forests are commonly P not N limited. However, the loss of accompanying base cations, through the mobile anion effect, may well pose a real issue for second rotation forests depending on the degree of base cation removal when the forest is harvested. Likewise the domination of root tips by the nitrophilous ECM Tylospora may compromise the trees ability to use organic N sources in the future should N deposition decrease. Overall, the ability of forests to immobilise N deposition appears to depend on stand age, N status of the site and the availability of other nutrients, especially in older stands.
Acknowledgements
This project was funded by DEFRA and NERC through UMBRELLA, EPG1/3/94.
References
Aber, J.D., Goodale, C.L., Ollinger, S.V., Smith, M.L., Magill, A.H., Martin, M.E., Hallett, R.A. and Stoddard, J.L., 2003. Is nitrogen deposition altering the nitrogen ststus of Northeastern forests? BioSci., 53, 375389.
Allen, S.E., 1989. Analysis of vegetation and other organic materials. In: Chemical Analysis of ecological material (2nd
edition), S.E. Allen (Ed.). 46-61. Blackwell Science, Oxford, UK.
Barr, C.J., Bunce, R.G.H.., Clarke, R.T. and Fuller et al., 1993. Countryside Survey 1990, Main Report, DOE, HMSO
Publication, 174pp.
Bengtsson, G. and Bergwall, C., 2000. Fate of 15N labelled nitrate
and ammonium in a fertilized forest soil. Soil Biol. Biochem.,
32, 545557.
Cape, J.N., Dunster, A., Crossley, A., Sheppard, L.J. and Harvey, F.J., 2001. Throughfall chemistry in a Sitka spruce plantation in response to six different simulated polluted mist treatments.
Water Air Soil Pollut., 130, 619624.
Carreira, J.A., Harrison, A.F., Sheppard, L.J. and Woods, G., 1997. Reduced P availability in Sitka spruce (Picea sitchensis (Bong)
Carr). Plantation induced by applied acid-mist: significance in
forest decline, Forest Ecol. Manage., 92, 153166.
Chiwa, M., Crossley, A., Sheppard, L.J., Sakugawa, H. and Cape, J.N., 2003. Throughfall chemistry and canopy interactions in a Sitka spruce plantation sprayed with six different simulated polluted mist treatments. Environ. Pollut., 127, 5764. Clymo, R.S., 1983. Peat. In: Ecosystems of the world 4A Mires:
Swamp, bog, fen and moor, A.J.P. Gore (Ed.), Elsevier,
Amsterdam, The Netherlands. 159224.
Crossley, A., Sheppard, L.J., Cape, J.N., Smith, R.I. and Harvey, F.J., 1997. Stem growth reduction in mature Sitka spruce trees exposed to acid mist. Environ. Pollut., 96, 185193.
Crossley, A., Sheppard, L.J., Harvey, F.J., Cape, J.N., Skiba, U., Ingleby, K., Fowler, D. and Coward, P., 2001. Quantifying the effects of atmospheric inputs of N, S and acidity to a ten year-old Sitka spruce plantation in Southern Scotland: Phase Two 1998-2001, Final Report for Defra Project EPG 1/3/94
UMBRELLA.
de Vries, W., van Grinsven, J.J.M., van Breemen, N., Leeters, E.E.J.M. and Jansen, P.C., 1995. Impacts of acid deposition on concentrations and fluxes of solutes in acid sandy forest soils in the Netherlands. Geoderma, 67, 1743.
Emmett, B.A., 1999. The impact of nitrogen on forest soils and feedbacks on tree growth. Water Air Soil Pollut., 116, 6574. Fowler, D., Cape, J.N. and Dunsworth, M.H., 1989. Deposition
of atmospheric pollutants on forests. Phil Trans Roy. Soc., London, B 324, 247265.
Fowler, D., Flechard, C.R., Milford, C., Hargreaves, K.J., Storeton-West, R.L., Nemitz, E. and Sutton, M.A., 1996. Towards
development of a deposition monitoring network for air pollution in Europe. LIFE Report 7221010.
Fowler, D., Donoghue, M.O., Muller, J.B.A., Smith, R.I., Dragosits, U., Skiba, U., Sutton, M.A. and Brimblecombe, P., 2004. A chronology of nitrogen deposition in the UK between 1900 2000. Water Air Soil Pollut., Focus (in press). Foy, C.D., 1974. Effects of Al on plant growth. In: The plant root
and its environment, E.W. Carson (Ed.), University Press of
Virginia, USA. 601642.
GENSTAT V 1990. Reference Manual, Release 2, Oxford Science Publications, Oxford, UK.
Gundersen, P., Emmett, B.A., Kjonas, O.A., Koopmans, C.J. and Tietema, A., 1998. Impact of nitrogen deposition on nitrogen cycling in forests: a synthesis of NITREX data. Forest Ecol.
Manage., 101, 3755.
Ingleby, K., Mason, P.A., Last, F.T. and Fleming, L.V., 1990.
Identification of ectomycorrhizas, ITE Research publication
No.5., Monks Wood, UK. 112pp.
Innes, J.L., 1993. Forest Health: Its Assessment and Status. CAB International, Oxford, UK. ISBN 085198 793 1.
Jentschke, G. and Godbold, D.L., 2000. Metal toxicity and ectomycorrhizas. Physiol. Plant., 109, 107116.
Jönsson, U., Rosengren, U., Thelin, G. and Nihlgård, B., 2003. Acidification-induced chemical changes in coniferous forest soils in southern Sweden 1988-1999. Environ. Pollut., 123, 75 83.
Linder, S., 1995. Foliar analysis for detecting and correcting nutrient imbalances in Norway spruce. Ecol. Bull., 44, 178 190.
McIntosh, R., 1981. Nitrogen deficiency in establishment phase Sitka spruce in Upland Britain. Scot. Forestry, 31, 185193. McIntosh, R., 1983. Fertilizer treatment of Sitka spruce in the
establishment phase in upland Britain. Scot. Forestry, 35, 3 13.
NEGTAP, 2001. Transboundary air pollution: Acidification, Eutrophication and ground-level ozone in the UK. Defra Contract EPG 1/3/153, ISBN 1 870393 61 9
Nilsson, L.-O. and Wiklund, K., 1994. Nitrogen uptake in a Norway spruce stand following ammonium sulphate application, fertilization, irrigation, drought and nitrogen-free fertilization.
Plant Soil, 164, 221229.
Parkinson, J.A. and Allen, S.E., 1975. A wet oxidation procedure for the determination of nitrogen and mineral nutrients in biological material. Commun. Soil Sci. Plant Anal., 6, 111. Pitcairn, C.E.R., Leith, I.D., Sheppard, L.J., Sutton, M.A., Fowler,
D., Munro, R.C., Tang, S. and Wilson, D., 1998. The relationship between nitrogen deposition, species composition and foliar nitrogen concentrations in woodland flora in the vicinity of livestock farms. Environ. Poll., 102, 4148.
Reynolds, B., 1997. Predicting soil acidification trends at Plynlimon using the SAFE model. Hydrol. Earth Syst. Sci., 1, 717728.
Sheppard, L.J. and Crossley, A., 2000. Responses of a Sitka Spruce Ecosystem after 4 years of Simulated Wet N Deposition: Effects of NH4NO3 Supplied with and without Acidity (H2SO4 pH 2.5).
Phyton, 40, 169174.
Sheppard, L.J., Crossley, A., Cape, J.N., Harvey, F., Parrington, J. and White, C., 1999. Early Effects of Acid Mist on Sitka Spruce Planted on Acid Peat. Phyton, 39, 125.
Sheppard, L.J., Crossley, A., Parrington, J., Harvey, F.J. and Cape, J.N., 2001. Effects of simulated acid mist on a Sitka spruce forest approaching canopy closure: significance of acidified versus non-acidified nitrogen inputs. Water Air Soil Pollut., 130, 953958.
Stjernquist, I. and Selldén, G., 2002. Forest vitality and stress implications. In: Developing principles and models for
sustainable forestry in Sweden, H. Sverdrup, and I. Stjernquist,
(Eds.), Kluwer, Dordrecht, The Netherlands. 197271. Sverdrup, H., Warfvinge, P. and Nihlgård, B., 1994. Assessment
of soil acidification effects on forest growth in Sweden. Water
Air Soil Pollut., 78, 136.
Thelin, G., 2000. Nutrient imbalance in Norway spruce. Dissertation, Lund University, Sweden.