HAL Id: hal-00297529
https://hal.archives-ouvertes.fr/hal-00297529
Submitted on 15 Nov 2005
HAL is a multi-disciplinary open access
archive for the deposit and dissemination of
sci-entific research documents, whether they are
pub-lished or not. The documents may come from
teaching and research institutions in France or
abroad, or from public or private research centers.
L’archive ouverte pluridisciplinaire HAL, est
destinée au dépôt et à la diffusion de documents
scientifiques de niveau recherche, publiés ou non,
émanant des établissements d’enseignement et de
recherche français ou étrangers, des laboratoires
publics ou privés.
Controls of the surface water partial pressure of CO2 in
the North Sea
H. Thomas, Yves Bozec, K. Elkalay, H. J. W. de Baar, A. V. Borges, L.-S.
Schiettecatte
To cite this version:
H. Thomas, Yves Bozec, K. Elkalay, H. J. W. de Baar, A. V. Borges, et al.. Controls of the surface
water partial pressure of CO2 in the North Sea. Biogeosciences, European Geosciences Union, 2005,
2 (4), pp.323-334. �hal-00297529�
Biogeosciences, 2, 323–334, 2005 www.biogeosciences.net/bg/2/323/ SRef-ID: 1726-4189/bg/2005-2-323 European Geosciences Union
Biogeosciences
Controls of the surface water partial pressure of
CO
2
in the North Sea
H. Thomas1, Y. Bozec2, K. Elkalay2, H. J. W. de Baar2, A. V. Borges3, and L.-S. Schiettecatte3
1Canada Res. Chair, Dalhousie Univ., Dept. of Oceanography, 1355 Oxford Street, Halifax, Nova Scotia, B3H 4J1, Canada 2Royal Netherlands Inst. for Sea Res. (NIOZ), Dept. of Carbon Chemistry, P.O. Box 59, Den Burg, Texel, The Netherlands 3Univ. of Li`ege, Interfacultary Center for Marine Res. (MARE), Chemical Oceanography Unit, B-4000 SartTilman, Belgium
Received: 30 May 2005 – Published in Biogeosciences Discussions: 4 July 2005
Revised: 12 October 2005 – Accepted: 31 October 2005 – Published: 15 November 2005
Abstract. The seasonal variability of the partial pressure of CO2 (pCO2) has been investigated in the North Sea, a
northwest European shelf sea. Based on a seasonal and high spatial resolution data set the main controlling factors – bio-logical processes and temperature - have been identified and quantified. In the central and northern parts being a CO2
-sink all year round, the biological control dominates the tem-perature control. In the southern part, the temtem-perature con-trol dominates the biological concon-trol at an annual scale, since the shallow water column prevents stronger net-CO2removal
from the surface layer due to the absence of seasonal strat-ification. The consequence is a reversal of the CO2
sea-to-air flux during the spring bloom period, the only time, when CO2 is taken up from the atmosphere in the
south-ern region. Net community production in the mixed layer has been estimated to 4 mol C m−2yr−1with higher values (4.3 mol C m−2yr−1)in the northern part and lower values in the southern part (2.6 mol C m−2yr−1).
1 Introduction
During the recent years many research efforts have been de-voted to the understanding and quantification of the ocean carbon cycle, which plays a key role in the global carbon cy-cle and thus in controlling climate on earth (IPCC, 2001). The world ocean and the atmosphere have been identified as the major sinks for anthropogenic CO2, while the role
of the terrestrial biosphere remains uncertain (IPCC, 2001; Sarmiento and Gruber, 2002). Part of this uncertainty can be attributed to the uncertainty in the assessment of the ocean sink for anthropogenic CO2. Recent studies however seem
Correspondence to: H. Thomas ([email protected])
to suggest that the ocean and the atmosphere entirely share the storage of the anthropogenic CO2, while the terrestrial
biosphere seems to play a neutral role (Thomas et al., 2001; Sabine et al., 2004). Sabine et al. (2004) relied their ob-servational approach on a global data set, obtained in the framework of large national and international research efforts during the past decade such as the World Ocean Circulation Experiment (WOCE) or the Joint Global Ocean Flux Study (JGOFS). Complementarily to this refinement of the open ocean assessment intense research campaigns have been ini-tiated during the last years in the coastal oceans, of which carbon cycle was investigated only barely before. Carbon fluxes have been investigated in several coastal regions (Liu et al., 2000a, b; Chen et al., 2003). In order to achieve an integrative global assessment, the available information yet appears to be too sparse and more site studies are required (Borges, 2005; Borges et al., 2005).
Coastal and marginal seas host a disproportionately large fraction of ocean productivity, in part fueled by terrestrial, anthropogenic or oceanic nutrient inputs. Coastal seas con-stitute the major link between the terrestrial and the open ocean environments and buffer terrestrial impacts before af-fecting the oceanic systems. The high biological activity causes high CO2 fluxes between coastal ocean and
atmo-sphere and the open ocean, respectively. Depending on the hydrodynamic and topographic conditions the biologically initiated CO2-drawdown might finally supply the continental
shelf pump (Tsunogai et al., 1999), a mechanism transferring atmospheric CO2into the open ocean exploiting biological
metabolism of coastal seas. For example, the continental shelf pump seems to be very efficient in the East China Sea (Tsunogai et al., 1999) or the North Sea (Thomas et al., 2004), while in the Baltic Sea it works less efficiently (Thomas et al., 2003, 2005).
324 H. Thomas et al.: pCO2in the North Sea
The North Sea has been subject to intense investigations for the last decades and the foundation for carbon cycle in-vestigations here was probably laid in the late 1980s by a basin-wide study (Pegler and Kempe, 1988; Kempe and Pe-gler, 1991). A variety of rather regional or local studies have been conducted in the following years (e.g. Bakker et al., 1996; Frankignoulle et al., 1996; Borges and Frankig-noulle, 1999, 2002, 2003; Frankignoulle and Borges, 2001) most notably providing insight in near shore carbon and CO2
fluxes. Recently a basin-wide field study has been carried out focusing on the understanding and quantification of internal and cross-boundary carbon (and related nutrient) fluxes in the North Sea. First investigations balanced the CO2
air-sea fluxes, investigated the functioning of the continental shelf pump at a seasonal scale (Thomas et al., 2004; Bozec et al., 2005a) or reported on an initial 1-box carbon budget (Thomas et al., 2005). The North Sea has been shown to act as a sink for atmospheric CO2, most of which is exported
to the North Atlantic Ocean. In detail, the smaller southern part releases CO2to the atmosphere (−0.2 mol C m−2yr−1),
while the northern areas absorb CO2(1.7 mol C m−2yr−1).
Here, we investigate the variability of the partial pres-sure of CO2(pCO2)in detail, which governs the CO2
air-sea fluxes. Temperature effects will be unraveled from the biological processes controlling the pCO2applying the
ap-proach proposed by Takahashi et al. (2002). The conse-quences for the seasonal variability of the CO2air-sea fluxes
are discussed. Finally, an estimate of the corresponding bio-logical CO2draw-down, which is a measure for net
commu-nity production (NCP), will be provided.
2 Material and methods
2.1 Data
The data have been obtained during 4 cruises in the North Sea covering all seasons in a consecutive order (18.8.2001– 13.9.2001, 6.11.2001–29.11.2001, 11.2.2002–5.3.2002 and 6.5.2002–26.5.2002). The pCO2has been determined
con-tinuously in one-minute intervals from the surface waters using a continuous flow system as described by K¨ortzinger et al. (1996). The water was pumped from approximately 3m below the sea surface at a rate of 60 L min−1. The main water flow through the equilibrator was 2–3 L min−1 and the difference between in-situ and equilibrator temper-ature was typically less than 0.5◦C. The atmospheric pCO
2
has been determined every 2 h and the system was calibrated against standards provided by the National Oceanic and At-mospheric Administration (NOAA). Temperature and salin-ity have been determined continuously from the surface wa-ter in one-minute inwa-tervals. From 97 stations per cruise, dis-solved inorganic carbon (DIC) and total alkalinity (AT) have
been determined using the coulometric method according to Johnson et al. (1993) and a Gran potentiometric open cell
titration, respectively. The DIC measurements were cali-brated against certified reference material provided by Prof. Dickson, Scripps Institution of Oceanography, La Jolla, CA, USA. The uncertainty of the DIC is 1–2 µmol kg−1. The un-certainty of ATwas determined to 2–3 µmol kg−1.
2.2 Calculations
2.2.1 Temperature vs. biological control
In order to identify and quantify the main factors control-ling the variability of pCO2 in the North Sea, we applied
the calculation scheme proposed by Takahashi et al. (2002), which assumes the pCO2to be controlled solely by
temper-ature and biological CO2drawdown. Other processes
gov-erning to pCO2such as changes in AT, riverine inputs,
sed-iment/water column interaction and the air-sea exchange of CO2are neglected by this procedure and are attributed
inher-ently to the biological signal. Accordingly, the temperature and biological signals can be unraveled using the observed pCO2and temperature data. In brief, the temperature effect
can be removed by normalizing all pCO2data to an average
temperature for all seasons:
pCO2 at Tmean=pCO2 at Tobs∗exp[0.0423(Tmean−Tobs)],(1)
where Tmeanis the mean annual temperature and Tobsis the
in-situ temperature at the time and location of the observa-tion. The remaining variability of the pCO2 is then
con-trolled by the variations of DIC, assuming a constant AT. The
temperature signal can be obtained from the average annual pCO2and the difference between Tobsand Tmean:
pCO2 at Tobs=annual mean pCO2∗exp[0.0423(Tobs−Tmean)].
(2) The changes in the pCO2related to biological (1pCO2, bio)
and to temperature (1pCO2, temp)effects, respectively,
fol-low then as:
1pCO2, bio=(pCO2at Tmean)max−(pCO2at Tmean)min, (3)
1pCO2, temp=(pCO2at Tobs)max−(pCO2 at Tobs)min, (4)
with the subscripts “max” and “min” indicating the annual maximum and minimum values.
In order to compare the magnitude of both temperature (T) and biological effects (B) either the ratio or the difference of the expressions 1pCO2, bioand 1pCO2, tempcan be applied:
T−B=(1pCO2, temp)−(1pCO2, bio) (5a)
T/B=(1pCO2, temp)/(1pCO2, bio) (5b)
In areas with high seasonal variability of the biological ac-tivity the ratio (T/B) would be less than 1 or the difference (T–B) negative. In regions with weaker or annually rather constant biology, the (T/B) ratio would be larger than one or the difference positive, respectively.
H. Thomas et al.: pCO2in the North Sea 325
a)
b)
c)
d)
Thomas et al., Control of..., subm. to Biogeosciences
Figure 1
= May
= Aug.
= Feb.
= Nov.
a)
b)
c)
d)
Thomas et al., Control of..., subm. to Biogeosciences
Figure 1
= May
= Aug.
= Feb.
= Nov.
Fig. 1. Seasonal variability of the relationship between different surface water properties. (a) partial pressure of CO2(pCO2)vs. Temperature. (b) Total alkalinity (AT) vs. pCO2. (c) ATvs. dissolved inorganic carbon (DIC). (c) DIC vs. pCO2. The green stars indicate February
(winter) data, the purple triangles May (spring) data, the black crosses the August (summer) data and the blue circle November (autumn)
data, respectively. See inset in (b). The colors apply also to a) with the lighter colors indicating data south of 54◦N and the darker colors
data north of 54◦N, respectively. All data have been projected onto the same grid.
2.2.2 Biological DIC uptake (net community production)
The above 1pCO2, biocan be employed for the determination
of the biological DIC uptake, i.e., the Net Community Pro-duction (NCP). Recently a procedure has been implemented to calculate any change in DIC as a function of a change in the pCO2 and temperature and salinity (Thomas and
It-tekkot, 2001; Thomas et al., 2001). This procedure, origi-nally proposed for the determination of anthropogenic CO2
in the water column, is applied for the present purposes to ob-tain the biological DIC drawdown (1DICbio)as a function of
1pCO2, bio, salinity (S) and temperature (T, in◦C):
1DICbio=−199.6 + 0.89 ∗ S + 0.42 ∗ T + 0.6 ∗ (1pCO2, bio+276.8)
326 H. Thomas et al.: pCO2in the North Sea
Figure 2
Thomas et al., Control of..., subm. to Biogeosciences
= May
= Aug.
= Feb.
= Nov.
Fig. 2. pCO2values normalized to the average temperature of all
observations (11.05◦C) shown as function of their observational
temperature. The lines indicate the observational, i.e., not
nor-malized pCO2 values at that temperature. The bold line shows
the averaged observed pCO2for the temperature range 11.045◦C–
11.055◦C, with the dotted lines showing the corresponding
maxi-mum and minimaxi-mum values of that range, respectively. The remain-ing variability is attributed to biological changes.
(6) For the calculations, an average salinity of 34 was assumed. In order to assess the corresponding NCP, an average depth of the mixed layer of 30 m was assumed. 1pCO2, biois
ob-tained as the difference between the maximum and minimum pCO2at the annual mean temperature (3). The corresponding
1DICbio(6) allows us to compute NCP during the productive
period February to August.
3 Results
3.1 Surface properties
The surface water properties of the North Sea (Fig. 1) during winter show a relatively homogenous behavior. The pCO2
versus temperature relationship (Fig. 1a) reveals pCO2
val-ues between 360 µ atm and 400 µ atm throughout the entire North Sea. The temperatures range between 5◦C and 10◦C with slightly higher temperatures in the southern region of the North Sea. AT (Fig. 1b, c) shows homogenous
behav-ior throughout the full annual cycle and only minor changes can be identified during spring, most likely as a consequence of fresh water inputs. In contrast, DIC shows a clear sea-sonal signal with highest values in winter and lowest values in summer (Fig. 1c, d). It is obvious that DIC undergoes
much more severe seasonal variations than AT. Clearly, the
maximum DIC draw-down is observed in summer, this in contrast to pCO2 that shows minimal values during spring
(Fig. 1a, d). The most pronounced seasonal and also regional signals can be observed in the pCO2distributions with
high-est values during summer in the southern region (Fig. 1a, d) and lowest values in May throughout the North Sea. During all seasons the southern region shows higher pCO2 values
than the northern and central parts, and in summer opposing directions of the CO2air-sea flux are observed.
3.2 Biological versus temperature controls
In order to give a brief overview, on how the method works, we compare the pCO2values observed at the mean
temper-ature with the values corrected to the mean tempertemper-ature. In Fig. 2 the average pCO2 (339 µ atm) observed at the mean
temperature (11.05oC) is shown as well as the observed max-imum (387 µ atm) and minmax-imum (233 µ atm) at that temper-ature. The deviation from the average here can be seen as the variability of the biological effects on the pCO2 at
(unrected) mean temperature observations. Applying the cor-rection according to (1) to all data then provides the variabil-ity of the biological effects for all seasons. Obviously the autumn and notably the winter data show an increase of the pCO2because of DIC release to the water column by
rem-ineralization processes, while the spring and summer values show decreased pCO2values as a consequence of biological
DIC uptake, i.e., production of organic matter. The max-imum values up to 330 µ atm of the biologically induced pCO2 changes (1pCO2, bio), which reflects the net signal
from production and respiration processes, are observed in the northern and central parts of the North Sea (Fig. 3a). Weaker effects of 1pCO2, bio are observed in the southern
part. The shallow (Fig. 3c), well mixed water column does not allow the spatial separation of organic carbon production in the surface waters from the degradation of organic carbon in the bottom waters that occurs in the stratified northern and central regions. The net biological signal is stronger in the northern region than in the southern region. The North-Sea-wide average biological CO2draw-down (1pCO2, bio)is
ap-proximately 160 µ atm indicating the North Sea as a highly productive area. This value is within the range observed in open oceanic waters from 50 µ atm in the oligotrophic ar-eas of the subtropics and tropics to 280 µ atm in the highly productive upwelling regions of the Eastern equatorial Pa-cific (Takahashi et al., 2002). Temperature (Fig. 3b) shows a stronger control on pCO2 in the southern and coastal, i.e.,
shallower regions. The shallow water column warms up faster and furthermore is not affected by the continuous in-puts of large quantities of colder water from the North At-lantic Ocean (Thomas et al., 2005). Temperature increases the pCO2in the northern region by approximately 100 µ atm,
while in the south an increase of 200 µ atm can be observed. The basin-wide maximum is approximately 200 µ atm with
H. Thomas et al.: pCO2in the North Sea 327
Figure 3
Thomas et al., Control of..., subm. to Biogeosciences
a)
b)
c)
Fig. 3. Maximum changes in 1pCO2, bio(a) and 1pCO2, temp(b) calculated according to Takahashi et al. (2002). (c) Bottom topography
of the North Sea using the ETOPO2 data set (National Geophysical Data Center: www.ngdc.noaa.gov). The grid structure is according to Thomas et al. (2004).
an average of 130 µ atm. This value is above the average of 80 µ atm observed in the open ocean at mid-latitudes, where maximum values of 220 µ atm are only observed in the confluence areas of the warm Kuroshio with the cold Oy-ashio current waters in the northwestern Pacific and of the warm Gulf Stream with the cold Labrador Current waters in the northwestern Atlantic (Takahashi et al., 2002).
A more detailed analysis allows us to identify and quan-tify the relevant regional features characterizing the CO2
sys-tem in the North Sea. Three key areas are discussed: the deeper northern part of the North Sea (Fig. 4a), the central part (Fig. 4b), which still is stratified during summer, and the shallow continuously mixed southern part (Fig. 4c).
The northern region (Fig. 4a) shows the weakest temper-ature control, which is out competed by the biological CO2
draw-down: 60 µ atm vs. −150 µ atm, respectively. The an-nual cycle reveals lowest values in spring and summer, as expected for a high latitude sea. The opposite situation is found for the southern region, where the overall system ap-pears to be temperature controlled with an observed pCO2
maximum in summer (pCO2, tempup to 135 µ atm, pCO2, bio
max: −100 µ atm). Only during a very short period in spring the biological control dominates and causes a net reduction of the pCO2 compared to the winter values. The highest
seasonal pCO2amplitude in the North Sea, observed in the
central region, is generated by a synergistic coincidence of a somewhat lower temperature control compared to the south-ern region and of the presence of a thermocline, which per-mits the remineralization of the freshly produced and sunken organic matter below the surface layer. In the central region, the more rapid temperature rise during spring induces an
ear-lier establishment of the thermocline and thus a longer ex-port pathway for the newly produced organic matter out of the surface layer leading to a higher biological signal com-pared to the northern region. The consequence is that the biological control is highest in the central region, while it is somewhat weaker in the northern areas, since the export of organic matter out of the surface layer is reduced com-pared to the central part because of the later onset of primary production and of the later rise of the thermocline. The strat-ification prevents the remineralization of the organic matter in the surface layer, which is the primary condition for the development of the biological net CO2 drawdown over the
entire productive period. This contrasted behavior is clearly visible by the summer maxima of 1pCO2, bio in the
north-ern and central region, since the stratification maintains the “accumulation” of the CO2drawdown until production
de-ceases in later summer. In contrast, the absence of strati-fication in the south prevents this “accumulation”, showing the strongest 1pCO2, bio only at its peak period during the
bloom as compared to the other regions with the strongest
1pCO2, bio at the accumulated maximum of the drawdown
in late summer.
The consequences of the different controls on the CO2
air-sea fluxes become evident when considering the air-seasonally resolved fluxes (Fig. 5). During winter (Fig. 5a) the North Sea appears to be a rather equilibrated system with regard to the CO2 fluxes. With the onset of the spring bloom,
all areas act as sinks for atmospheric CO2, even the
shal-lower southern part, where the biological control out com-petes the temperature control as indicated in Fig. 4c. In summer, the central and northern parts continue absorbing
328 H. Thomas et al.: pCO2in the North Sea
Figure 4
Thomas et al., Control of..., subm. to Biogeosciences
ΔpCO2, temp. ΔpCO2, bio. ΔpCO2, obs. ΔpCO2, temp. ΔpCO2, bio. ΔpCO2, obs. ΔpCO2, temp. ΔpCO2, bio. ΔpCO2, obs.
(a)
(b)
(c)
Fig. 4. Biological, temperature and observed 1pCO2 signals
for three different regions of the North Sea: (a) 60◦N 1◦E, (b)
56◦1◦E, and (c) 54◦N 3◦E. The data are shown as difference to
February.
CO2 from the atmosphere, but the increasing temperature
and the remineralization of organic matter cause a flux rever-sal in the southern part that then emits CO2to the atmosphere
(Fig. 5c). In autumn (Fig. 5d), primary production deceases in the North Sea enhancing the CO2release in the southern
area; the northern area remains undersaturated, since the or-ganic matter has been remineralized in bottom waters that are advected to the North Atlantic Ocean, which is subjected to water mass exchange with the Atlantic Ocean (Thomas et al., 2004). The decreasing temperature (Fig. 4a, b) and the weaker return of DIC into the surface layer due to destratifi-cation maintain the absorption of atmospheric CO2.
At an annual scale, the ratio between the maximum ef-fects of temperature and biological activities or their respec-tive difference indicate, which of the two processes is domi-nant (Fig. 6a, b). The southern part is clearly dominated by the temperature effects with an increase of pCO2in summer,
while the northern part is clearly dominated by the biological processes with a summer decrease of pCO2typical for mid
and high latitude waters.
3.3 1DICbioand Net community production
The biological CO2 drawdown (1DICbio), which has been
computed from Eqs. (3) and (6), shows North-Sea-wide average of 100 µmol kg−1. The maximum values of 200 µmol kg−1 1DICbio have been obtained for the
Ger-man Bight area and the minimum values of 45 µmol kg−1
1DICbio for the southern North Sea. The regional
gradi-ent of 1DICbio with high values in the central part, lower
values in the northern part and lowest values in the south-ern part have already been discussed before (Fig. 4). As-suming a 30 m depth of the mixed layer, NCP amounts to 2.9 mol C m−2yr−1from February to August with higher values in the northern areas than in the southern area (Ta-ble 1). Since the air-sea exchange of CO2also alters pCO2
values next to the temperature and biological effects, the CO2 uptake by the North Sea during the productive
pe-riod needs to be considered. The CO2 air-sea fluxes for
the period from February to August have been taken from Thomas et al. (2004) in order to establish a corrected term for NCP (NCPcorr). NCPcorr in the mixed layer amounts to
4 mol C m−2yr−1in the whole North Sea during the produc-tive period, with values of 4.3 mol C m−2yr−1in the north-ern area and 2.6 mol C m−2yr−1in the southern area, respec-tively.
4 Discussion and summary
4.1 Methodological aspects
Obviously, the procedure by Takahashi et al. (2002), which has been developed to unravel the variability of the pCO2in
open ocean regimes, attributes all non-temperature changes to biological processes. Several processes have been ignored
H. Thomas et al.: pCO2in the North Sea 329
Aug.
Feb.
Nov.
May
Thomas et al., Control of..., subm. to Biogeosciences
Figure 5
(a)
c)
d)
Thomas et al., Control of..., subm. to Biogeosciences
Figure 5
(b)
c)
d)
Aug.
Feb.
Nov.
May
Thomas et al., Control of..., subm. to Biogeosciences
Figure 5
a)
b)
(c)
Thomas et al., Control of..., subm. to Biogeosciences
Figure 5
a)
b)
(d)
Fig. 5. Seasonal variability of the CO2air-sea fluxes. The monthly fluxes are taken from Thomas et al. (2004) and are shown for the months
February (a), May (b), August (c) and November (d). The “zero” contour line has been indicated. The same color scale has been applied to all plots. The grid structure is according to Thomas et al. (2004).
330 H. Thomas et al.: pCO2in the North Sea
Figure 6
Thomas et al., Control of..., subm. to Biogeosciences
(a)
(b)
Fig. 6. Biological vs. temperature control of the pCO2. (a) shows (T–B) and (b) shows (T/B) according to Fig. 3. The “0” (a) and “1” (b)
contour lines are indicated, respectively, where both controls balance each other. The grid structure is according to Thomas et al. (2004).
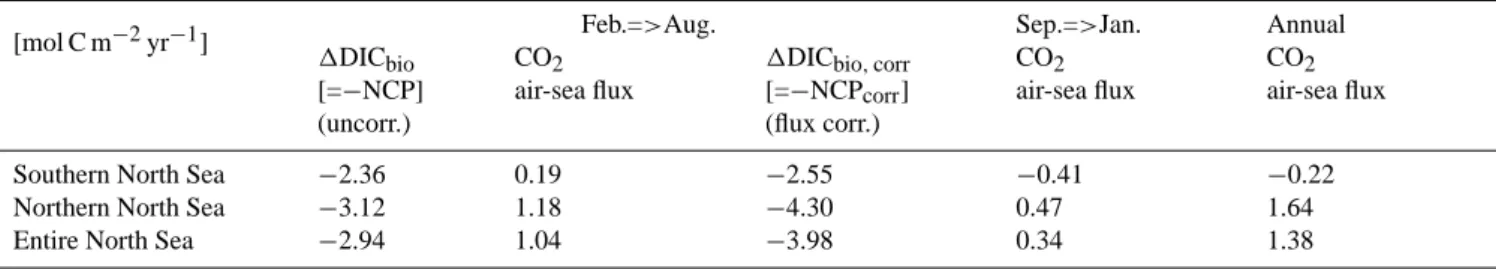
Table 1. Seasonal and annual CO2air-sea fluxes, and net community production (NCP, in mol C m−2yr−1)from February until August
in the North Sea. Positive values indicate a flux into the marine area, i.e., an increase of the DIC pool. NCPcorrdenotes the NCP, which
has been corrected for the CO2air-sea flux. See text for details. 1DICbioand 1DICbio, corr represent the DIC loss because of biological
activity, i.e., NCP. Negative 1DICbiocorresponds to positive NCP. For convenience, also the air-sea fluxes for the autumn period and the
entire year have been given. The grid structure is according to Thomas et al. (2004): The Southern North Sea comprises the grid boxes 2–4, the Northern North Sea the grid boxes 5–13 and the entire North Sea grid boxes 2–13, respectively.
[mol C m−2yr−1] Feb.=>Aug. Sep.=>Jan. Annual
1DICbio CO2 1DICbio, corr CO2 CO2
[=−NCP] air-sea flux [=−NCPcorr] air-sea flux air-sea flux
(uncorr.) (flux corr.)
Southern North Sea Northern North Sea Entire North Sea
−2.36 −3.12 −2.94 0.19 1.18 1.04 −2.55 −4.30 −3.98 −0.41 0.47 0.34 −0.22 1.64 1.38
by this attribution, notably the air-sea exchange of CO2. The
consideration of this process, intimately related to the biolog-ical DIC uptake, requires the consideration of factors such as wind speed and temporal development of the biological DIC uptake and brought this rather straight forward approach closer to a modeling approach. In awareness of this compli-cation, we have considered the CO2air-sea fluxes reported
by Thomas et al. (2004) in order to correct the later es-timate of NCP (Table 1). This correction in turn can also be used to show the contribution of the CO2air-sea flux to
the variability of the pCO2, at least on a seasonal time scale.
Accordingly, in the North Sea the CO2air-sea flux
substan-tially counteracts the 1DICbio by 10–30%, which implies
that these fluxes need to be considered in order to achieve a reliable estimate of NCP when applying the Takahashi et al. (2002) approach. The good agreement with the indepen-dent assessment of NCP by Bozec et al. (2005b)1support the results presented here.
1Bozec, Y., Thomas, H., Schiettecatte, L.-S., Borges, A. V.,
El-kalay, K., and de Baar, H.: Assessment of the processes controlling the seasonal variations of dissolved inorganic carbon in the North Sea, Limnol. Oceanogr., under revision, 2005b.
H. Thomas et al.: pCO2in the North Sea 331
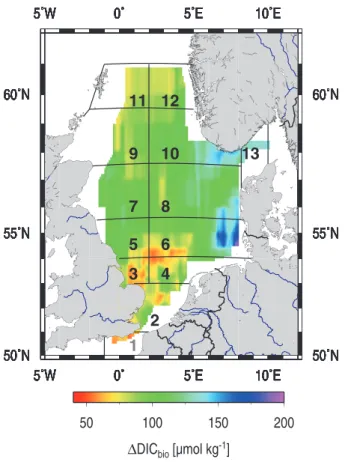
Figure 7
Thomas et al., Control of..., subm. to Biogeosciences
Fig. 7. Biological DIC uptake (1DICbio)calculated from Fig. 3a
according to Thomas et al. (2001). An average salinity of 34 and an average water column depth of 30 m were used for the calculations. The grid structure is according to Thomas et al. (2004).
Our approach here relies on the assumption that the ob-served field data cover the maximum amplitudes of the sea-sonal variations both in temperature and pCO2. Our
stud-ies here relstud-ies on a data set with seasonal resolution, which was designed to cover both maximum amplitudes, which can be assumed to occur for temperature between winter and summer (February and August) and for pCO2between
February and August or February and May, respectively. In highly variable system such as coastal systems, however it might be possible that on smaller spatial scales the pCO2
minimum occurs at a different time. If this was the case, our approach was subject to some uncertainty. However, in basinwide studies, which show higher spatial variability, this problem is hardly to solve unless one would increase tempo-ral coverage of a smaller region at the expense of the spatial coverage of the overall study.
Moreover, for the North Sea as a coastal area further pro-cesses such as inputs from rivers or the Baltic Sea, advec-tion of water masses and interacadvec-tions with the sediment are partly responsible for the variability of the pCO2. These
processes have been investigated for example by Thomas et al. (2005) and Bozec et al. (2005a), however their
consider-Figure 8
Thomas et al., Control of..., subm. to Biogeosciences
Fig. 8. Difference between the seasonal pCO2 variations (pCO2, Feb–pCO2, Aug)from observations and the calculated
ac-cording to Eqs. (3) and (4): (1pCO2, temp−1pCO2, bio) for the
period from February to August.
ation requires further information, mainly on the hydrody-namics. We have chosen here to apply the rather straightfor-ward approach of Takahashi et al. (2002), which considers rather static snapshots of the North Sea. Obviously, above processes, which have been ignored here, contribute to the variability of pCO2, notably for near coast and the southern
areas. These considerations also hold true for the assessment of the NCP, which might be seen as a lower bound, since ad-ditional carbon sources besides the atmosphere (e.g. rivers) have not been taken into account. In order to provide an es-timate of the uncertainty related to the neglect of the above mentioned processes, the seasonal pCO2difference between
February and August from observation has been compared with that from the calculations according to Eqs. (3) and (4) (Fig. 8). The difference between both provides a quantitative estimate of the corresponding uncertainty. The average dif-ference over all data points is −2 µ atm, however it appears to be a systematic pattern. Note the similarity in the pattern of the zero line in Fig. 8 and the 50 m depth contour shown in Fig. 3c. The shallower southern region, except for the areas close to English Channel, reveals a positive difference point-ing toward a slight underestimation of 1DICbioand in turn
332 H. Thomas et al.: pCO2in the North Sea
the computed NCP, or in other words, there are processes active in this region increasing the pCO2 in summer other
than temperature. Prime candidates for this were riverine in-puts with high DIC concentrations for European continental rivers, which have been reported by Thomas et al. (2005). The neglect of these DIC inputs tends to underestimate NCP, since additional NCP was required to provide the corre-sponding pCO2drawdown. Alkalinity release from the
sed-iment surface or rivers would in contrast decrease the pCO2
during this time of the year, however here we can only state that these processes are not dominant compared to the ap-parent increase in DIC. In the northern region the predicted pCO2decrease is less than the observed pCO2decrease
im-plying further processes, which decrease the pCO2. Prime
candidates here were the inputs of lower DIC water from the Baltic Sea and Scandinavian Peninsula during spring and summer, which apparently cause a “dilution” of the DIC and pCO2in the northern area. The consequence here would be
an overestimation of 1DICbioand in turn the computed NCP.
The uncertainty of the NCP estimate related to the pCO2
de-viation (Fig. 8) could be assessed with regard to the average deviation of −2 µ atm, which corresponds to approximately 1 µmol kg−11DICbio, which would most likely be too low,
since both tend to cancel out each other. A more realistic de-scription of the uncertainty can be obtained, when assessing the pCO2deviation individually for the shallower and deeper
regions. Both regions show an average deviation of 8 µ atm, which leads under consideration of (6) to an error of approx-imately 10% on 1DICbioand NCP, respectively.
The computation of NCP relies on the multiparameter lin-earization of the complex carbonate system equilibrium re-actions (Thomas et al., 2001; Thomas and Ittekkot, 2001). The linearization is based on an open-ocean relationship be-tween ATand salinity according to Millero et al. (1998). It
has been argued (Thomas and Ittekkot, 2001) that the com-putation of the DIC-change shows only a negligible depen-dence on the absolute values of AT, since the
multiparame-ter linearization has been established from differences. Still, in the near coastal areas the seasonal and regional variabil-ity in ATand salinity might become a source of uncertainty.
The average 1DICbioobtained here is 98 µmol kg−1(max.:
200 µmol kg−1, min.: 45 µmol kg−1)and according to (6) a change of salinity of 1 would approximately cause a change in 1DICbioof 1 µmol kg−1.
A more detailed consideration of these features goes be-yond the aim and capacity of the work presented here and would require more sophisticated tools such as coupled hy-drodynamic ecosystem models, which on the other hand are subject to other uncertainties. Still, the good agreement with a sophisticated DIC mass balance by Bozec et al. (2005b)1 shows that our straightforward approach does have the po-tential to reliably assess NCP and to identify and unravel the major controlling processes of the CO2system.
4.2 Net community production vs. gross primary produc-tion
Although it is generally assumed that the southern North Sea reveals higher gross primary productivity (see for example Joint and Pomroy, 1993; P¨atsch and Radach, 1997), net com-munity production is lower here than in the central and north-ern areas because of the competing gross primary production and community respiration in the annually well mixed water column of the south. This finding is in good agreement with the results of the sophisticated DIC mass balance approach by Bozec et al. (2005b)1. Gazeau et al. (2004) reported a mean gross primary production (GPP) in the North Sea of approximately 18 mol C m−2yr−1, which appears to be on a similar order of magnitude as the values given by P¨atsch and Radach (1997). The reverse spatial gradient of the GGP data by P¨atsch and Radach (1997) and our NCP data can be explained by the different bottom topographical settings, discussed above. The separation of production and respira-tion processes into upper and lower water column permits higher net carbon fixation in the surface layer of the north-ern region, while the shallower mixed water column prevents higher NCP values despite of higher GGP. A more detailed discussion of the relation between GPP and NCP in the North Sea is given by Bozec et al. (2005b)1, which employ an al-ternative, more sophisticated approach with higher temporal and spatial resolution.
4.3 Summary
Based on pCO2observations with high spatial and seasonal
resolution, the approach by Takahashi et al. (2002) has been applied to evaluate the processes governing the variability of pCO2in the North Sea. The analysis focuses on temperature
and biology as the major processes controlling pCO2in
sur-face waters, while other processes influencing the variability of the pCO2have been neglected. The northern area shows
a typical mid to high latitude behavior characterized by the strong seasonality of the biological processes. The southern part is a rather temperature controlled system, where biolog-ical net effects are vanished through near balanced produc-tion and respiraproduc-tion processes in the one-layered compart-ment. The highest seasonal amplitude of the pCO2 is
ob-served in the central part as a consequence of early stratifi-cation and high biological activity. The North Sea reveals a high NCP with higher values for the northern and central parts. Limitations of the approach proposed by Takahashi et al. (2002), when applied in coastal areas, are mainly related to additional DIC and ATsinks and sources, which cannot be
H. Thomas et al.: pCO2in the North Sea 333
Acknowledgements. The excellent co-operation of the captains
and the crews of “RV Pelagia” is gratefully acknowledged. This study has been encouraged by and contributes to the LOICZ core project of the IGBP and to CARBOOCEAN, an integrated
project of the European Union (contract no. 511176-2). It has
been supported by the Netherlands Organization for Scientific Research (Grants no. 810.33.004, 014.27.001), the Dutch-German bilateral co-operation NEBROC, the Belgium Science Policy (CANOPY, EV/03/20) and the European Union (EUROTROPH, EVK3-CT-2000-00040). The constructive comments by J. P¨atsch and an anonymous reviewer, which helped improve the manuscript significantly, are gratefully acknowledged. This is MARE contri-bution no. 073.
Edited by: C. M. Duarte
References
Bakker, D. C. E., de Baar, H. J. W., and de Wilde, H. P. J.: Dissolved carbon dioxide in Dutch coastal waters, Mar. Chem., 55 (3–4), 247–263, 1996.
Borges, A. V.: Do we have enough pieces of the jigsaw to integrate
CO2fluxes in the coastal ocean?, Estuaries, 28 (1), 3–27, 2005.
Borges, A. V., Delille, B., and Frankignoulle, M.:
Budget-ing sinks and sources of CO2 in the coastal ocean:
Diver-sity of ecosystems counts, Geophys. Res. Lett., 32, L14601, doi:10.1029/2005GL023053, 2005.
Borges, A. V. and Frankignoulle, M.: Distribution of surface carbon dioxide and air-sea exchange in the English Channel and adjacent areas, J. Geophys. Res., 198 (C5), doi:10.1029/JC000571, 1–14, 2003.
Borges, A. V. and Frankignoulle, M.: Distribution and air-water exchange of carbon dioxide in the Scheldt plume off the Belgian coast, Biogeochem., 59 (1–2), 41–67, 2002.
Borges, A. V. and Frankignoulle, M.: Daily and seasonal variations
of the partial pressure of CO2in surface seawater along Belgian
and southern Dutch coastal areas, J. Mar. Syst., 19, 251–266, 1999.
Bozec, Y., Thomas, H., Elkalay, K., and De Baar, H.: The con-tinental shelf pump in the North Sea - evidence from summer observations, Mar. Chem., 93, 131–147, 2005a.
Chen, C.-A., Liu, K.-K., and MacDonald, R.: Continental mar-gin exchanges, in: Ocean Biogeochemistry: a JGOFS synthesis, edited by: Fasham, M. J. R., Springer, 53–97, 2003.
Frankignoulle, M. and Borges, A. V.: European continental shelf as a significant sink for atmospheric carbon dioxide, Global Bio-geochem. Cycles, 15 (3), 569–576, 2001.
Frankignoulle, M., Bourge, I., Canon, C., and Dauby, P.:
Distri-bution of surface seawater partial CO2pressure in the English
Channel and in the Southern Bight of the North Sea, Cont. Shelf Res., 16 (3), 381–395, 1996.
Gazeau, F., Smith, S. V., Gentili, B., Frankignoulle, M., and Gat-tuso, J.-P.: The European coastal zone: characterization and first assessment of ecosystem metabolism, Estuarine, Coastal and Shelf Science, 60, 673–694, 2004.
IPCC: The scientific basis, in: Contribution of Working Group I to the Third Assessment Report of the Intergovernmental Panel on Climate Change, edited by: Johnson, C. A., Cambirdge Univer-sity Press, New York, 882pp., 2001.
Johnson, K. M., Wills, K. D., Butler, D. B., Johnson, W. K., and Wong, C. S.: Coulometric total carbon dioxide analysis for ma-rine studies: maximizing the performance of an automated gas extraction system and coulometric detector, Mar. Chem., 44, 167–187, 1993.
Joint, I. R. and Pomroy, A. J.: Phytoplankton biomass and produc-tion in the southern North Sea, Marine Ecology Progress Series, 99, 169–182, 1993
Kempe, S. and Pegler, K.: Sinks and sources of CO2in coastal seas:
the North Sea, Tellus, 43B, 224–235, 1991.
K¨ortzinger, A., Thomas, H., Schneider, B., Gronau, N., Mintrop,
L., and Duinker, J. C.: At-sea intercomparison of two
newly designed underway pCO2systems – encouraging results,
Mar.Chem., 52, 133–145, 1996.
Liu, K.-K., Atkinson, L., Chen, C. T. A., Gao, S., Hall, J., MacDon-ald, R., Talaue McManus, L., and Quinones, R.: Exploring conti-nental margin carbon fluxes on a global scale, EOS, 81, 641–644, 2000a.
Liu, K.-K., Iseki, K., and Chao, S.: Continental margin carbon fluxes, in: The Changing Ocean Carbon Cycle: a midterm syn-thesis of the Joint Global Ocean Flux Study, edited by: Field, J. G., Cambridge University Press, New York, 187–239, 2000b. Millero, F. J., Roche, P., and Lee, K.: The total alkalinity of Atlantic
and Pacific Waters, Mar. Chem., 60, 111–130, 1998.
P¨atsch, J. and Radach, G.: Long-term simulation of the eutrophica-tion of the North Sea: temporal development of nutrients, chloro-phyll and primary production in comparison to observations, J. Sea Res., 38, 275–310, 1997.
Pegler, K. and Kempe, S.: The carbonate system of the North Sea:
determination of alkalinity and TCO2 and calculation of PCO2
and Slcal (spring 1986), Mitt. Geol.-Pal¨aont. Inst. Univ.
Ham-burg, 35–87, 1988.
Sabine, C. L., Feely, R. A., Gruber, N., Key, R. M., Lee, K., Bullis-ter, J. L., Wanninkhof, R., Wong, C. S., Wallace, D. W. R., Tilbrook, B., Millero, F. J., Peng, T.-H., Kozyr, A., Ono, T., and
Rios, A. F.: The Oceanic Sink for Anthropogenic CO2, Science,
305, 367–371, 2004.
Sarmiento, J. L. and Gruber, N.: Sinks for anthropogenic carbon, Phys. Today, 8, 30–36, 2002.
Takahashi, T., Sutherland, S. C., Sweeney, C., Poisson, A., Metzl, N., Tilbrook, B., Bates, N. R., Wanninkhof, R., Feely, R. A.,
Sabine, C. L., Olafsson, J., and Nojiri, Y.: Global sea-air CO2
flux based on climatological surface ocean pCO2, and seasonal
biological and temperature effects, Deep-Sea Res. II, 49, 1601– 1622, 2002.
Thomas, H., Bozec, Y., de Baar, H. J. W., Elkalay, K., Frankig-noulle, M., Schiettecatte, L.-S., Kattner, G., and Borges, A. V.: The Carbon budget of the North Sea, Biogeosciences, 2, 87–96, 2005,
SRef-ID: 1726-4189/bg/2005-2-87.
Thomas, H., Bozec, Y., Elkalay, K., and De Baar, H.: Enhanced
open ocean storage of CO2 from shelf sea pumping, Science,
304, 1005–1008, 2004.
Thomas, H., Pempkowiak, J., Wulff, F., and Nagel, K.: Autotrophy, nitrogen accumulation and nitrogen limitation in the Baltic Sea: a paradox or a buffer for eutrophication?, Geophys. Res. Lett., 30 (21), 2130, doi:10.1029/2003GL017937, 2003.
Thomas, H., England, M. H., and Ittekkot, V.: An off-line 3D model
of anthropogenic CO2uptake by the oceans, Geophys. Res. Lett.,
334 H. Thomas et al.: pCO2in the North Sea
28 (3), 547–550, 2001.
Thomas, H. and Ittekkot, V.: Determination of anthropogenic CO2
in the North Atlantic Ocean using water mass ages and CO2
equi-librium chemistry, J. Mar. Syst., 27, 325–336, 2001.
Tsunogai, S., Watanabe, S., and Sato, T.: Is there a
“continen-tal shelf pump” for the absorption of atmospheric CO2?, Tellus,