arXiv:hep-ph/0612248v2 14 Mar 2007
(will be inserted by the editor)
Beam-helicity asymmetry in photon and pion electroproduction
in the ∆(1232) resonance region at Q
2
= 0.35 (GeV/c)
2
I.K. Bensafa1, P. Achenbach2, M. Ases Antelo2, C. Ayerbe2, D. Baumann2, R. B¨ohm2, D. Bosnar5, E. Burtin3,
X. Defa¨y1, N. D’Hose3, M. Ding2, M.O. Distler2, L. Doria2, H. Fonvieille1,a, J.M. Friedrich8, J. Friedrich2,
J. Garc´ıa Llongo2, P. Janssens4, G. Jover Ma˜nas2, M. Kohl2, G. Laveissi`ere1, M. Lloyd2, M. Makek5, J. Marroncle3,
H. Merkel2, P. Merle2, U. M¨uller2, L. Nungesser2, B. Pasquini7, R. P´erez Benito2, J. Pochodzalla2, M. Potokar6, G. Rosner9, S. S´anchez Majos2, M. Seimetz2,3, S. ˇSirca6, T. Spitzenberg2, G. Tamas2, R. Van de Vyver4,
L. Van Hoorebeke4, Th. Walcher2, and M. Weis2
1 Laboratoire de Physique Corpusculaire IN2P3-CNRS, Universit´e Blaise Pascal, F-63170 Aubi`ere Cedex, France. 2 Institut f¨ur Kernphysik, Johannes Gutenberg-Universit¨at, D-55099 Mainz, Germany.
3 CEA Dapnia-SPhN, C.E. Saclay, F-91191 Gif-sur-Yvette Cedex, France.
4 Department of Subatomic and Radiation Physics, University of Gent, B-9000 Gent, Belgium. 5 Department of Physics, University of Zagreb, HR-10002 Zagreb, Croatia.
6 Institut Joˇzef Stefan, University of Ljubljana, SI-1001 Ljubljana, Slovenia.
7 Dipartimento di Fisica Nucleare e Teorica, Universit`a degli Studi di Pavia, and INFN, Sezione di Pavia, Pavia, Italy. 8 Physik Department, Technische Universit¨at M¨unchen, D-85748 Garching, Germany.
9 Department of Physics and Astronomy, University of Glasgow, Glasgow G12 8QQ, UK.
Received: date / Revised version: date
Abstract. The beam-helicity asymmetry has been measured simultaneously for the reactions→e p → e p γ and→e p → e p π0 in the ∆(1232) resonance region at Q2= 0.35 (GeV/c)2. The experiment was performed
at MAMI with a longitudinally polarized beam and an out-of-plane detection of the proton. The results are compared with calculations based on Dispersion Relations for virtual Compton scattering and with the MAID model for pion electroproduction. There is an overall good agreement between experiment and theoretical calculations. The remaining discrepancies may be ascribed to an imperfect parametrization of some γ(∗)N → πN multipoles, mainly contributing to the non-resonant background. The beam-helicity asymmetry in both channels (γ and π0) shows a good sensitivity to these multipoles and should allow future improvement in their parametrization.
PACS. 13.40.-f Electromagnetic processes and properties – 13.60.Fz Elastic and Compton scattering – 13.60.Le Meson production – 14.20.Gk Baryon resonances with S=0
1 Introduction
Polarization observables are powerful tools to study hadron structure. They have seen intensive developments in the recent years in semi-inclusive and exclusive reactions, at high and low energies. At high energies they are detailed probes of mechanisms at the parton level, e.g. in the study of the transverse spin structure of the nucleon in semi-inclusive deep inelastic scattering [1], or of the general-ized parton distributions in exclusive deep virtual Comp-ton scattering (DVCS) [2]. At lower energies, models of nucleon structure have to address the non-perturbative regime of QCD without the help of hard sub-mechanisms. The relevant degrees of freedom can be quarks, like in con-stituent quark models, or bare hadrons surrounded by a
a corresponding author,e-mail helene@clermont.in2p3.fr
pion cloud, like in chiral perturbation theories. Polariza-tion observables provide specific insights, since they are more sensitive to different amplitude combinations, or in-terferences, than unpolarized cross sections. For example an important effort is being pursued to investigate the multipoles contributing to the formation of the P33
reso-nance ∆(1232) by performing low-energy pion electropro-duction experiments [3,4].
Photon electroproduction on the proton, ep → epγ, is another interesting channel for that purpose. It gives access to virtual Compton scattering (VCS) γ∗p → γp.
This process has a sensitivity to the electromagnetic struc-ture of the nucleon that is complementary to that of, e.g., elastic scattering or pion production. At low energy W in the (γp) center-of-mass system, the VCS process al-lows to access the generalized polarizabilities (GPs) of the nucleon, related to the VCS amplitude at vanishing
en-ergy of the outgoing photon [5]. These observables have been measured recently at different values of the four-momentum transfer squared Q2 at MAMI [6], JLab [7]
and MIT-Bates [8].
When going above the pion threshold, the VCS ampli-tude TV CSacquires an imaginary part due to the coupling
to the πN channel. Therefore single polarization observ-ables, which are proportional to Im(TV CS), become
non-zero above pion threshold. A particularly relevant observ-able is the single-spin asymmetry (SSA) or beam-helicity asymmetry: SSA = (σ↑− σ↓)/(σ↑+ σ↓) where σ↑ and σ↓
designate the photon electroproduction cross section with beam helicity state + and −, respectively. As it was first pointed out in ref. [9], the SSA yields direct information on the absorptive part of the VCS amplitude, and on the relative phase between the VCS amplitude and the Bethe-Heitler (BH) contribution. The BH process refers to the photon emission by the incoming or outgoing electron and it adds coherently to the VCS amplitude. Moreover, the VCS amplitude can be split into a Born part, given in terms of nucleon ground state properties (the electromag-netic form factors), and a non-Born part which contains all nucleon excitations and meson-loop contributions. Since the BH and Born-VCS contributions are purely real, the SSA is proportional to the imaginary part of the non-Born VCS amplitude. In particular, the numerator of the SSA can be written as Im(TV CS) · Re(TV CS+ TBH). After
development, one obtains the sum of a pure VCS contri-bution and a VCS-BH interference term which has the effect to enhance the asymmetry. The absorptive part of the VCS amplitude can be obtained, through unitarity re-lation, from the photo- and electro-production amplitudes on the nucleon. In the region of W ∼ 1.2 GeV, the most important contribution is from πN intermediate states, as schematically depicted in fig. 1, while mechanisms in-volving more pions or heavier mesons in the intermediate states are suppressed. Regarding the Q2-dependence, the
pion photoproduction description is on solid experimental grounds, while electroproduction data are scarce. There-fore a measurement of the beam SSA in the ∆-resonance region gives a direct test of how well the description of the VCS amplitude holds, in terms of the available phe-nomenological information on pion photo- and electro-production amplitudes. This is the main purpose of the experiment described in the present paper.
In the case of DVCS one has a known φ-dependence of the numerator and denominator of the SSA. In our kine-matic regime this dependence is not known analytically. However, the Dispersion Relations (DR) model calcula-tion discussed in seccalcula-tion 4 gives a shape of the asymmetry close to a sin φ, despite the distortion of the numerator and denominator due to the BH process.
Since in the experiment the reaction ep → epπ0was
de-tected too, the beam SSA was also measured in this chan-nel, complementing previous measurements of this type at different kinematics [3,10]. In pion electroproduction, the beam SSA, also called ρ′
LT, is proportional to the fifth
structure function R′
LT [11] and is mainly sensitive to the
Im ... Ν(p) Ν(p’) γ∗(q) γ(q’) Ν γ π N Ν γ∗
Fig. 1.The imaginary part of the VCS amplitude decomposed using unitarity.
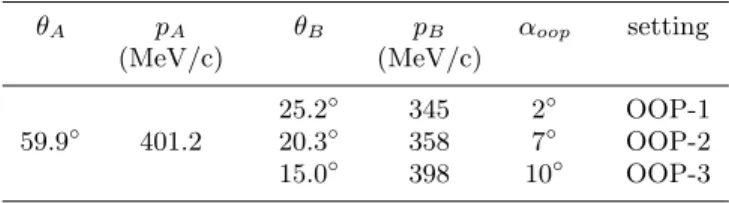
Table 1.Experimental settings for spectrometers A (electron arm) and B (proton arm): values of the horizontal angles θA
and θB w.r.t. the beam direction, and the central momenta pA
and pB. αoopis the out-of-plane angle of spectrometer B.
θA pA θB pB αoop setting (MeV/c) (MeV/c) 25.2◦ 345 2◦ OOP-1 59.9◦ 401.2 20.3◦ 358 7◦ OOP-2 15.0◦ 398 10◦ OOP-3
multipole ratios S1+/M1+ and S0+/M1+ in the region of
the ∆ resonance.
2 The experiment
The experiment was performed at the Mainz Microtron MAMI using the 100 % duty cycle electron beam at an energy of 883.2 MeV, allowing for a longitudinal beam po-larization Peof 75-85 %. Helicity reversal was performed
every second, and beam current values were typically 13-25 µA. The experiment used the standard equipment of the A1 collaboration [12]: the Møller polarimeter to mea-sure Peonce a day, the 5 cm long liquid Hydrogen target,
spectrometer A to detect the scattered electron at a fixed setting, and spectrometer B to detect the final proton at three different out-of-plane settings. Table 1 summarizes the kinematical settings, corresponding to an average Q2
of 0.35 (GeV/c)2 and a virtual photon momentum in the
center-of-mass qcm = 600 MeV/c, similar to a previous
VCS experiment at MAMI [6]. However, here W is above pion threshold (W ∼ 1.2 GeV) and the virtual photon po-larization ǫ = 0.48 is the highest achievable at this value of W .
The detector package in each spectrometer includes a set of two double-planes of vertical drift chambers (VDC) for particle tracking and two segmented planes of scintil-lators for particle identification and timing measurements. The experiment also uses the threshold gas ˇCerenkov coun-ter in spectromecoun-ter A for electron identification. The beam was off-centered horizontally in order to minimize the path-length in Hydrogen for the low-energy emitted protons. Analysis cuts include particle identification for the final electron and proton, good quality tracks in the VDCs, and rejection of backscattered protons at the entrance window of spectrometer B. A specific cut is applied to eliminate protons emitted at the most upward angles, which hit a piece of the target holding system. Empty target cell studies showed that the rate of background events from
0 5000 10000 15000 -40 -20 0 20 40
Counts
0 5000 10000 15000 -40 -20 0 20 40 T (ns)AB 0 2000 4000 6000 -2 -1 0 1 2 0 2000 4000 6000 -2 -1 0 1 2γ
0 5000 10000 x 10 -2 -1 0 1 2 0 5000 10000 x 10 -2 -1 0 1 2π
0Fig. 2.The coincidence time spectrum for a sample of the data (no cuts). Inserts: zoom on the central peak after analysis cuts, for the full statistics in both channels: γ (left) and π0 (right)
electroproduction.
eA → epX reactions in the target walls was negligible compared to the rate of ep → epπ0 events, but not negli-gible compared to the rate of ep → epγ events. Therefore a cut on the target length is applied in the analysis of the γ channel, but not in the π0 channel.
Fig. 2 shows the spectrum of coincidence time (TAB)
for triggers in coincidence between the two spectrometers. The central peak represents the true (e, p) coincidences and has a FWHM of 1 ns. Without any cuts, one notices a secondary peak near TAB = −2 ns due to true (π−, p)
coincidences, which is eliminated by a cut on the ˇCerenkov counter signal in spectrometer A. After all cuts, the level of random coincidences is still high for the γ channel, as il-lustrated by the insert on fig. 2. Events are selected within ± 1.4 ns in the central peak, and random coincidences are subtracted using side-band events.
The four-momentum of the third, undetected particle is reconstructed by the missing energy and missing mo-mentum associated to the detected (ep) system. Fig. 3 shows the final spectrum of the missing mass squared (M2
x). The most prominent peak is due to π0
electropro-duction events. The second peak, centered on M2 x= 0, is
due to photon electroproduction events, and its smallness reflects the smallness of the corresponding cross section. This spectrum is obtained after a careful calibration of ex-perimental parameters, such as the beam position along the horizontal transverse axis, a casual layer of frost on the target walls, and the central momentum of spectrom-eter B for each run period, which was changed by less than a few 10−3 w.r.t. its nominal value. The separation
between the two peaks in M2
x is well-achieved. Both peaks
are similar in shape: they have the same central width due to experimental resolution, and a radiative tail extending to larger values. An empirical fit of this shape (see curves on fig. 3) allows to quantitatively estimate the residual π0
events under the photon peak, yielding a contamination C = 4 %. All other background processes, e.g. coming
0 10000 20000
Counts
γ
π
0
FWHM = 2600 MeV2 0 10000 20000 0 500 1000 -0.01 0 0.01 0.02 0.03 0.04 0 500 1000 -0.01 0 0.01 0.02 0.03 0.04 Mx2 (GeV2) Fig. 3.Top: the missing mass squared spectrum within analy-sis cuts and after subtraction of random coincidences. Bottom: the same histogram truncated in ordinate to enhance the pho-ton peak, plus a fit function drawn for each peak (solid lines) and the sum (dashed line).from the target walls, are reduced to a negligible level within the analysis cuts. Finally, the two physics channels are selected by the following cuts in M2
x: [−0.005, 0.005]
GeV2for the ep → epγ process and [0.013, 0.029] GeV2for
the ep → epπ0 process. The achieved statistics are then
38k true γ events and 1M true π0 events. More details on
the analysis can be found in refs. [13,14].
3 Analysis method and results
Fig. 4 shows the angular phase space coverage for photon electroproduction events: θcm
γ∗γ is the polar angle between the initial and final photons of the Compton scattering process and φ is the azimuthal angle between the leptonic and hadronic planes as illustrated on figure 5. The value of φ = +90◦ corresponds to the missing particle emitted
along the direction of k × k′, where k and k′ are the
mo-menta of the incoming and scattered electrons. The three settings cover altogether the region of forward polar an-gles up to 40◦, and a domain in φ narrowing around 220◦
as θcm
γ∗γ increases. According to model calculations, the asymmetry is maximal at forward polar angles for VCS, whereas it is maximal at backward angles for π0
electro-production. The region of forward angles was chosen, since the experiment was optimized for VCS.
Since the SSA is a relative quantity, the data do not need to be corrected for detector inefficiencies, deadtimes, etc. Only false asymmetries were checked, and found to be very small: the beam charge asymmetry (for which the data are corrected) is of the order of 10−3. The phase
space is binned in θcm γ∗γ (4
0 100 200 300 0 10 20 30 40 50 OOP-1 OOP-2 OOP-3 Θ (deg) φ (deg) 0 100 200 300 0 10 20 30 40 50 γ*γ cm
Fig. 4. The accepted phase space in terms of the polar and azimuthal angles of the Compton scattering process.
p
p’
φ
θ
cm γ∗γγ
’
γ∗
e’
e
Fig. 5. Kinematics of the ep → epγ reaction in the γp center-of-mass.
experimental resolution) and in each θ-bin the SSA is de-termined as one value, corresponding to one central kine-matical point. To this end the asymmetry is fitted to the assumption SSA = K · sin φ (cf. section 1) and the fac-tor K is determined by a maximum likelihood method. The probability associated to event i is proportional to (1 + hiPeK sin φi) where hi is the beam helicity state (+1
or −1) and φi the azimuthal angle of the event. The
like-lihood method includes the treatment of random coinci-dences and also yields the statistical error on K. As a cross-check, a more classical method is used, based on the count rates N+ and N−: the asymmetry A = (N+ −
N−)/(N++ N−)/P
e is calculated in finite bins in φ and
then fitted to the same shape A = K · sin φ.
The final asymmetry is computed as K · sin 220◦, i.e. it
is projected to φ = 220◦, a value close to the average over
the acceptance. Since the central kinematics vary slightly from bin to bin, one makes a projection to a fixed, nominal kinematics in (Q2, W, ǫ) :
SSAexpnom.kin.= SSAexpexp.kin. × SSA
model nom.kin.
SSAmodelexp.kin.
by use of a model: Dispersion Relations [15] for ep → epγ and the unitary isobar model MAID [16] for ep → epπ0.
The nominal point corresponds to our average ep → epγ kinematics: Q2 = 0.35 (GeV/c)2, W = 1.19 GeV and
ǫ = 0.48. For the π0 channel, the accepted phase space
is very similar. The same analysis method is used, and the asymmetry is projected from the experimental average
Table 2. Summary of systematic errors (more details can be found in [14]).
type of error amount of error 1) beam polarization ∆Pe/Pe = ±0.02
2) π0contamin. (γ) ∆C = ± 2 % (C = 4 %) 3) radiative correction ±100 % of the correction 4) proj. to nom.kin. proj. factor varied by ± 10 % 5) calibration of ∆θA= ±0.5 mrad (electron)
momenta and angles ∆pB/pB = ±1 · 10−3 (proton)
6) stability within cuts cuts in TAB, acceptance, Mx2etc.
(Q2 = 0.34 (GeV/c)2, W = 1.21 GeV, ǫ = 0.47) to the
same nominal kinematics as above. This choice results in all projection factors as close as possible to 1, which is desirable in order to minimize projection errors.
Systematic errors are estimated from the sources of un-certainty listed in table 2. These errors are propagated to the asymmetry, either analytically (items 1 to 4) or by run-ning the analysis in different conditions (items 5, 6) and taking the spread of the resulting SSA. Concerning item 2, the SSA in photon electroproduction is corrected for π0
contamination, using SSA = SSAraw· (1 + C) to first
or-der, and a ± 50% uncertainty is applied on C. Concerning item 3, radiative corrections to the asymmetry are gener-ally small, as shown in [17,18]. They have been computed for the present kinematics [19,20] and found negligible, therefore they are ignored in the analysis. However, an er-ror is assigned to this procedure; the erer-ror considered in table 2, item 3, is a way to account for model uncertainties that are present in the calculation of radiative corrections. Items 1 to 4 of this table yield very small errors; the domi-nant systematic errors come from items 5 and 6. The main errors of the calibration are in the electron scattering angle and the proton-arm central momentum; other calibration parameters (see section 2) have much less influence. The quadratic sum of partial systematic errors bin-per-bin is presented in table 3 together with our final SSA result and its statistical error. The latter is still by far the dom-inant error. In the VCS channel, the statistical error is enlarged by a factor ∼ 1.8 due to the high level of random coincidences.
4 Discussion
4.1 Photon electroproduction channel
The result of the measurement of →e p → epγ is displayed on fig. 6 together with the calculation of the DR formal-ism of refs. [15,21]. This model has been developed for real and virtual Compton scattering at moderate energies up to the ππN threshold. It is the only model available in the literature that calculates specifically Im(TV CS),
Table 3. Beam SSA result for the two reactions, at nominal kinematics: Q2=0.35 (GeV/c)2, W =1.19 GeV, ǫ=0.48, φ = 220◦ . → e p → e p γ channel θcm γ∗γ( ◦
) SSA ∆SSAstat ∆SSAsyst
2.6 -0.021 0.026 0.015 6.0 -0.035 0.017 0.006 9.8 -0.032 0.020 0.011 14.0 -0.026 0.030 0.016 17.9 -0.014 0.034 0.020 21.9 -0.121 0.044 0.021 26.1 -0.050 0.046 0.023 29.9 -0.053 0.050 0.034 33.7 -0.004 0.070 0.047 → e p → e p π0 channel θcm γ∗π( ◦
) SSA ∆SSAstat ∆SSAsyst
2.5 0.0016 0.0035 0.0017 5.9 -0.0007 0.0028 0.0011 9.9 -0.0059 0.0033 0.0024 14.0 -0.0064 0.0040 0.0018 17.9 -0.0077 0.0043 0.0021 22.1 -0.0055 0.0053 0.0031 26.2 -0.0033 0.0043 0.0022 30.0 -0.0032 0.0039 0.0016 33.7 -0.0078 0.0049 0.0014 37.4 -0.0205 0.0090 0.0039 -0.2 0 0.2 0 10 20 30 40 -0.2 0 0.2 0 10 20 30 40 Θ (deg)
SSA
ep
→→
ep
γ
DR Model (Λα , Λβ) = (0.8, 0.7) GeV (Λα , Λβ) = (1.4, 0.7) GeV (Λα , Λβ) = (0.8, 0.4) GeV (Λα , Λβ) = (1.4, 0.4) GeV cm γ*γFig. 6.The beam SSA in photon electroproduction at nominal kinematics compared to the calculation of the DR model (using MAID2003 multipoles) for several values of the free parameters Λα, Λβ. The inner error bar is statistical, the outer one is the
quadratic sum of statistical and systematic errors.
-0.2 0 0.2 0 10 20 30 40 -0.2 0 0.2 0 10 20 30 40 Θ (deg)
SSA
ep
→→
ep
γ
DR Model (Λα , Λβ) = (1.4, 0.7) GeVusing MAID2003 re-fit (πN) multipoles
using MAID2003 (πN) multipoles
cm
γ*γ
Fig. 7.The beam SSA in photon electroproduction: sensitivity to the MAID (πN ) multipoles.
invariant amplitudes are given by s-channel dispersion in-tegrals, in which the imaginary part is calculated through unitarity, taking into account the contribution from πN intermediate states. Multipoles for γ(∗)N → πN are taken
from the MAID 2003 analysis.
The DR model has two free parameters, Λαand Λβ,
re-lated to the electric and magnetic GPs and parametrizing their unconstrained part, i.e. asymptotic behaviour and dispersive contribution beyond πN . It is clear from fig. 6 that the SSA exhibits little sensitivity to the GPs. By comparison to the theoretical curves displayed on the fig-ure, one can state that for this given set of πN multipoles the trend of the data is to favor high values of Λα and
low values of Λβ, i.e. high values of the electric GP and
high values of the magnetic GP. As a reminder, in the DR model the electric GP increases with Λα, while the
magnetic GP decreases with Λβ.
As explained above, the main feature of the beam SSA is that it is fully sensitive to Im(TV CS).
There-fore our measurement is a direct test of the calculation of this quantity. The experimental shape of the SSA in fig. 6 is rather smooth, similarly to the DR prediction. The measured asymmetry is in overall good agreement with the theoretical calculation, although the latter tends to overestimate the magnitude of the asymmetry gradu-ally as θcm
γ∗γ increases. This suggests that the calculation of Im(TV CS) can be improved. In that respect, the πN
multipoles, which are an essential input to the DR calcu-lation of VCS, may need a better parametrization. It is worth noting that on the one hand the beam SSA in VCS as given by the DR model is insensitive to the change of parametrization from the “2000” to “2003” version of MAID (at least in our kinematics). On the other hand it is sensitive to further “re-fits” such as the one cited in ref. [4], which involves an adjustment of the longitudinal multipoles S1+ and S0+ in the π0p channel. In
partic--0.02 0 0.02 0 10 20 30 40 -0.02 0 0.02 0 10 20 30 40 Θ (deg)
SSA
ep
→→
ep
π
0
MAID 2000 MAID 2003 MAID 2003 re-fit DMT model cm γ*πFig. 8. The beam SSA in π0 electroproduction at nominal
kinematics, compared to theoretical calculations. Same con-vention as figure 6 for the error bars.
ular, figure 7 shows that the calculation with this re-fit gives a lower asymmetry, in better agreement with the trend of the data at increasing angles. Nevertheless, since this MAID re-fit [4] was performed at kinematics different from the present experiment, there is room left for further πN multipole adjustment. Other possibilities like contri-butions beyond πN are very unlikely, since our measured range in W is mostly below the two-pion threshold.
4.2 Pion electroproduction channel
The result of the measurement of→e p → epπ0is displayed
on fig. 8. At small angles up to θcm γ∗π = 20
◦, the data are
in very good agreement with the MAID model [16] (ver-sions “2000” and “2003”) and the DMT model [22]. Also shown is the MAID re-fit [4] mentioned above, in which the longitudinal multipoles S1+ and S0+ have been adjusted
essentially at Q2=0.2 (GeV/c)2. Applied to our Q2of 0.35
(GeV/c)2 [23], this version yields a much lower
asymme-try than the other predictions, and not in better agree-ment with our measureagree-ment. It was already suggested in [10] that a simple rescaling of the S1+and S0+multipoles
cannot account for the Q2-dependence of the data.
Beyond 20◦ the data of fig. 8 tend to suggest some
structure which no model can reproduce. In the s and p wave M1+-dominance approximation, the fifth structure
function R′
LT is proportional to sin θcmγ∗π·Im{(6 cos θγcm∗πS1+ + S0+)∗M1+} [11]. To describe the rapid θ-variations that
we observe for the SSA is quite challenging; it requires the contribution from higher-order multipoles which produce a non-resonant background modulating the resonant M1+
contribution, as already noticed in ref. [10].
5 Conclusion
The beam-helicity asymmetry has been measured simulta-neously for photon and π0electroproduction in the ∆(1232)
resonance region. The measured asymmetries are of the order of a few percent for γ and smaller than 1% for π0.
There is an overall good agreement between our measure-ment and the theoretical calculations, based on the DR and MAID models. The remaining discrepancies in shape or magnitude of the asymmetry might be ascribed to an imperfect parametrization of some πN multipoles, mainly contributing to the non-resonant background.
Concerning virtual Compton scattering, which was the main goal of the experiment, we have performed the first measurement of the beam SSA in photon electroproduc-tion at low energies. The latter provides an important cross-check for the input to the DR formalism for VCS since the imaginary part of the VCS amplitude is con-nected through unitarity to the γ(∗)N → πN multipoles.
In order to improve the agreement between experiment and theory for the beam SSA in the photon and electro-production channels, one could attempt a simultaneous fit of the two observables, by changing the parametrization of some π0electroproduction multipoles. In that view, the
observables in the two physics channels become coupled. Therefore the data presented in this paper address in a new way important questions by showing how the simul-taneous measurements in several de-excitation channels (γN and πN ) can help to gain new insights for our un-derstanding of the nucleon and resonance phenomena at low energy.
We thank the MAMI accelerator staff for providing the excellent polarized beam. We thank L.Tiator for valu-able discussions and for providing his MAID re-fit result, and M.Vanderhaeghen and G.Smirnov for their contribu-tion to the calculacontribu-tion of radiative correccontribu-tions. This work was supported by the Deutsche Forschungsgemeinschaft (SFB 443), the Federal State of Rhineland-Palatinate, the French CEA and CNRS/IN2P3, the BOF-Gent University and FWO-Flanders (Belgium) and the EPSRC, UK.
References
1. X. Ji et al., Phys. Lett. B638 (2006) 178, hep-ph/0604128. 2. M. Diehl, Phys. Rept. 388 (2003) 41, hep-ph/0307382. 3. P. Bartsch et al., Phys. Rev. Lett. 88 (2002) 142001,
nucl-ex/0112009.
4. D. Elsner et al., Eur. Phys. J. A27 (2006) 91, nucl-ex/0507014.
5. P.A.M. Guichon, G.Q. Liu and A.W. Thomas, Nucl. Phys. A591 (1995) 606, nucl-th/9605031.
6. J. Roche et al., Phys. Rev. Lett. 85 (2000) 708.
7. Jefferson Lab Hall A, G. Laveissiere et al., Phys. Rev. Lett. 93 (2004) 122001, hep-ph/0404243.
8. P. Bourgeois et al., Phys. Rev. Lett. 97 (2006) 212001, nucl-ex/0605009.
9. P. Kroll, M. Schurmann and P.A.M. Guichon, Nucl. Phys. A598 (1996) 435, hep-ph/9507298.
10. CLAS, K. Joo et al., Phys. Rev. C68 (2003) 032201, nucl-ex/0301012.
11. D. Drechsel and L. Tiator, J. Phys. G18 (1992) 449. 12. K.I. Blomqvist et al., Nucl. Instrum. Meth. A403 (1998)
263.
13. I.K. Bensafa, PhD thesis, UBP Clermont-Ferrand, 2006, DU 1647.
14. . H.Fonvieille and . I.K.Bensafa, LPC Internal reports PCCF-RI-0604 and PCCF-RI-0605 (2006).
15. B. Pasquini et al., Eur. Phys. J. A11 (2001) 185, hep-ph/0102335.
16. D. Drechsel et al., Nucl. Phys. A645 (1999) 145, nucl-th/9807001, http://www.kph.uni-mainz.de/MAID/. 17. M. Vanderhaeghen et al., Phys. Rev. C62 (2000) 025501,
hep-ph/0001100.
18. A.V. Afanasev, M.I. Konchatnij and N.P. Merenkov, J. Exp. Theor. Phys. 102 (2006) 220, hep-ph/0507059. 19. . H.Fonvieille, LPC Internal report PCCF-RI-0607 (2006). 20. G.I. Smirnov, (2005), hep-ph/0504045.
21. D. Drechsel, B. Pasquini and M. Vanderhaeghen, Phys. Rept. 378 (2003) 99, hep-ph/0212124.
22. S.S. Kamalov and S.N. Yang, Phys. Rev. Lett. 83 (1999) 4494, nucl-th/9904072, http://www.kph.uni-mainz.de/MAID/dmt/.